

The popularity of the ‘Repeal Year’ agitation of 1842–3 against British rule in Ireland has been credited to religious and political grievances, the power of personality, and the beginnings of cultural nationalism. This article explores to what extent economic factors were also behind the sudden rise in popularity of Daniel O'Connell and the Repeal Association's campaign for repeal of the Act of Union of 1800. In particular, it examines whether O'Connell was in any way correct in proclaiming ‘there never was a greater blunder in political economy than the application of the principles of free trade to a country circumstanced as Ireland is’.Footnote 1 It examines whether the British government's economic policy of reducing tariffs and lifting import bans in 1842 damaged Ireland's agricultural economy and increased popular support for the Repeal movement and the well-known ‘Monster’ meetings of 1843. In addition to evidence taken from contemporary newspapers and a range of private papers and diaries, quantitative techniques are used to extend the analysis of the Repeal Year beyond the purely qualitative analysis of political and religious factors used by previous historians.
Political interpretations of the ‘Repeal Year’ crisis have been developed by Maurice O'Connell, Kevin Nowlan, and Lawrence McCaffrey in the high tradition of political history, mainly using O'Connell's, Robert Peel's, and James Graham's papers as their primary sources.Footnote 2 These historians, unsurprisingly, came to the same conclusion that Peel and Graham did themselves: that the Repeal movement was the product of a series of political and religious grievances against British rule in Ireland. In the 1980s, as part of the turn towards emphasizing the role of religion in political history, Kerr stressed the importance of these religious grievances in explaining the sudden rise of the Repeal movement in his influential work Peel, priests, and politics.Footnote 3
Alternatively, some historians of Irish nationalism have seen the Repeal movement as an early manifestation of Irish cultural nationalism. John Hutchinson has positioned it as a forerunner to the Gaelic revival movement and Richard Davis has pointed out its links to the cultural nationalism of Young Ireland.Footnote 4 Looking at economic influences, Naoki Sakiyama has sought to emphasize the role of the Dublin merchants in contributing to the development of cultural nationalism in the 1840s, culminating in the foundation of the Irish Confederation in 1847. However, the ‘Repeal Year’ campaign of 1842–3 was left unconsidered.Footnote 5
From a British economic perspective, historians working on the fiscal aspects of Peel's policies in 1842 have not considered their impact on Irish economic and political life.Footnote 6 This is rather surprising as scholars including Derek Beales, Eugenio Biagini, Colin Matthew, Gareth Stedman Jones, and Frank Trentmann have stressed the importance of fiscal concerns in mid-nineteenth-century popular politics, and Paul Bew, Philip Bull, and Peter Gray have emphasized the importance of British economic policy in Irish politics during other periods, particularly regarding land reform.Footnote 7 From an Irish economic perspective, the only detailed study of O'Connell's social and economic thought, by Joseph Lee, neglects O'Connell's and Repeal's protectionist rhetoric in support of Repeal at well-attended and prominently reported ‘Monster’ meetings in favour of emphasizing his personal links with the Whigs, Jeremy Bentham, and other free trade supporters in Britain.Footnote 8 Although Paul Pickering has investigated O'Connell's relationship with the ‘Native Manufacturing Campaign’, he has not linked Repeal's rhetoric of ‘economic nationalism’ to the surge in popular support for the movement in the early 1840s.Footnote 9 Patrick Geoghegan's most recent biography of O'Connell prefers to highlight Repeal as a campaign for ‘liberty’ against ‘slavery’, rather than examine its economic motivations.Footnote 10 No historian or economist has yet investigated the impact of economics and trade policy on the Repeal agitation, in the way Malcolm Chase has examined the economic incentives for Chartism and David Williams for the contemporaneous ‘Rebecca Riots’ in Wales. Chase notes that in England ‘the years of highest commodity prices were ones in which Chartist mobilisation peaked’ whereas Williams suggested that the falling price of agricultural produce in 1842, combined with increased road tolls and structural economic decline, contributed to the civil unrest in western Wales that became known as the Rebecca Riots during the 1842–3 period.Footnote 11 While England was more dependent on manufacturing, West Wales's stability in economic and political terms ‘depended to a marked degree on the prosperity of agriculture and a period of depression inevitably produced agrarian unrest’.Footnote 12
This article will also attempt to explain the sudden nature of the rise in popularity of the Repeal movement in late 1842 and 1843. Although O'Connell started the Precursor Society in 1838 and the Loyal National Repeal Association in 1840, they attracted little interest before late 1842 and early 1843.Footnote 13 Repeal meetings were ‘a discouraging display of empty benches’.Footnote 14 However, by the summer of 1843, ‘Monster’ meetings regularly received crowds of over 100,000, with reports of over a million people attending the largest one ever held, at Tara, in August 1843.Footnote 15 This sudden rise in the popularity of the Repeal movement, starting in October 1842 and lasting until O'Connell's arrest in October 1843, cannot be explained by continuing long-term political and religious grievances alone, nor by structural factors by themselves.
The investigation of the economic aftermath in Ireland of Peel's tariff reductions and lifting of import bans on beef and pork in the 1842 budget, and any link to the sudden rise of the Repeal agitation in 1842–3, is carried out in four steps. First, it starts with an examination of the economic rhetoric of the Repeal movement. This used British trade policy and the 1842 downturn to attract support in the 1842–3 period. The rhetoric is very evident in O'Connell's ‘Monster’ meeting speeches in The Nation as well as the minutes of the Repeal Association and its associated organizations including its economic campaigning body, the Repeal Board of Trade. Such polemic ensured the economic discomfort felt by the populace at large was linked in their minds with resentment against British rule.
Secondly, it is shown how tariff reduction policies in the 1842 budget could be linked to a short but sharp economic downturn in 1842 from a theoretical standpoint. The period of increased economic ‘distress’ between 1842 and 1843 has not been clearly identified in the economic histories that include that time. Instead, it has been dismissed as a ‘mini-famine’, in spite of a lack of evidence of falling harvest yields in those years, and, perhaps, because the development of free trade in Ireland has in recent decades been linked with long-run economic growth.Footnote 16 However, more recently work by Paul Bairoch, Kevin O'Rourke, Michael Clemens, and Jeffrey Williamson for other countries has questioned whether free trade and growth always correlated in the nineteenth century.Footnote 17 Therefore, the impact of the 1842 budget should be examined without the preconception that free trade always produced economic growth in this era. Using this approach, the long-run neo-classical model quoted by Cormac Ó Gráda as linking food prices, employment, and agricultural rents will be adjusted for the assumptions of sticky rents and sticky investment over a one year period. Footnote 18 The revised model indicates that Peel's tariff reforms and consequential falls in food prices, theoretically, could have produced a disproportionate fall in rural incomes in the short run.
Thirdly, economic data from contemporary sources indicates that there is empirical evidence to support a connection between the budget and a fall in food prices. Price data for export foodstuffs has been taken from the market reports of newspapers on a weekly basis in three main exporting cities in order to assess changes at the time of the 1842 budget.Footnote 19 The timing of the fall in prices of Ireland's main agricultural exports coincides with the timing of the 1842 budget reforms. This agrees with other economic data, including banking and bankruptcy statistics, as well as contemporaries' descriptions of the situation in letters, diaries, and market reports which also suggest a causational relationship between the easing of import restrictions and the 1842 downturn.
Fourthly, the statistical link between the economic ‘distress’ of 1842 and the rise in popularity of the Repeal movement in 1842–3 is explored. In conjunction with the Repeal movement's focus on economic issues, there appears to be a robust relationship between falling food prices and the sudden rise in popular support for the Repeal movement in 1842–3 as evidenced by the level of Repeal rent. Not only does this suggest that Irish economic and political stability was more reliant on tariff protection in the 1840s than historians have hitherto recognized, but also suggests that the United Kingdom's shift towards unilateral free trade in this decade had adverse political consequences in Ireland.
I
A large part of the argument for the repeal of the Union was put forward in economic terms by O'Connell and the wider Repeal movement who blamed adverse trade policies for the economic slump of the early 1840s. Contrary to Lee's emphasis on O'Connell's free trade rhetoric in Britain, the evidence from contemporary Irish newspaper reports of O'Connell's and the Repeal Association's activities suggests that economic issues and trade policy were at the heart of his case for Repeal.Footnote 20 From its early days, O'Connell sought to unite Protestant and Catholic behind Repeal using promises of economic benefit as an incentive. At a Repeal meeting of 1841 he asked ‘How do I propose to obtain Repeal? I answer – first by conciliating men of all persuasions and opinion.’Footnote 21 He went on to describe the way that Protestant landowners would benefit through abolition of the cess and increasing property values and how poor Catholic voters would be given support from the Repeal rent. The Irish share of national debt was argued to be unfair and reducing this burden would benefit both Protestant and Catholic taxpayers.
In the 1842–3 period, O'Connell focused more on ‘native manufactures’ that he claimed had been disadvantaged by British trade policy since the Union. When promoting the Repeal rent fund for donations to the movement in October 1842, The Nation reported the Repeal Association's economic case for Irish people to donate to the Repeal ‘Rent’: ‘Recollect that you are not working for yourselves and your own best interests. In sustaining O'Connell, you assist in reviving Irish trade and manufactures.’Footnote 22 O'Connell himself, at Monster meetings and in the press, argued that Repeal would undo Irish economic decline under the Union through a Repeal parliament's ‘protection’. In November 1842, he complained of ‘the want of protection, or rather in the disadvantagement of Irish manufactures’ which he blamed on ‘political economy’.Footnote 23 In launching the Repeal Year, O'Connell explicitly cited ‘the encouragement and perfecting of Irish manufactures’ and ‘agriculture’ as a key reason behind pressing forth with ‘our Repeal agitation for 1843’.Footnote 24 This formed a key part of his ‘Monster’ meeting speeches throughout 1843, with speeches often focusing on economic issues for about two-thirds to three-quarters of their total length. He often attempted to relate the poverty of individuals he met on the Repeal agitation campaign to free trade policies conducted under the Union:
the Irish manufactures having been destroyed by the want of protection of an Irish parliament … turning again to the father I inquired the cause of his distress, and in pitiful accents he told me it was the decline of [the agricultural] trade and the want of employment … visit your poorhouses, and you will find two-thirds of their emaciated frames … whom want of employment has forced to seek protection from the shadow of these prison-like almonries. The decline of trade is general, and poverty must follow…If you wish to cure the evil that presses them, the remedy is in your hands. Pledge yourselves by a solemn obligation to use or purchase no goods that are not wrought by the hands of Irish artists.Footnote 25
O'Connell also stressed how an Irish legislature could reverse post-Union economic distress in each area he visited. In Wicklow on 6 August 1843, O'Connell argued that the Repeal Association was the only group campaigning to reverse the economic decline of Irish agriculture and industry: ‘Is there any person endeavouring to do good to the people but the Repealers? Is there anybody labouring for the improvement of her manufactures, or her commerce, or for her agricultural prosperity, but the Repealers?’Footnote 26 O'Connell particularly appears to support some forms of protectionism at a Repeal Banquet in July 1843:Footnote 27
We want the protection of a domestic legislature…thus you will observe that the export trade of Ireland in that time [before free trade with Britain] amounted to two millions of pounds sterling more than we imported. What is the case now? We export scarcely anything of Irish manufacture – we import more than five million pounds worth. And what is the remedy for that? Nothing but the existence of an Irish parliament.Footnote 28
As O'Connell was supporting free trade in England at this same point, newspapers in Britain started to attack O'Connell for appearing to abandon his previous free trade stance in favour of protectionism. The Times alleged that the object of O'Connell's protectionism was to ‘keep alive the slumbering embers of sedition’ and to gain popular support for the Repeal campaign.Footnote 29 Newspapers supporting the Whigs were equally critical. The Morning Chronicle labelled O'Connell's protectionism as ‘ignorant’, a ‘folly’, and a cynical bid for public support.Footnote 30 The Era satirized O'Connell's declaration that ‘everything coming from England should be burnt, except coals’!Footnote 31 O'Connell's actual stance on the Corn Laws from early 1842 had been that it was an English matter and to do with conflict between ‘aristocracy’ and ‘serfs’; as such, the poor should be supported because relieving poverty was ‘a cause of all – a holy – a religious cause’.Footnote 32
The question between you [the English] and the sordid aristocracy – for sordid they are – is whether or not they have a right to tax your bread … it is a question of the loaf. It is a question of whether one class of Englishmen shall say to another ‘you shan't eat your breakfast until you have a paid me for leave with some of the loaf’.
Whilst Peel might dance the ‘Jim Crow’ – in O'Connell's words – for the English working classes, the nationalist leader could thus support both the lowering of wheat tariffs for England but ‘protection’ for Ireland.Footnote 33
As well as O'Connell's Monster meeting speeches, written in English and reported in middle-class newspapers including The Nation, the focus on economic issues can be seen strikingly in local Repeal speeches written in Irish and aimed at the very poorest in society. It was the poorest Irish-speaking peasants and labourers who swelled the ranks of those at the Monster meetings and contributed by a large number of small amounts to the Repeal rent. The few remaining records of Repeal speeches in Irish focus almost entirely on the argument that a Repeal parliament would be able to reverse the economic distress the Union and free trade had caused.Footnote 34 As one speech, given in the Stabannon chapel, within a poor, rural community, commented on the fall in food prices:
Look at yourselves! Look at the poor, naked condition of your families. Look, moreover, at your naked women and them incapable of helping you in any way! Look at your rents going out of the country and they being spent in a foreign land! Look at the corn, the cattle, the pigs, and even the hens being swept from you every day to England, and you yourselves, poor and naked, in want of food, money, and means, straining the potatoes by day and night, and you working like poor tenants for a bite that is taken from your own mouths without even being thanked for it! Isn't the state in which you are truly pitiable?Footnote 35
Repeal's economic rhetoric was not empty. It was supported by the detailed research of campaigning organizations allied to the Repeal Association. In order to develop a strong argument in support of Repeal, based on economic and trade policy, bodies including the ‘Repeal Board of Trade’ were founded to research and present the economic case for Repeal.Footnote 36
The Repeal Board of Trade was an attempt to incorporate commercial and agricultural interests into the Repeal agitation campaign ‘pledged to the exclusive use of Irish manufactures’ and ‘to stimulate, still more, the production of Irish manufactures, as well as their consumption’, through holding meetings, producing research, and by political campaigning.Footnote 37 It quickly ‘lost no opportunity of impressing on the people the absolute necessity of supporting Irish manufactures’, particularly in ‘rural districts’, hit hardest by the reduced agricultural tariffs of the 1842 budget.Footnote 38 Their instincts were to protect infant industries and agriculture; in essence, they were mercantilist. They vowed to ‘prevent by all legal means the consumption in Ireland of articles not manufactured in this country’, through ‘the restoration of a domestic and protective parliament’, by using tariffs and other legal means of the state.Footnote 39 Efforts were made to prevent produce being sold in the colonies as Irish when it was not.Footnote 40 O'Connell and the Repeal Board of Trade even supported the setting up of a chain of markets which only sold Irish agriculture produce, to boost Irish agriculture.Footnote 41 Young Ireland supporters of O'Connell, such as John Mitchel and John Martin, also promoted the view that Britain's political economy was a tool used by Britain to impoverish Ireland.Footnote 42
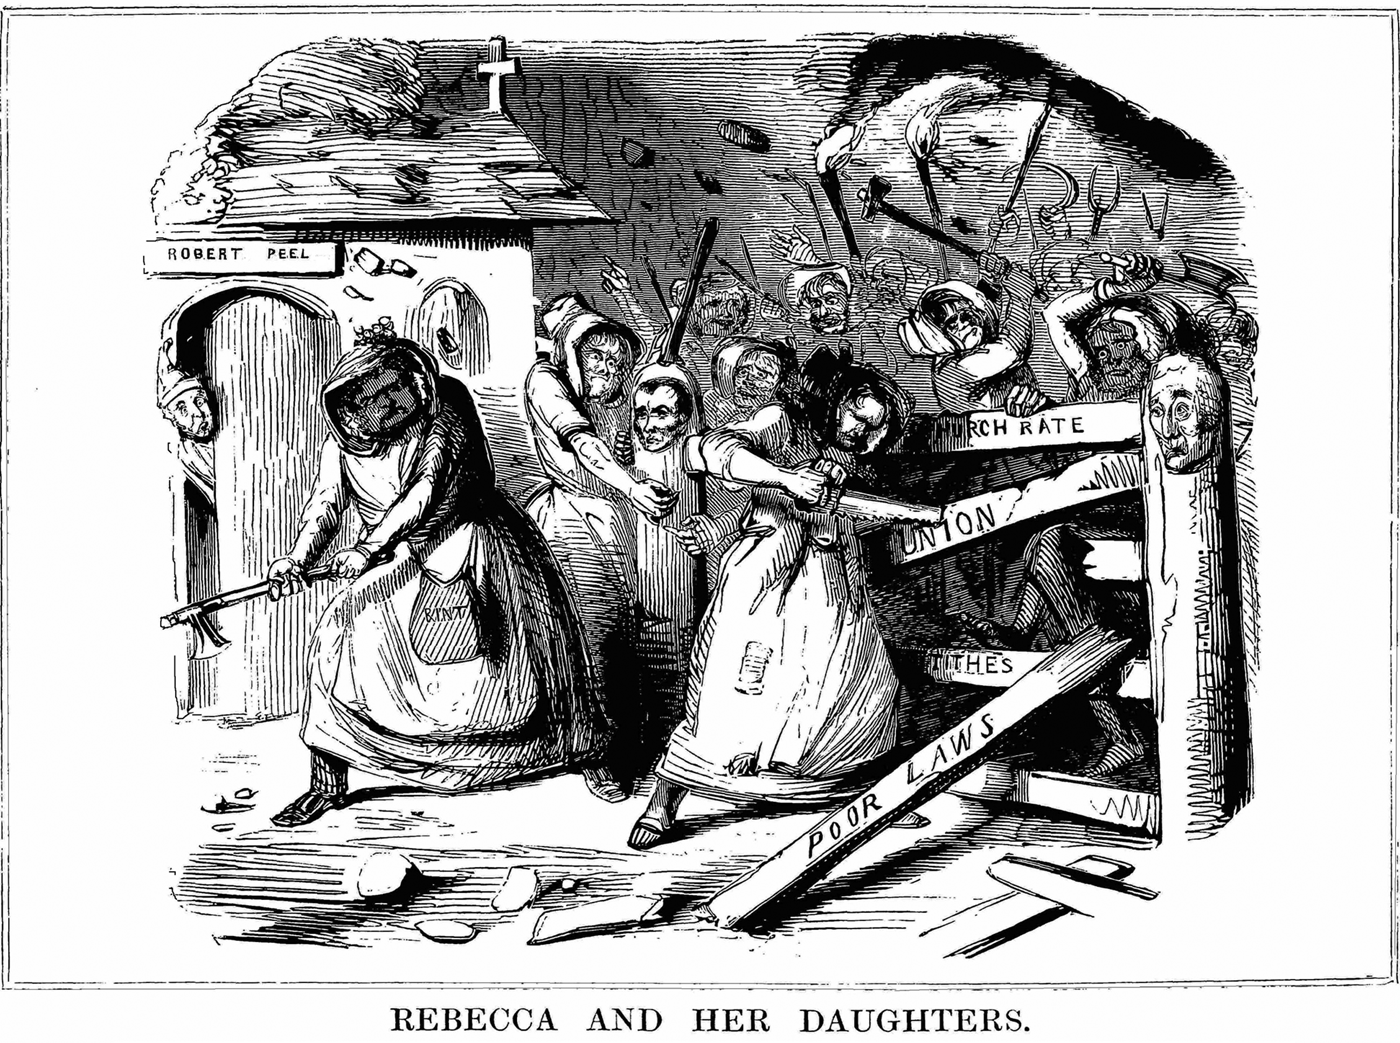
The economic rhetoric being produced by O'Connell, the Repeal Association, and its associated bodies in the newspapers was noted by the lord-lieutenant in Dublin Castle and by the press in London. The lord-lieutenant, the earl de Grey, wrote to Peel arguing ‘I firmly believe that O'Connell began his re-enactment of the [Repeal] question as a financial measure.’Footnote 43 Similar views were held in London by Punch and The Times. Punch magazine represented Repeal as an economic issue in the early 1840s (see Figure 1), by suggesting it shared economic characteristics with the Rebecca Riots of the previous year in Wales. It shows O'Connell, dressed as a woman, leading a crowd to destroy the gate of British government, represented by the duke of Wellington on the gatepost and Peel at the tollhouse. On the gate were written some of Repeal's economic grievances, including free trade under the ‘Union’, the introduction of ‘Poor Law’ rates, and increases in the ‘Church Rate’ and ‘Tithes’. The Times criticized ‘the late selfish attempt to merge the cause of the Irish poor in that of factious Radicalism and Repeal’ which, it suggested, intended to create support based on economic nationalism for Repeal, and came to the conclusion from letters by Repealers that the movement was not religious, to the extent of seeking ‘the banishment from the country of all religion, whether Protestant, Roman Catholic, or any other whatsoever’.Footnote 44 In contrast, Peel saw Repeal's grievances as religious in nature. However, the immediate impact on Ireland of the economic reforms of 1842 had not been fully considered by Peel before they were enacted; Graham sympathized with the lord-lieutenant of Ireland that ‘Ireland will be forgotten’ by Peel in the 1842 budget whilst ‘taxation and finance will be our real difficulties’.Footnote 45 Peel's preoccupations in 1842 with the ‘reduction in the price of food’ his electorate in Tamworth demanded and with eliminating the United Kingdom-wide deficit left him no time to consider Irish policy.Footnote 46 These were the prevailing circumstances under which Peel's 1842 budget was enacted. This combination of circumstances created a situation which was highly conducive to the budget having the unintended consequence of damaging the Irish economy and boosting Repeal's popularity in its immediate aftermath.
Punch suggested that Irish economic grievances were behind Repeal's popularity by comparing them with the Rebecca Riots in Wales

II
However, the link between reducing import restrictions and a loss of economic welfare, such as that exhibited in the slump of 1842–3, is still a matter of contention in economic theory. Alice Murray, an Edwardian economic historian, linked reductions in food prices resulting from Peel's lower tariffs in the 1840s to falling real incomes in Ireland.
The mass of the Irish people are dependent on agriculture, and have been dependent upon it all through the century. As consumers they may have slightly gained by the abolition of the duties on food stuffs, but as producers, nearly altogether dependent upon agriculture, they have lost in a far greater degree. The untaxed supply of foreign corn, live stock, meat, dairy produce, and other food stuffs led to cheap prices in the British markets, and severe foreign competition caused a decline in Irish agriculture.Footnote 47
More recently, Louis Cullen has argued there is a link between periods of low food prices and increased distress and unrest in 1820s and 1830s Ireland.Footnote 48 However, Ó Gráda has presented the current commonly held view that a neo-classical growth model suggests that in the long run, Irish agricultural protection in the nineteenth century damaged the living standards of agricultural labourers.Footnote 49 The argument goes that although the ‘terms of trade moved in Ireland's favour’ with agricultural prices rising faster than industrial ones, this hurt Irish prosperity and ‘reduced the living standard of workers’.Footnote 50 The reasoning is that the benefits from the higher food prices fed more into higher rents for absentee landlords than farmers’ wages or profits. Rather than losing more as producers than they gained as consumers, in the way Murray described, this model suggests that Irish farmers and labourers gained little from high food prices, and, as consumers, lost out more.
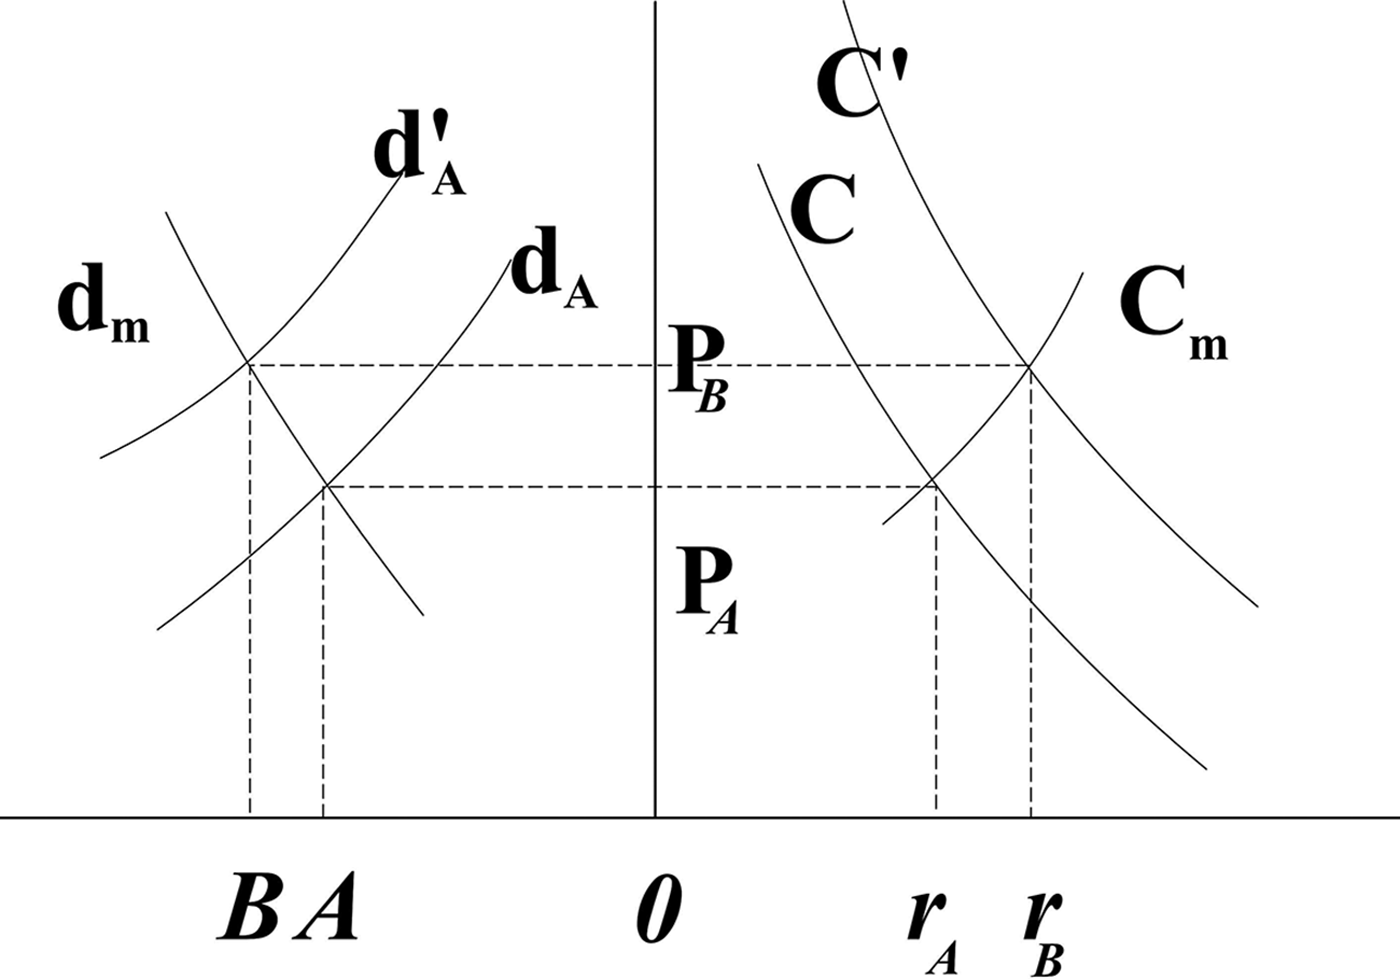
The neo-classical model Ó Gráda quotes (Figure 2) shows that an increase in food prices due to protection would cause a greater rise in food prices than rise in agricultural employment, leading to falling real incomes in agriculture, as the benefit from the higher food prices would feed into higher rents to absentee landlords instead. Rising food prices, represented by curve dA shifting to d’A and C to C’, increases the rent payable from r A to r B and shifts the equilibrium in the labour market from A to B. From this, it has been concluded that the disadvantages of rising food prices would have outweighed any employment advantage and caused as much distress in agricultural Ireland as it did in industrial Britain.Footnote 51 It follows from this argument that the intention behind the tariff reductions of the 1842 budget to reduce food prices could have had a positive effect on Irish living standards.
The neo-classical model of the early 1840s Irish economy quoted by Ó Gráda Based on: Ó Gráda, Ireland before and after the famine, p. 38.
KEY:
r ArB = rent levels
dAd’A = change in wage against employment
A B = employment levels
PA PB = wage level
C C’ = change in wage against rent
However, in the short run, this neo-classical model overestimates the price elasticity of rents and underestimates the available underemployed labour supplies in a harvest situation, as in autumn 1842. Chronic underemployment in Ireland during this period meant that the elasticity of change in labour supply would have been high, even in the short run. However, as rents were set before the size of the harvest was known, changes in rents would have been slower and therefore less than the Figure 2 model indicates and ‘sticky’ rents during the agricultural year would have had the same effect.Footnote 52 With ‘sticky’ rents, variations in prices would disproportionately impact farmers’ incomes and employment levels.
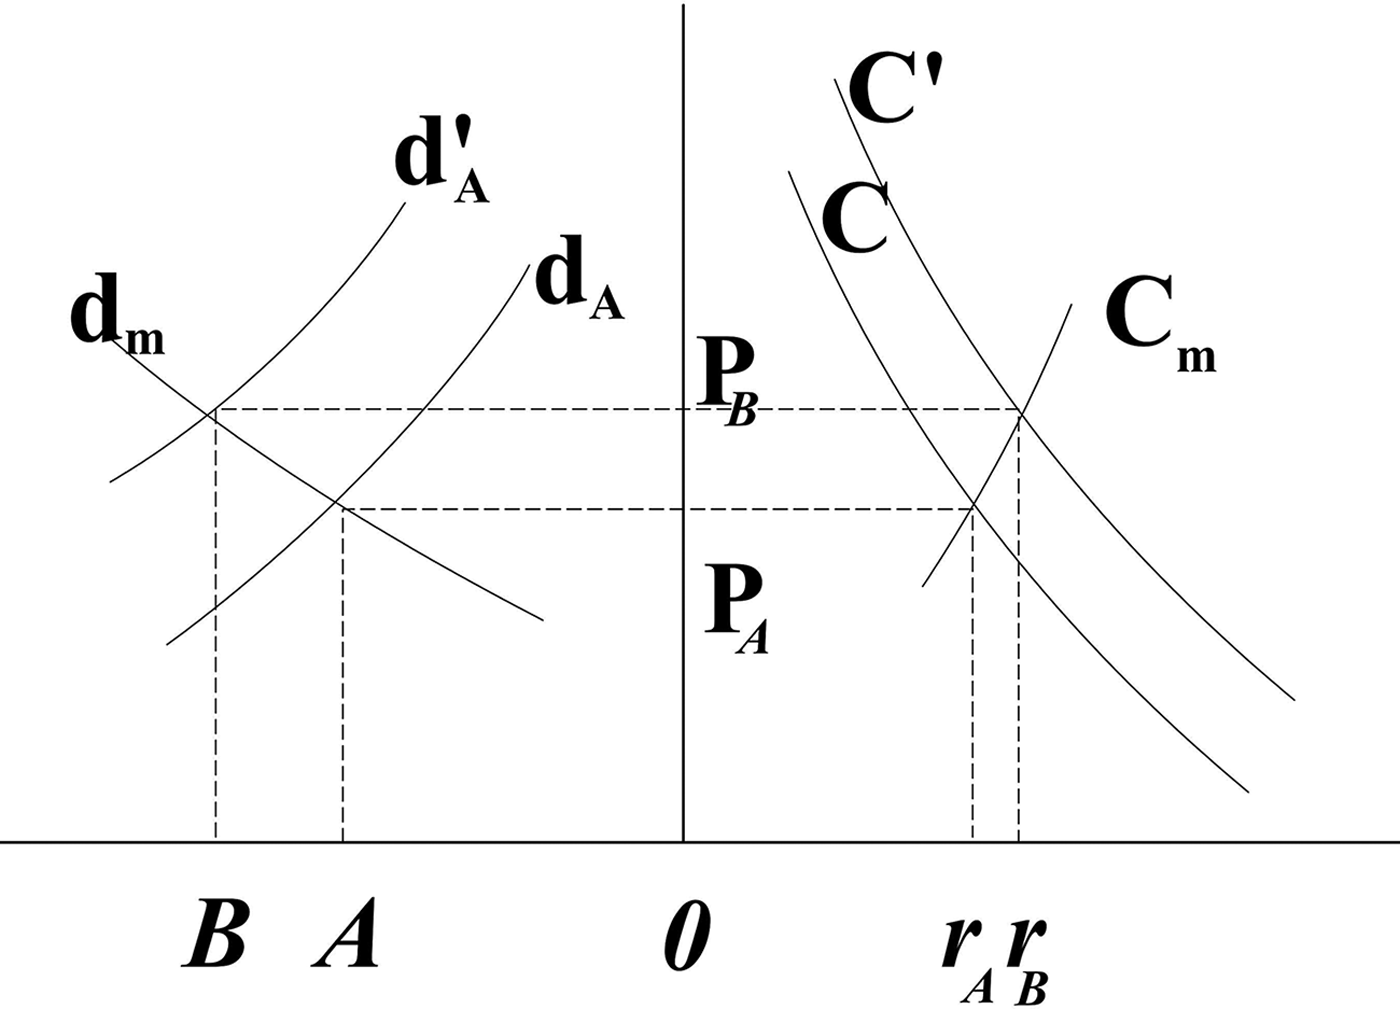
Adjusting for an inelastic change in land rents curve and elastic change in labour curve in the short run, the model would in fact show that employment would disproportionately gain from tariff (and therefore price) increases, and lose from falling tariffs. When changes in rents are inelastic and changes in labour are elastic, curve Cm would have a very steep gradient and d m would have a gradient of between −1 and 0 (shallow, but negative). This is illustrated in Figure 3, which shows that a rise in wage levels (PA to PB) would cause a greater proportional increase in employment in the economy overall (A to B) than the extra rent paid to landlords (r A to r B). In this model, if rents were set too high, with sale prices lower than expected due to lower food prices, this would disproportionately reduce real agricultural incomes, as employment would readjust more rapidly than ‘sticky’ rents, and would fall faster than food prices. This suggests that a small decrease in food prices could immediately and disproportionately reduce real wages and cause considerable unrest over issues such as rents and leases, supporting the effect noted by Cullen.
The neo-classical model altered to fit the short-run inelasticity. Based on: as Fig. 2.
KEY:
r ArB = rent levels
dAd’A = change in wage against employment
A B = employment levels
PA PB = wage levels
C C’ = change in wage against rent
Therefore, adjusting the assumptions of the model to those which existed in the 1842–3 period, real wages would theoretically rise, not fall, when food prices increase due to agricultural protection. As Murray noted, there were more agricultural than non-agricultural workers in Ireland and over half of Ireland's GDP was produced by the agricultural sector, so more people would have benefited in agriculture from rising food prices than those who would have lost from increased food costs in the industrial and service sectors. It is likely that an aggregate real rise, rather than a fall in wages, would have happened when food prices rose. Conversely, falling prices would have had the opposite effect. Therefore, theoretically, the sudden 1842 tariff reductions and lifting of restrictions would have reduced prices in the short term before rents had time to adjust, resulting in wages falling faster than prices, in other words a decrease in real wages. Associated social and political unrest was to be expected in this situation.
III
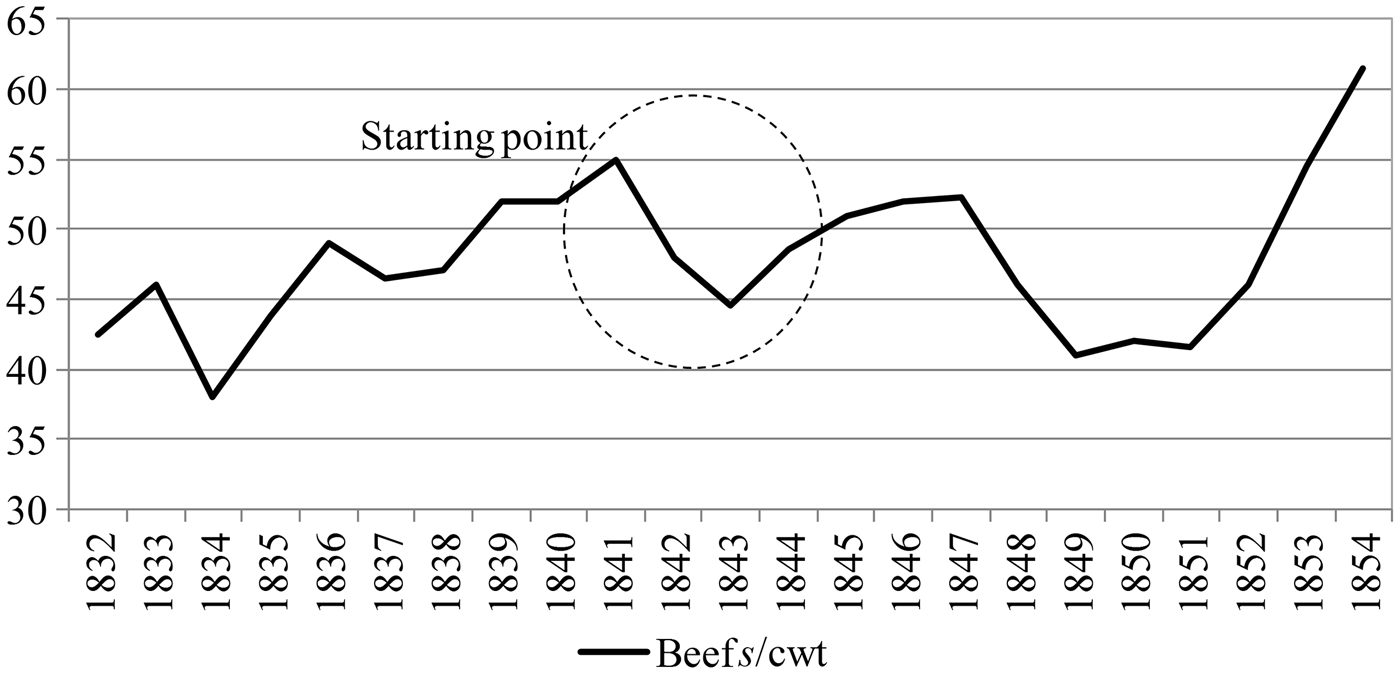
The actual effect of the 1842 tariff reductions on Irish food prices and the Irish economy can be investigated by examining the market prices which were commonly published in the Irish local newspapers of the time. Liam Kennedy and Peter Solar have made an extensive and ground-breaking study of local newspaper market reports in order to produce a reliable set of food prices for Ireland.Footnote 53 Their annual data for beef prices (Figure 4) can be used to set the context of this study.Footnote 54 A general increase after the Napoleonic wars is interrupted by falls in 1842–3 and 1848–52. Both periods could, perhaps, be caused by a continuous downward pressure after the 1842 budget, the surge between them being due to famine conditions.
Price of Irish beef, Oct.–Dec. data (s/cwt)
This study now investigates the starting point, 1842–3, in more detail by concentrating on local price divergences and short-term variations in contrast to examining ‘aggregate or composite price indices’.Footnote 55 Therefore data has been re-sampled from the original sources on a high-frequency, monthly, basis, from January 1837 to December 1850 and weekly from January 1842 to December 1843. An initial investigation of five food types in nine locations found that meat markets exhibited the greatest price changes. Using this information, a decision was made to sample systematically by focusing on bacon pigs and beef as main income-producing products for small and larger farmers respectively in three major ports of export: Cork, Dublin, and Waterford. Prices were taken from the The Constitution; or Cork Advertiser, the Freeman's Journal, and The Waterford Mail. Bacon prices were substituted for pigs in Dublin in the longer time period as bacon pig prices were not available for some of the period.
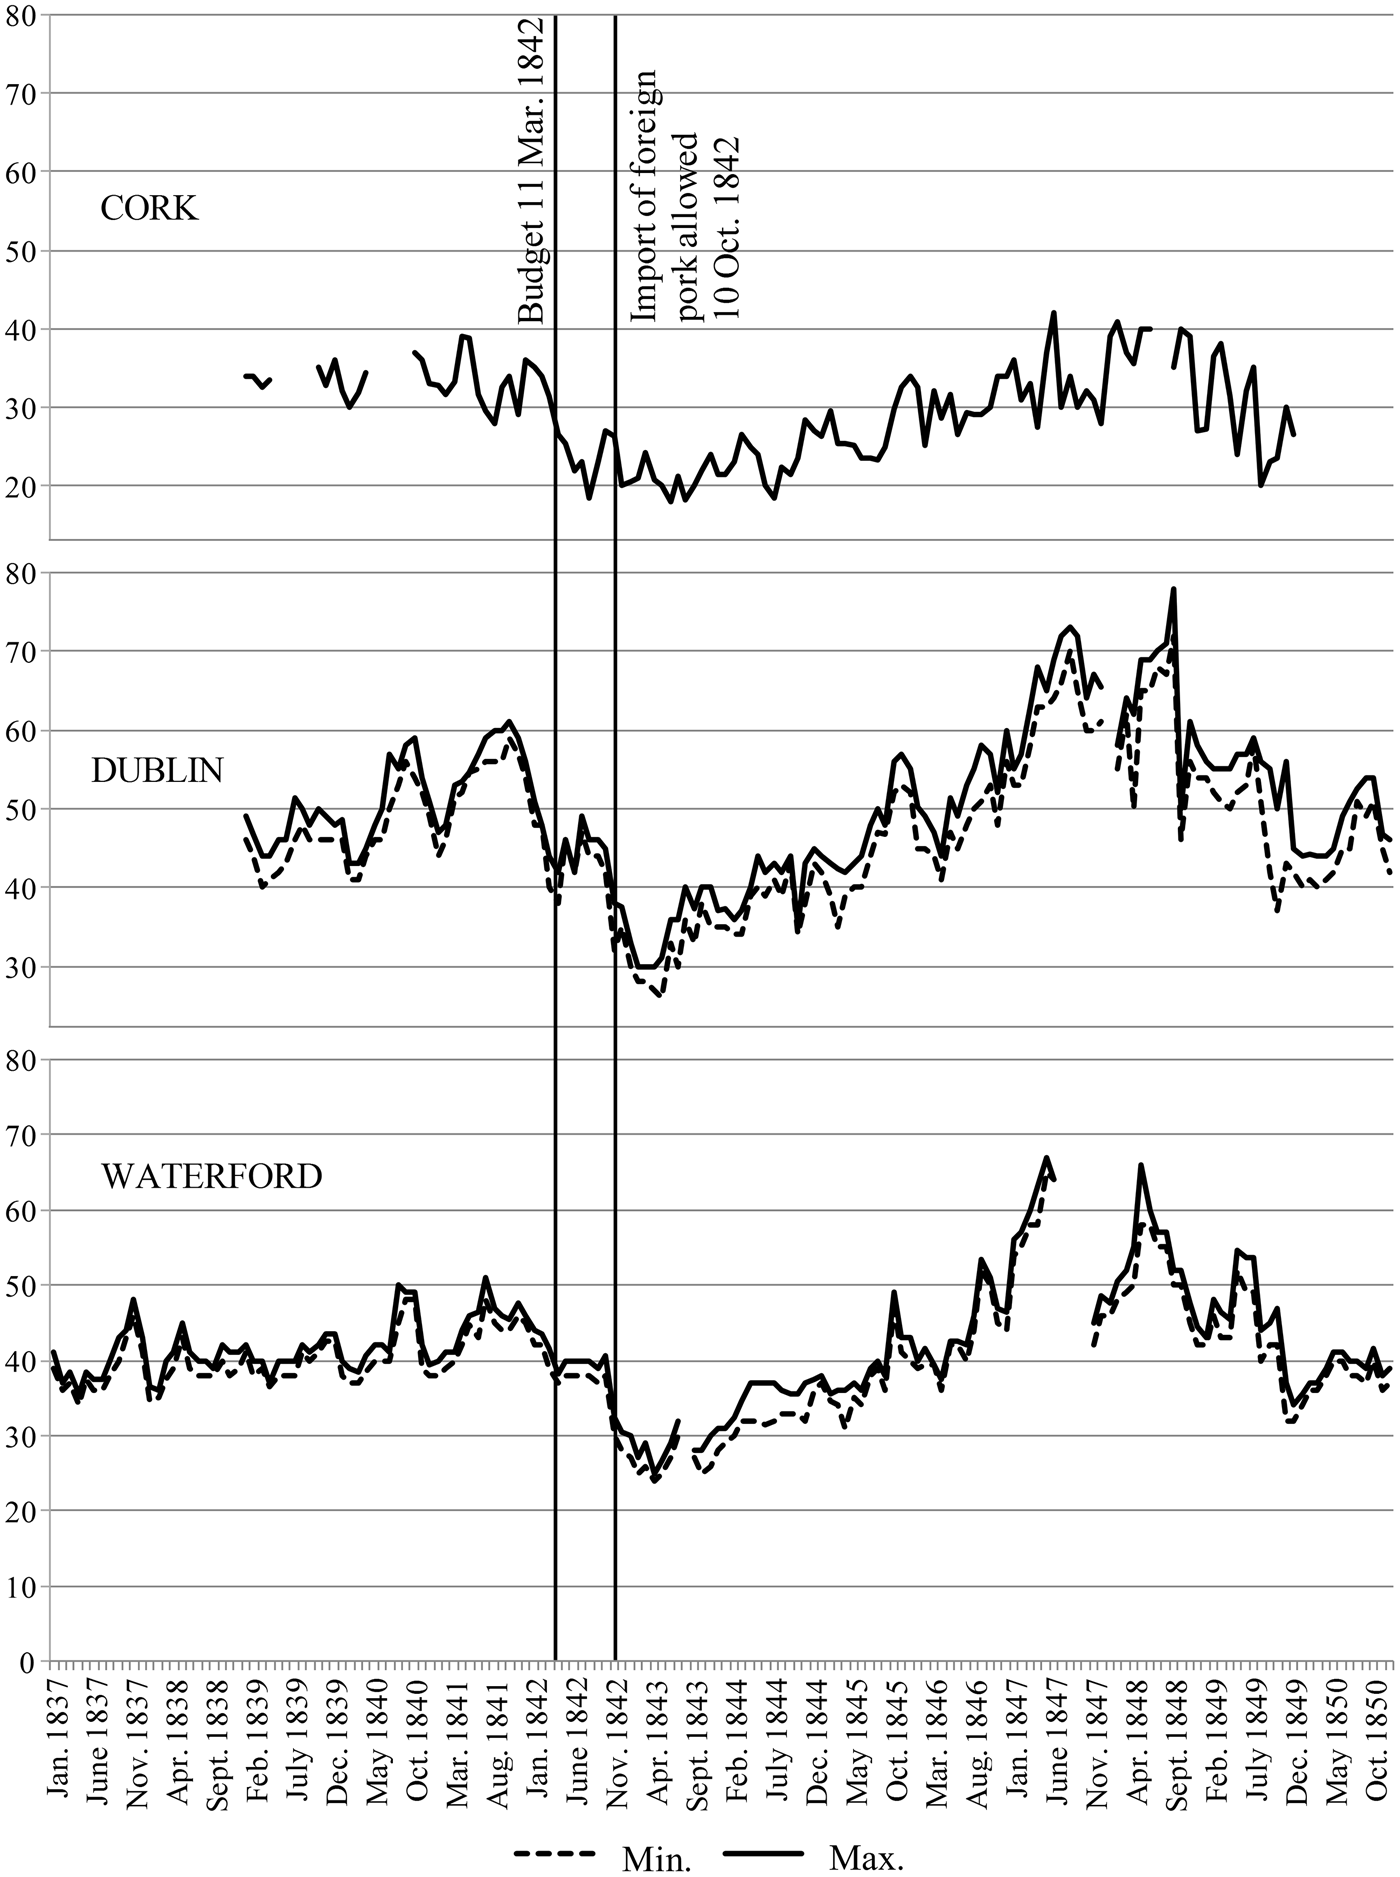
Comparing the timing of the budget with variations in prices in the data collected from these newspapers (Figure 5), a dramatic fall in the price of bacon pigs (or bacon for Dublin) can be seen coinciding exactly with the period between the budget of 11 March 1842 when proposals were announced and in October 1842 when import restrictions were lifted. It is clear that the range within which seasonal prices fluctuated fell dramatically: from 28–39 s/cwt in the year before 1842 in Cork to 18–26 s/cwt in the year after the changes. The corresponding change for Dublin bacon was from 40–61 to 28–46 and for Waterford bacon pigs from 39–51 to 25–41. These figures suggest that the tariff probably contributed to reducing bacon pig prices by about a third between 1841 and 1843 – by 30 per cent in Waterford, 38 per cent in Dublin, and by 44 per cent in Cork for the year before and after the changes.
Price of bacon pigs in the Cork and Waterford markets and of bacon in Dublin markets (s/cwt)
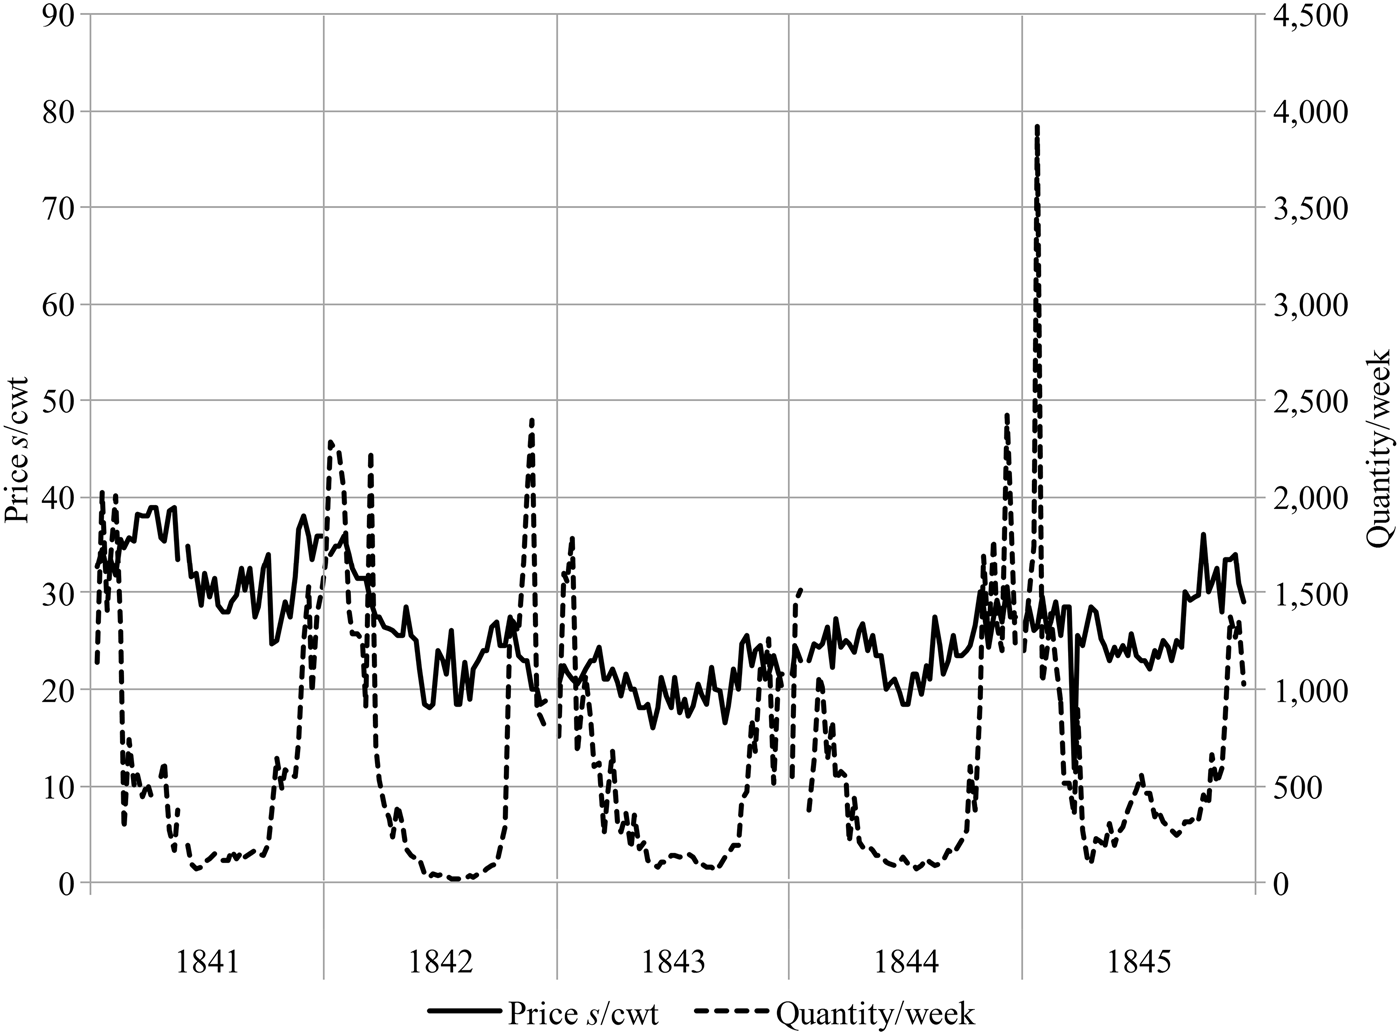
Pigs were essential to the poorest households in the economy by generating income. As Austin Bourke has noted from Poor Law records, bacon pigs tended to be the family pig kept by ‘the small man’, or poor labourers, and sold to obtain cash to pay the rent.Footnote 56 To quote S. C. Hall's contemporary description of the situation, poor Irish farmers regarded their pigs with respect as ‘the gentleman who pays the rent’.Footnote 57Figure 8, which shows the price and quantity of pigs sold in Cork, shows that the quantity sold did not increase greatly in 1842 and fell in 1843. This suggests the price fall associated with the tariff changes of 1842 is an initiating factor, and not due to availability fluctuations. Neither is this fall in the price of pigs linked to the cost of feeding their pigs potatoes, as Bourke notes that these types of pigs were only fed on the potato ‘peelings and waste of those used by the family’ and that ‘it would not be worth keeping pigs if one had to buy the food for them’.Footnote 58
Overall, the sales would have produced less money for farmers because the quantity sold had not increased to compensate for the fall in price, contributing to falling household incomes. In confirmation of this, Lord Eliot, the chief secretary, noted in a letter to Sir James Graham, home secretary, after a tour of Ireland, that labourers were seeking more employment to ‘compensate them for the loss they have sustained in the diminished value of their pigs’.Footnote 59
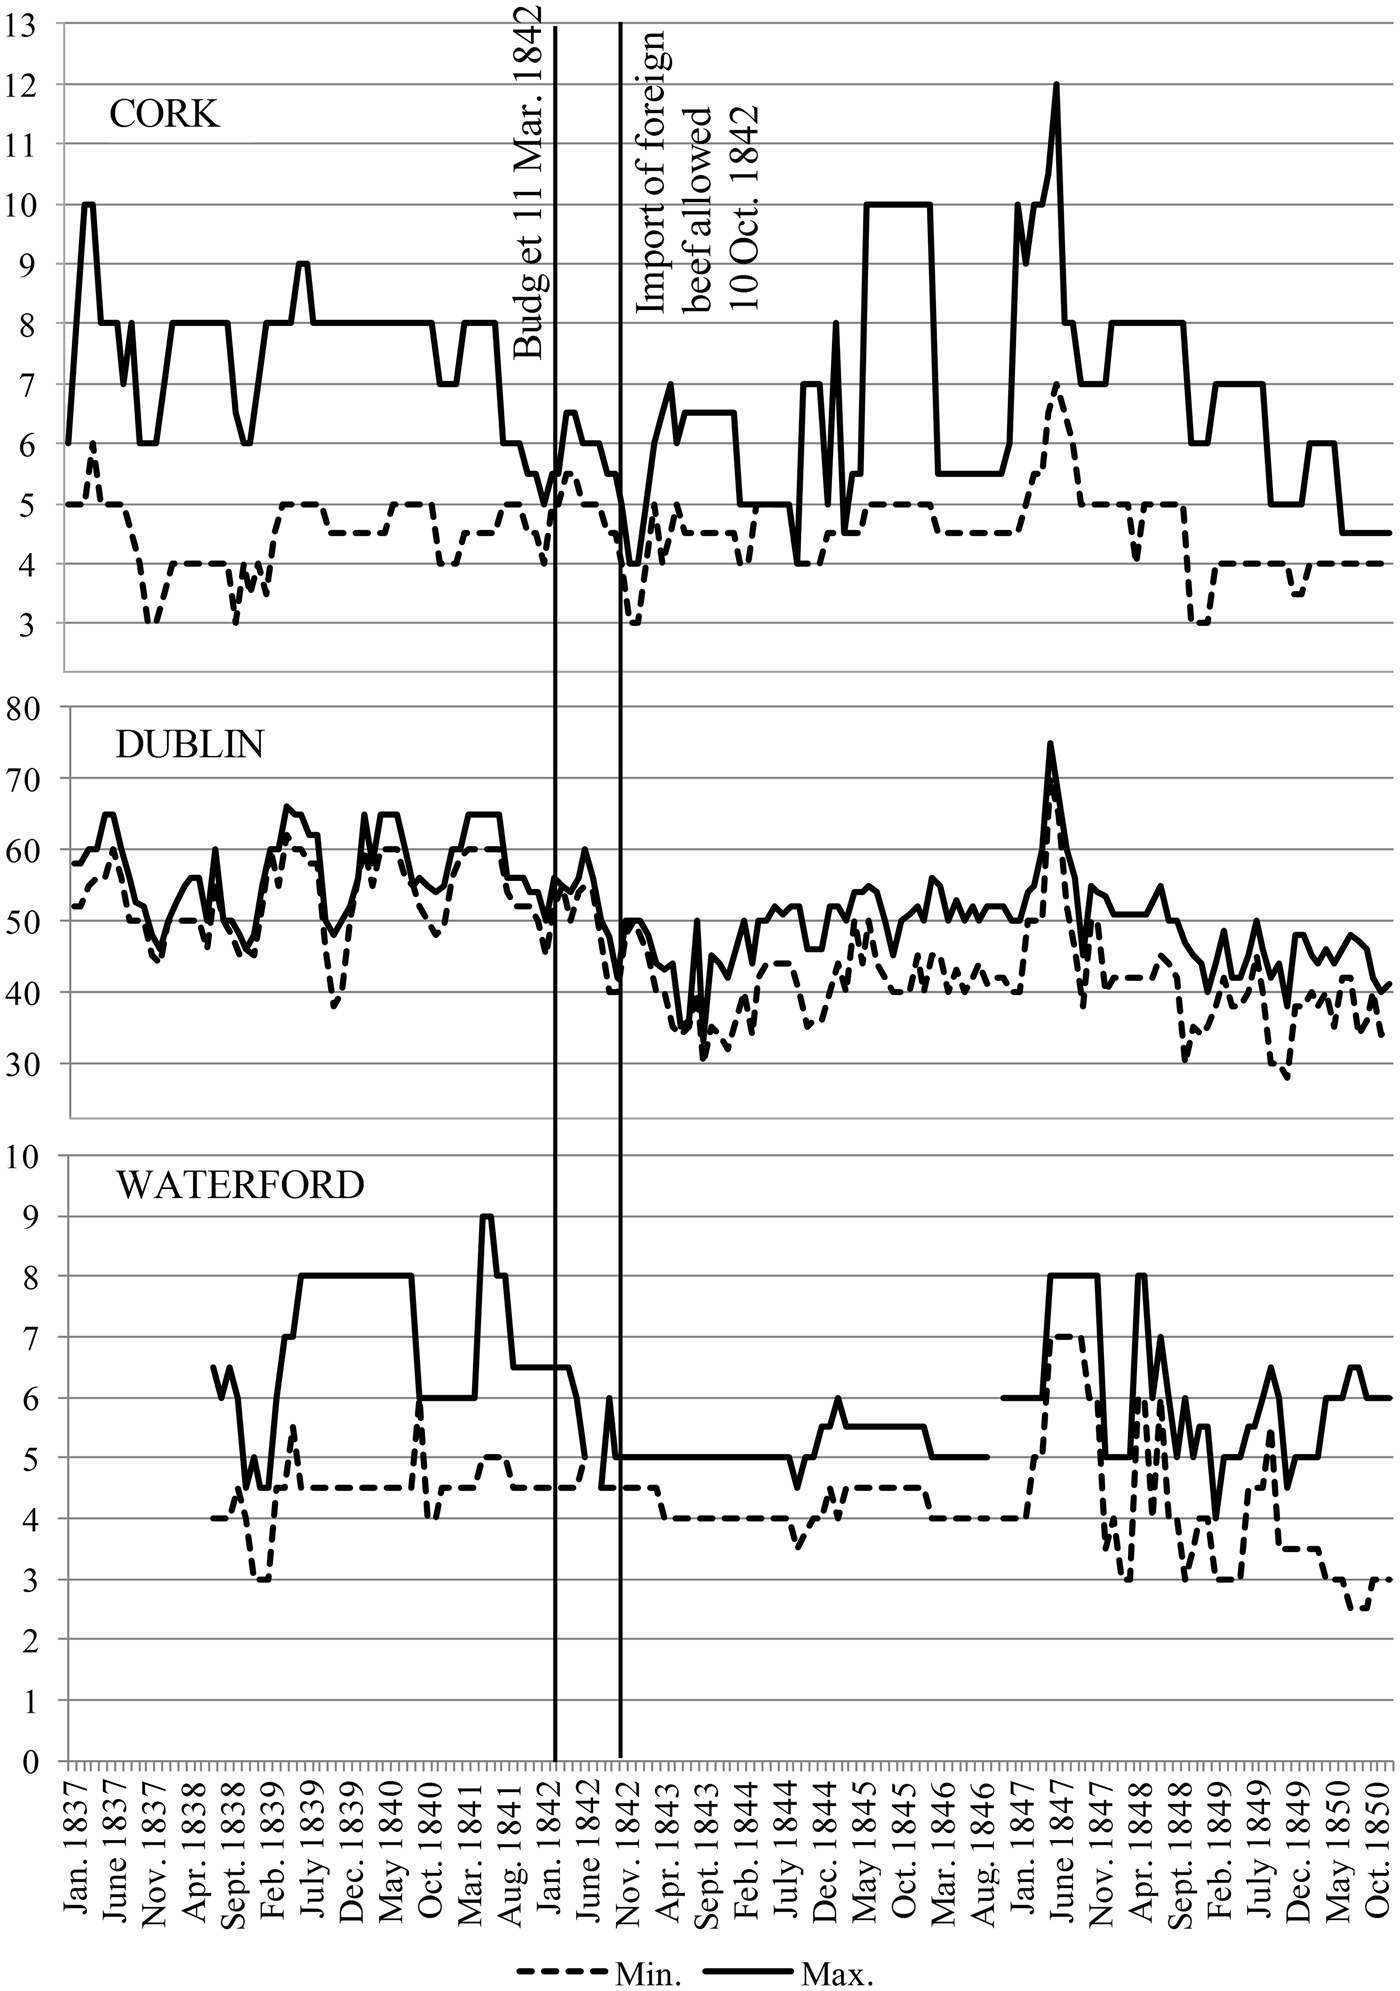
Falling beef prices would have also contributed to this fall in real incomes. In Figure 6, although beef prices display a less rapid decline, the general downward trend is still clear. The change occurred about the time of an outbreak of cattle distemper, in which beef prices should have risen, but instead they fell as the effect of the tariff reductions outweighed this supply shock. As the Freeman's Journal noted:
from the epidemic which…has been very destructive among cattle and milch cows … we were led to expect high prices, as the quantity of fresh meat used at present in Ireland is large, arising from the consumption of the great military force. As it is, beef is about 35 s per cwt. over the last year [1843], but would have been 50 s to 60 s were it not for the operation of the tariff’.Footnote 60
That there was a fall in price in 1842, rather than an increase, during a supply shock in domestic production is therefore significant. It is most obvious for prices in Dublin which are wholesale and fell from a range of 50–4 s/cwt in April 1842 to a low of 34–5 s/cwt in June 1843. A similar downward trend can be seen in the Waterford markets, although in Cork it is momentary and rises again almost immediately. There is a smaller price movement in Cork and Waterford low grade beef which can be linked to the increased numbers of soldiers which were brought into the area to boost security during the Repeal Year agitation and had to be supplied with meat. The demand for beef for the military was so great that the government reopened a depot in Haulbowline in Cork harbour to import beef from Deptford, near London.Footnote 61 But this boost in military demand did not feel its way much inland. For example, only 37 kilometres away in Fermoy, a meeting was held to protest at the falling price of beef and pork.Footnote 62 Rural locations sampled such as Nenagh and Ennis also show price movement patterns similar to Dublin.Footnote 63
Price of beef in the Cork (d/lb), Dublin (s/cwt), and Waterford (d/lb) markets against time.
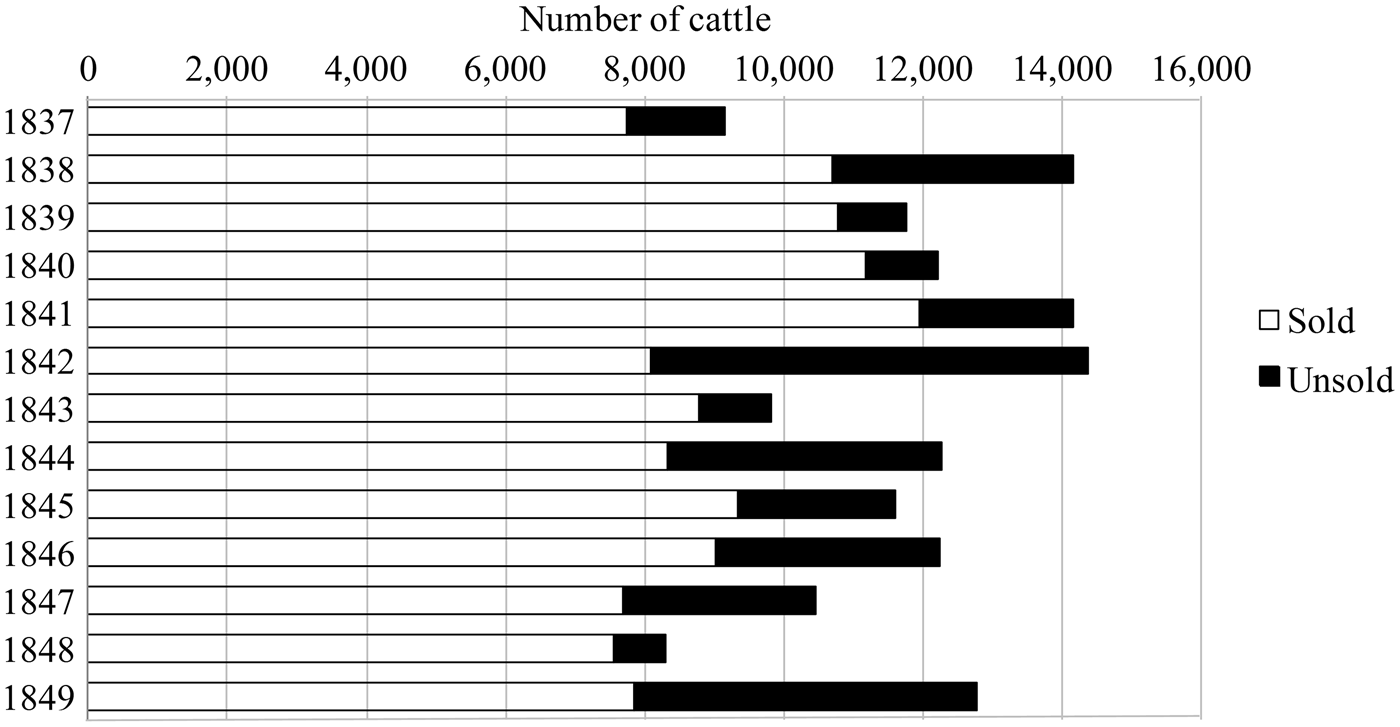
Alongside the downwards price movement for beef, the quantities sold fell dramatically as farmers became unwilling to sell at reduced prices, producing an overall negative effect on real incomes. As several newspapers noted in October 1842, including the Freeman's Journal and the Tuam Herald, the impact of the tariff reforms meant that beef and cattle prices fell ‘so low that very few sales were made’.Footnote 64 The quantitative effect of this can be seen in the Ballinasloe Fair records of cattle sold (Figure 7).Footnote 65 Whereas less than 10 per cent of cattle remained unsold in 1840, over 40 per cent were unsold in 1842. The pattern was similar at other fairs. In the Freeman's Journal of 11 November 1842, the Drogheda Fair reported: ‘every description of cattle experienced a great reduction of prices compared with last year … very few changed hands there being little or no buyers’.
Cattle presented at the Ballinasloe Fair, by number sold and unsold.
It is unlikely that the general drop in prices at the time of the 1842 budget might have been due to a sudden increase in the quantity available that year. Quantity information on pigs is available for the Cork markets and is shown in Figure 8. It is clear from this chart and similar results for all products sold in the Cork markets that 1842 is not a year in which the quantities available rose suddenly, for instance after a good harvest. This is supported by observations made in the market reports of the Freeman's Journal, which suggest that the harvest of 1842 was of a similar size to that in 1840 and 1841.Footnote 66 Lower food prices which are clearly seen in food price data were therefore the actual as well as Peel's intended effect of the 1842 budget changes.
Price and quantity sold/week of pigs in the Cork markets against time.
However, the negative impact on the economic welfare of the poor was not only unintended but went unrecognized outside Ireland because of the recovery which followed in 1843, because it contradicted contemporary free trade theory, and because the transmission mechanism was mainly the psychological impact of the tariff changes on market expectations and prices. As Colin Matthew has noted, although ‘nineteenth-century budgets could not affect aggregate demand on any significant scale’, businessmen still paid ‘the closest and most anxious attention’ to them and particularly their impact on ‘the state of psychological expectation’ in the economy.Footnote 67 As the chairman of the National Bank of Ireland noted in his annual statement: ‘the effect of the tariff has been to strike down the price of every article in which Ireland dealt’ and the effect of ‘the anticipation of those great changes preceded their actual announcement’.Footnote 68 In an 1842 market report in the Cork Advertiser, it was noted that the tariff reductions on pigs ‘were expected and the very expectation produced the effect’; in other words, the negative impact on business confidence produced the price change in anticipation of the change in market fundamentals.Footnote 69 The beef market, in particular, was damaged by an expectation of lower prices rather than the number of actual imports of foreign cattle which were low in 1842, a fact noted in contemporary newspapers and official government records.Footnote 70
This became a real economic downturn, however. There are numerous references to one, in terms of rising rent arrears, falling real wages, falling land values, and rising interest rates, to be found in sources from estate records, through local newspapers, to government statistics. Elizabeth Smith recorded in her diaries that her tenants were unable to pay rent in 1843 because of falling food prices and incomes, whereas they had been able to do so up until late 1842.Footnote 71 Other landlords’ experiences were similar and sometimes worse. The Tuam Herald in September 1842 had noted that some landlords in County Wicklow had ‘not yet received 5 s in the pound of the March rent’.Footnote 72 Estate records from County Kildare include a letter from W. Bookey dated 27 April 1842, which said that he had been ‘very badly paid the rents owing to the panick caused by Sir R. Peel's Tariff’.Footnote 73 From the same estate another letter from Richard Doyle in January 1843 claimed that ‘was it not for the deplorable change that has taken place in the price of cattle, corn &c., I would now be able to pay the May rents’. Footnote 74
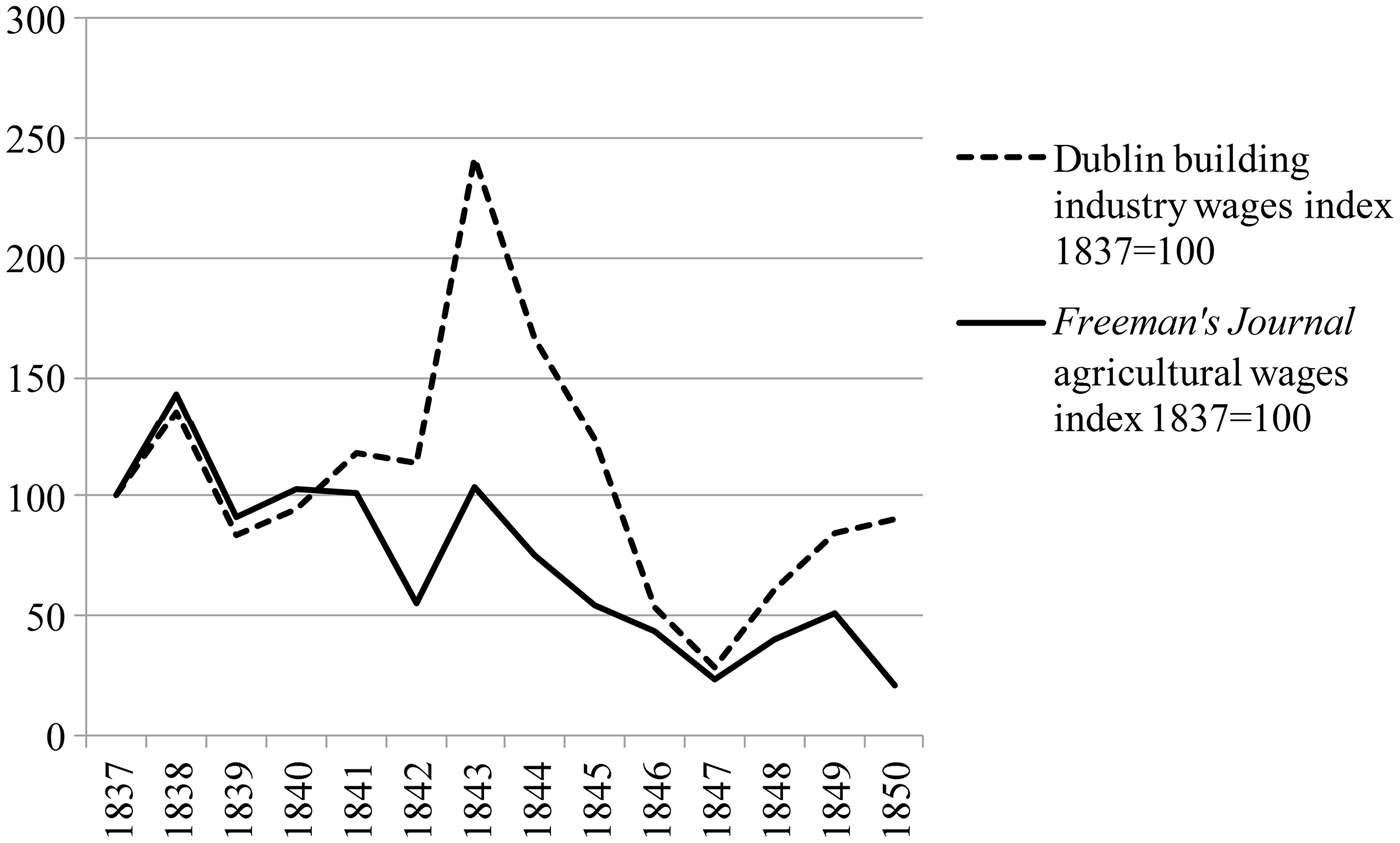
Another feature of the downturn was rising unemployment and falling real wages. Most notably, in an open letter to Peel, the archbishop of Tuam reported that ‘during the last week … I was besieged by men looking for work at any wages’ due to ‘the change of the tariff’ and ‘the doubts and fears and panic to which it gave rise’.Footnote 75 There is little reliable data available on real wages, but the Freeman's Journal does contain some statistics indicating day wage levels in the agricultural sector. When this is compared with day building sector wages, for which there is more reliable data, it is noticeable that there is a decrease in real wages in both sectors between 1841 and 1842, with a fall in the agricultural sector of nearly 50 per cent in a year (see Figure 9). The persistence of the 1842 shock caused by the tariff reduction is shown by the subsequent recovery in real wages levels in the building sector being considerably more rapid than that of the agricultural sector.
Purchasing power of real wages against a potato price index for the Dublin building industry (Geary and Stark) and the Freeman's Journal agricultural wages, both indexed to 1837 = 100
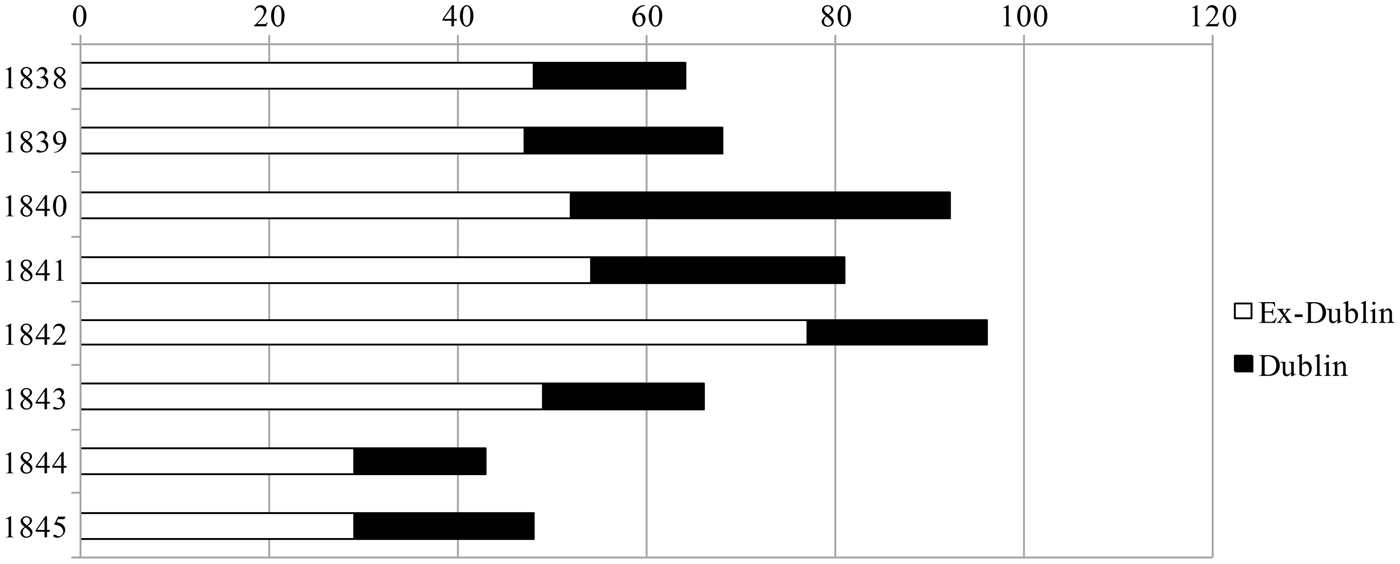
The falling price of agricultural produce was felt all the way through the economic system to reduced land values. When the Navan Poor Law Union decided to make an ‘Alteration in the Valuation’ of agricultural land, the decision was attributed by many to the ‘reduction in agricultural produce arising from legislative enactments with regard to the tariff on cattle and corn’.Footnote 76 The falling price of land increased business risk and the Freeman's Journal reported rising interest rates through the summer of 1842, which made the slump in agriculture and commerce worse.Footnote 77 ‘The scarcity of money, and the depression of business of every kind was never more felt. We believe that provisions would be higher before now but for the apprehension that the new tariff would cause a considerable fall in prices’.Footnote 78 The impact of economic slumps in modern economies is often judged by the rising levels of bankruptcies and this is a trend that can clearly be seen in 1842 in the agricultural sector. The Freeman's Journal noted that ‘applications to the Insolvent Debtor's Court in the NW district’ had ‘quadrupled’ because of impoverished farmers and official statistics show that bankruptcies per year increased by over 50 per cent outside commercial Dublin, on an annual basis between 1841 and 1842 (Figure 10).Footnote 79
Number of bankruptcies in Ireland 1838–45, split into Dublin and ex-Dublin categories
Government records from Dublin Castle suggest that the economic downturn was accompanied by unrest and violence which was specifically related to economic issues. In his diary entry of 24 May 1842, De Grey notes that in Tipperary ‘the system of intimidation is fearful … fortunately neither religion [n]or politics is yet mixed up in it’.Footnote 80 Dublin Castle certainly thought that civil unrest and the Repeal agitation were more driven by economic factors than religious or political ones.
IV
The loosening of import restrictions in the 1842 budget caused Irish agricultural prices to fall and led to a severe economic downturn. Consequently, a link to the rise in the popularity of the Repeal movement between 1842 and 1843 is possible given its very sudden increase during this period. In addition to the qualitative evidence presented indicating that O'Connell and the Repeal movement used the opportunity presented by this downturn to gain popular support for his movement, there appears to be a quantitative link between economic indicators and the rising popularity of Repeal.
A comparison of economic and political indicators shows the link between the 1842 downturn and the rise in support for the Repeal movement in 1842–3. As a proxy for economic conditions, agricultural prices have again been used, as these have a link to real incomes in Ireland during this period. Repeal's strongest supporters came from agricultural areas outside Ulster, indicating that agricultural prices may be a good proxy for the incomes of the movement's eventual supporters. As a political proxy for the popularity of Repeal, the amount of Repeal rent donations collected between January 1842 and April 1844 has been extracted from The Nation newspaper. This indicates the level of financial support Irish people were willing to give to the movement, particularly as a majority of the Repeal rent was contributed in small amounts by the peasantry, rather than in large donations from the wealthy. This dataset extends to a continuous set of data, unlike the isolated examples of Repeal rent data previously used by historians including McCaffrey and Nowlan.Footnote 81
Although ‘Monster’ meeting attendance is another indicator that could be used to represent political support, these figures are less robust due to disagreements between contemporary observers on the numbers attending the meetings.Those numbers are also affected by geography and weather, which are factors unrelated to the level of political support for the Repeal movement.
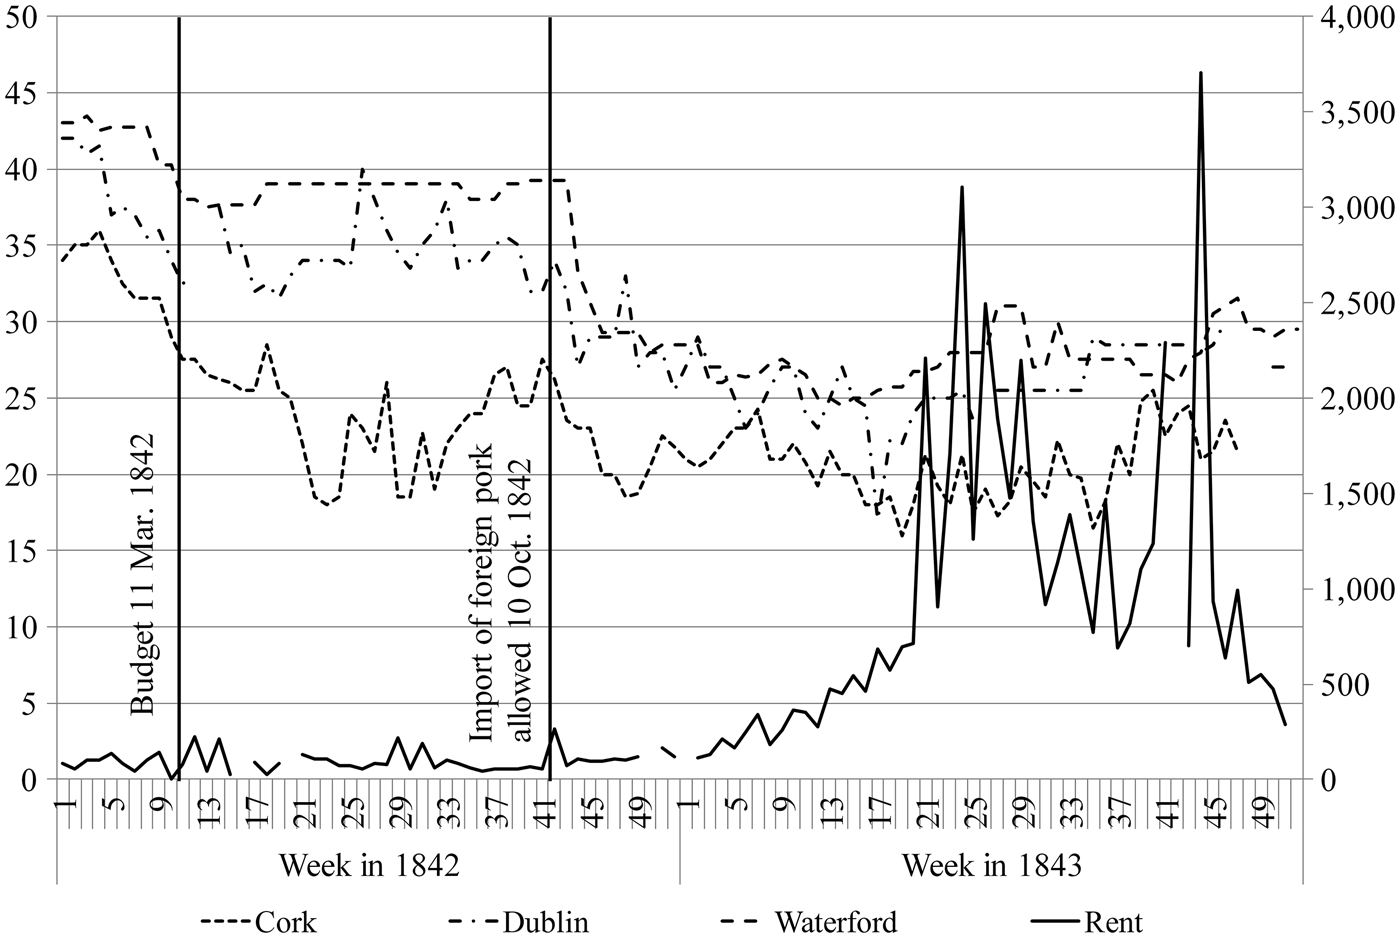
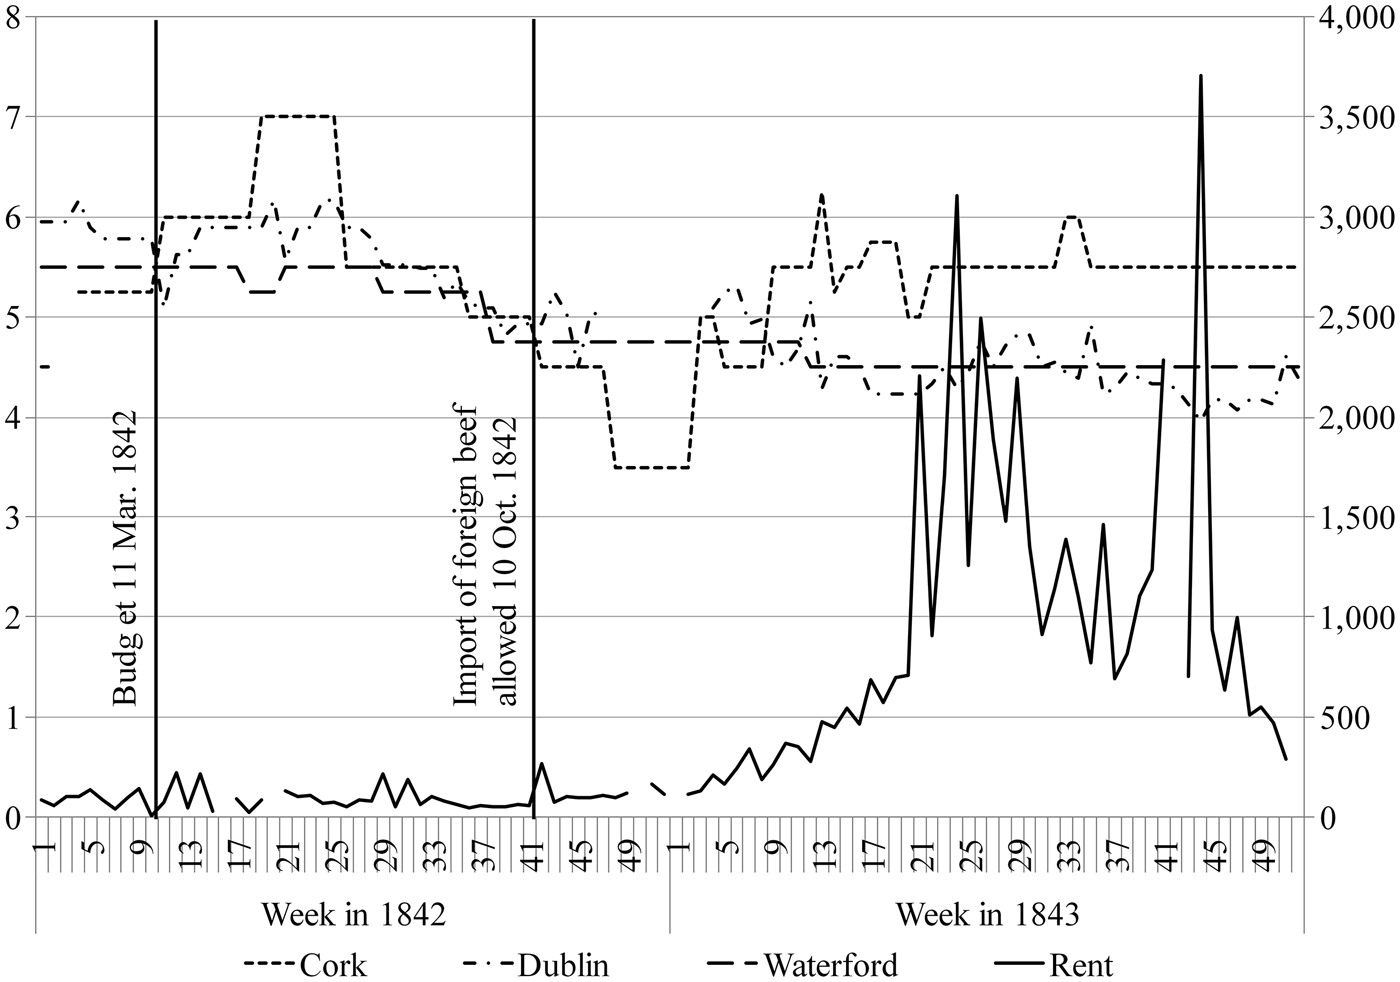
Figure 11 compares Repeal rent, as the political proxy, with bacon pig prices in Cork, Dublin, and Waterford, main export ports for Ireland. Figure 12 does the same for beef prices. Bacon pigs and beef were chosen because they are the food items most obviously influenced by the 1842 tariff reforms, without too much ‘noise’ in the data caused by other factors.Footnote 82 Visually, it can be seen that there is a gentle fall in bacon pig and beef prices after the budget was announced on 11 March 1842, with a more severe fall in prices after 10 October 1842, which is reflected by a gradual increase in Repeal rent contribution after this same month, with large spikes in donations coinciding with the summer months of high economic distress as savings from the last harvest proved inadequate to reach the next.
A comparison of the amount of Repeal rent (£, right-hand scale) and prices of Cork, Dublin, and Waterford bacon pigs (s/cwt, left-hand scale) between January 1842 and December 1843; weeks are numbered 1–52 during each year.
A comparison of the amount of Repeal rent (£, right-hand scale) and prices of Cork, Dublin, and Waterford beef (d/lb, left-hand scale) between January 1842 and December 1843. Weeks are numbered 1–52 during each year.
It has been shown from qualitative evidence that the Repeal movement tried to take advantage of the distress caused by the economic downturn in food export prices to boost their popularity by supporting protectionist policies, but it is, as yet, unclear whether this relationship between the rent and food variables in Figures 11 and 12 is statistically significant or not. This can be checked by analysing the relationship between bacon pig and beef prices and the Repeal rent data using a time-series linear regression, utilizing the ordinary least squares model.
The resulting p-values suggest a statistically significant correlation between bacon pig and beef prices for 1842–3, and increased donations towards the Repeal rent fund. A very strong correlation, where p<0·01, and there is a more than 99 per cent confidence level, can be found for bacon pigs in all three ports and for beef in Dublin and Waterford, when set individually against the Repeal rent dataset. The exception is beef in Cork which does not correlate, probably because military consumption temporarily propped up prices in mid-1843. The R-squared values for the correlations, which are a measure of the variation of the data from the line of correlation, are within a reasonable range in view of the different types and sources of data under analysis. Although the result of this test should be approached with caution due to the age and nature of the data, the results suggest that there is a statistically significant negative correlation, visible in Figures 11 and 12, between bacon pig and beef prices, representing agricultural incomes, and the rise in Repeal rent contributions, representing the political support for Repeal expressed in fiscal terms.
It is therefore possible to conclude that there is a relationship between the rise in the popularity of the Repeal movement and falling prices of the main export meats as a result of the 1842 budget. The mechanism behind this correlation was that economic and trade issues were at the heart of the Repeal campaign during this period, and that O'Connell, nominally a free trade Benthamite, was willing to take advantage of the tariff-induced 1842–3 slump in order to boost popular support for his movement.Footnote 83 The fact that support for the Repeal movement collapsed in October 1843, the same period that Ireland experienced an unexpectedly good harvest and a recovery in international food prices driven by an upwards swing in the British business cycle, is further testament to the strong relationship between economic factors and the sudden rise, and subsequent fall, in support for the Repeal agitation. Even de Grey and Eliot in Dublin Castle noted, at the time, that the good harvest of October 1843 contributed towards the collapse in support for the Repeal movement and less civil unrest, in spite of the decision to take legal action against the Repeal movement in that same month.Footnote 84
This article has indicated that Irish tranquillity and economic stability were in fact more reliant on protection in the 1840s than historians have hitherto recognized. In the light of the economic causes of the Rebecca Riots in 1840s Wales, described by Williams, and the link between the 1848 Revolutions in Europe and ‘immediate economic misery’ that Helge Berger and Mark Spoerer have studied, it is unsurprising to find a link between support for the Repeal movement and immediate economic problems.Footnote 85 The difference is that these were contributed to by Peel's 1842 budget, showing O'Connell's criticism of the use of free trade in respect of Ireland at that time was reasonable. It is therefore justifiable to extend the conventional political and religious interpretations of the Repeal movement already provided by Nowlan, McCaffrey, and Kerr to include the conclusion that its surge in popularity in the 1842–3 period was also, in part, a reaction to Peel's economic policy changes in 1842.