



%20--%3e%3c!DOCTYPE%20svg%20PUBLIC%20'-//W3C//DTD%20SVG%201.0//EN'%20'http://www.w3.org/TR/2001/REC-SVG-20010904/DTD/svg10.dtd'%3e%3csvg%20version='1.0'%20id='Layer_1'%20xmlns='http://www.w3.org/2000/svg'%20xmlns:xlink='http://www.w3.org/1999/xlink'%20x='0px'%20y='0px'%20width='64px'%20height='64px'%20viewBox='5.5%20-3.5%2064%2064'%20enable-background='new%205.5%20-3.5%2064%2064'%20xml:space='preserve'%3e%3cg%3e%3ccircle%20fill='%23FFFFFF'%20fill-opacity='0'%20cx='37.785'%20cy='28.501'%20r='28.836'/%3e%3cpath%20fill='%23595959'%20d='M37.441-3.5c8.951,0,16.572,3.125,22.857,9.372c3.008,3.009,5.295,6.448,6.857,10.314%20c1.561,3.867,2.344,7.971,2.344,12.314c0,4.381-0.773,8.486-2.314,12.313c-1.543,3.828-3.82,7.21-6.828,10.143%20c-3.123,3.085-6.666,5.448-10.629,7.086c-3.961,1.638-8.057,2.457-12.285,2.457s-8.276-0.808-12.143-2.429%20c-3.866-1.618-7.333-3.961-10.4-7.027c-3.067-3.066-5.4-6.524-7-10.372S5.5,32.767,5.5,28.5c0-4.229,0.809-8.295,2.428-12.2%20c1.619-3.905,3.972-7.4,7.057-10.486C21.08-0.394,28.565-3.5,37.441-3.5z%20M37.557,2.272c-7.314,0-13.467,2.553-18.458,7.657%20c-2.515,2.553-4.448,5.419-5.8,8.6c-1.354,3.181-2.029,6.505-2.029,9.972c0,3.429,0.675,6.734,2.029,9.913%20c1.353,3.183,3.285,6.021,5.8,8.516c2.514,2.496,5.351,4.399,8.515,5.715c3.161,1.314,6.476,1.971,9.943,1.971%20c3.428,0,6.75-0.665,9.973-1.999c3.219-1.335,6.121-3.257,8.713-5.771c4.99-4.876,7.484-10.99,7.484-18.344%20c0-3.543-0.648-6.895-1.943-10.057c-1.293-3.162-3.18-5.98-5.654-8.458C50.984,4.844,44.795,2.272,37.557,2.272z%20M37.156,23.187%20l-4.287,2.229c-0.458-0.951-1.019-1.619-1.685-2c-0.667-0.38-1.286-0.571-1.858-0.571c-2.856,0-4.286,1.885-4.286,5.657%20c0,1.714,0.362,3.084,1.085,4.113c0.724,1.029,1.791,1.544,3.201,1.544c1.867,0,3.181-0.915,3.944-2.743l3.942,2%20c-0.838,1.563-2,2.791-3.486,3.686c-1.484,0.896-3.123,1.343-4.914,1.343c-2.857,0-5.163-0.875-6.915-2.629%20c-1.752-1.752-2.628-4.19-2.628-7.313c0-3.048,0.886-5.466,2.657-7.257c1.771-1.79,4.009-2.686,6.715-2.686%20C32.604,18.558,35.441,20.101,37.156,23.187z%20M55.613,23.187l-4.229,2.229c-0.457-0.951-1.02-1.619-1.686-2%20c-0.668-0.38-1.307-0.571-1.914-0.571c-2.857,0-4.287,1.885-4.287,5.657c0,1.714,0.363,3.084,1.086,4.113%20c0.723,1.029,1.789,1.544,3.201,1.544c1.865,0,3.18-0.915,3.941-2.743l4,2c-0.875,1.563-2.057,2.791-3.541,3.686%20c-1.486,0.896-3.105,1.343-4.857,1.343c-2.896,0-5.209-0.875-6.941-2.629c-1.736-1.752-2.602-4.19-2.602-7.313%20c0-3.048,0.885-5.466,2.658-7.257c1.77-1.79,4.008-2.686,6.713-2.686C51.117,18.558,53.938,20.101,55.613,23.187z'/%3e%3c/g%3e%3c/svg%3e)
%20--%3e%3c!DOCTYPE%20svg%20PUBLIC%20'-//W3C//DTD%20SVG%201.0//EN'%20'http://www.w3.org/TR/2001/REC-SVG-20010904/DTD/svg10.dtd'%3e%3csvg%20version='1.0'%20id='Layer_1'%20xmlns='http://www.w3.org/2000/svg'%20xmlns:xlink='http://www.w3.org/1999/xlink'%20x='0px'%20y='0px'%20width='64px'%20height='64px'%20viewBox='5.5%20-3.5%2064%2064'%20enable-background='new%205.5%20-3.5%2064%2064'%20xml:space='preserve'%3e%3cg%3e%3ccircle%20fill='%23FFFFFF'%20fill-opacity='0'%20cx='37.637'%20cy='28.806'%20r='28.276'/%3e%3cg%3e%3cpath%20fill='%23595959'%20d='M37.443-3.5c8.988,0,16.57,3.085,22.742,9.257C66.393,11.967,69.5,19.548,69.5,28.5c0,8.991-3.049,16.476-9.145,22.456%20C53.879,57.319,46.242,60.5,37.443,60.5c-8.649,0-16.153-3.144-22.514-9.43C8.644,44.784,5.5,37.262,5.5,28.5%20c0-8.761,3.144-16.342,9.429-22.742C21.101-0.415,28.604-3.5,37.443-3.5z%20M37.557,2.272c-7.276,0-13.428,2.553-18.457,7.657%20c-5.22,5.334-7.829,11.525-7.829,18.572c0,7.086,2.59,13.22,7.77,18.398c5.181,5.182,11.352,7.771,18.514,7.771%20c7.123,0,13.334-2.607,18.629-7.828c5.029-4.838,7.543-10.952,7.543-18.343c0-7.276-2.553-13.465-7.656-18.571%20C50.967,4.824,44.795,2.272,37.557,2.272z%20M46.129,20.557v13.085h-3.656v15.542h-9.944V33.643h-3.656V20.557%20c0-0.572,0.2-1.057,0.599-1.457c0.401-0.399,0.887-0.6,1.457-0.6h13.144c0.533,0,1.01,0.2,1.428,0.6%20C45.918,19.5,46.129,19.986,46.129,20.557z%20M33.042,12.329c0-3.008,1.485-4.514,4.458-4.514s4.457,1.504,4.457,4.514%20c0,2.971-1.486,4.457-4.457,4.457S33.042,15.3,33.042,12.329z'/%3e%3c/g%3e%3c/g%3e%3c/svg%3e)
1. Introduction
Turbulence and multiphase flows are two of the most challenging topics in fluid mechanics and when combined they pose a formidable challenge, even in the dilute dispersed regime (Balachandar & Eaton Reference Balachandar and Eaton2010). The focus here is on liquid flows laden with disperse bubbles, which can be particularly challenging since the bubbles can strongly alter the liquid phase turbulence (Mudde Reference Mudde2005; Lohse Reference Lohse2018; Elghobashi Reference Elghobashi2019). In particular, the bubbles can modify the turbulence due to production effects arising from the bubble wakes (Riboux, Risso & Legendre Reference Riboux, Risso and Legendre2010; Lai & Socolofsky Reference Lai and Socolofsky2019), enhanced local turbulent kinetic energy dissipation rates in the vicinity of the bubble surfaces (Santarelli, Roussel & Fröhlich Reference Santarelli, Roussel and Fröhlich2016; Masuk, Salibindla & Ni Reference Masuk, Salibindla and Ni2021) and modulation of the liquid mean velocity profile due to interphase momentum transfer, resulting in an alteration of shear-induced turbulence (Lu & Tryggvason Reference Lu and Tryggvason2013; du Cluzeau, Bois & Toutant Reference du Cluzeau, Bois and Toutant2019; Cifani, Kuerten & Geurts Reference Cifani, Kuerten and Geurts2020; Bragg et al. Reference Bragg, Liao, Fröhlich and Ma2021). Mathai, Lohse & Sun (Reference Mathai, Lohse and Sun2020) highlighted particular ways in which the classical scenario for single-phase turbulence, based on single-point statistical analysis, is modified due to the bubbles moving relative to the fluid. Turbulence arising from this relative motion is often referred to as bubble-induced turbulence (BIT) and its effects can be captured in the Reynolds-averaged Navier–Stokes modelling framework through the inclusion of additional source terms in the relevant transport equations (Fox Reference Fox2014; Joshi & Nandakumar Reference Joshi and Nandakumar2015; Ma Reference Ma2017; Liao et al. Reference Liao, Ma, Krepper, Lucas and Fröhlich2019; Ma, Lucas & Bragg Reference Ma, Lucas and Bragg2020a).
While significant progress has been made in understanding and characterizing how the bubbles influence the single-point turbulence statistics of the liquid phase, less attention has been paid to the influence of the bubbles on the multiscale/multipoint flow statistics. Those that have considered this aspect have only focused on the kinetic energy spectrum of the liquid velocity fluctuations, with a key observation being that in BIT dominated flows, a power-law behaviour for the energy spectrum arises with exponent  $-3$ in both the wavenumber and frequency domain (Lance & Bataille Reference Lance and Bataille1991; Roghair et al. Reference Roghair, Mercado, Van Sint Annaland, Kuipers, Sun and Lohse2011; Mendez-Diaz et al. Reference Mendez-Diaz, Serrano-García, Zenit and Hernández-Cordero2013; Ma et al. Reference Ma, Santarelli, Ziegenhein, Lucas and Fröhlich2017). This behaviour was also reported in Pandey, Ramadugu & Perlekar (Reference Pandey, Ramadugu and Perlekar2020), who investigated the energy budget equations in wavenumber space and explained the
 $-3$ slope as arising due to a balance between kinetic energy production due to the bubbles and viscous dissipation. In their analysis they evaluated the nonlinear scale-to-scale energy flux term for bubbly flows, showing a forward (downscale) energy cascade, just as also occurs for single-phase turbulence in three dimensions. An issue with their analysis, however, is that they included the values of the flow at grid points occupied by the bubbles when evaluating the statistics of the carrier phase, thereby contaminating the fluid statistics. A similar finding concerning an average forward energy cascade was reported by Lai et al. (Reference Lai, Fraga, Chan and Dodd2018), who performed direct numerical simulation (DNS) of bubbles rising vertically in a channel flow filled with initially quiescent water. They also showed that the energy cascade is highly anisotropic, and that there is a strong inverse energy cascade for eddies orientated vertically in the flow.
There have been very few studies exploring the multiscale properties of bubble-laden turbulent flows in physical space, e.g. using structure function analysis. Rensen, Luther & Lohse (Reference Rensen, Luther and Lohse2005) performed hot-film anemometry measurements in the Twente water tunnel and computed the longitudinal second- and fourth-order structure functions with the aid of Taylor's hypothesis. They found an increase of the second-order structure function for the two-phase case compared with the single-phase case under the same bulk Reynolds number, and that this increase was more pronounced at the small scales than the large scales. Their fourth-order structure function results revealed an increase of the intermittency at the small scales of the flow when the flow contained bubbles, even for a relatively low gas void fraction ( $0.5\,\%$). Similar behaviour was also observed in Biferale et al. (Reference Biferale, Perlekar, Sbragaglia and Toschi2012) when comparing the small-scale properties of boiling and non-boiling convective turbulent flows.
An important aspect yet to be quantified is how the bubbles affect the anisotropy of the flow at different scales. For single-phase turbulence, the energy containing scales in many flows such as those with shear, rotation and buoyancy are anisotropic (Biferale & Procaccia Reference Biferale and Procaccia2005). Phenomenological theories of turbulence predict a return to isotropy at small enough scales (Kolmogorov Reference Kolmogorov1941b; Frisch Reference Frisch1995; Sreenivasan & Antonia Reference Sreenivasan and Antonia1997). However, measurements have revealed persistent small-scale anisotropy (Pumir & Shraiman Reference Pumir and Shraiman1995; Shen & Warhaft Reference Shen and Warhaft2000; Ouellette et al. Reference Ouellette, Xu, Bourgoin and Bodenschatz2006; Carter & Coletti Reference Carter and Coletti2017). In contrast to single-phase flow, where energy is often injected into the flow at large scales, bubbles can inject energy into the flow at the scale of their size, which usually corresponds to the small scales of the turbulence. Since the bubbles have a preferential direction of motion due to buoyancy, this could lead to the injection of strong anisotropy into the flow at the small scales, leading to strong departures from the behaviour of the single-phase case. The study of Pandey et al. (Reference Pandey, Ramadugu and Perlekar2020) was based on Fourier space analysis with averaging over spherical shells in wavevector space, and so did not permit them to explore the anisotropy of the flow at different scales.
Another important point is that, in Pandey et al. (Reference Pandey, Ramadugu and Perlekar2020), the flow had no background turbulence (i.e. all the turbulence was generated by the bubbles), and hence it was not possible to consider how the bubbles modify the turbulence compared with the single-phase case. In order to more fully understand how the bubbles modify the properties of the turbulence, it is desirable to consider a configuration in which the unladen flow is already turbulent, and then one can explore how the bubbles modify the properties of the turbulence when they are introduced.
In the present work we seek to advance the understanding of the properties of bubble-laden turbulent flows across its range of scales. To do this, data from DNS of finite-size bubbles in a turbulent channel flow with a prescribed bulk Reynolds number are utilized, for different bubble sizes and for mono- and bidisperse cases. A new method is developed based on the barycentric map (Banerjee et al. Reference Banerjee, Krahl, Durst and Zenger2007), and applied to the DNS data to quantify the anisotropy of the bubble-laden turbulence flow across the range of its scales. By computing the structure functions of various orders, the direction-dependent liquid velocity fluctuations are also explored at different scales, as is the scale-to-scale energy transfer and intermittency. These results provide new insights into the properties of bubble-laden turbulent flows, and how they differ from the single-phase counterpart at different scales in the flow.
2. Direct numerical simulations
2.1. Database
The DNS data we use are from the studies of Santarelli & Fröhlich (Reference Santarelli and Fröhlich2015, Reference Santarelli and Fröhlich2016) who simulated the motion of many thousands of bubbles at low Eötvös number in a vertical turbulent channel flow. The bubbles are handled using an immersed boundary method, and are modelled as rigid spherical objects with a no-slip condition enforced at their surface, representing the behaviour of air bubbles rising in contaminated water. Compared with other simulations of this type (see the related references in Mathai et al. Reference Mathai, Lohse and Sun2020), these simulations are substantially closer to applications in that they involve a turbulent background flow, contaminated fluid, realistic density ratio  $\rho^G/\rho^L$ (where
 $\rho^G$ and
 $\rho^L$ are the gas and liquid densities, respectively), higher bubble Reynolds number, a much larger domain and a much larger number of bubbles.
As shown in figure 1, the vertical flow takes place between two flat walls separated by the distance  $H$, and the size of the computational domain is
 $L_x\times L_y\times L_z=4.41H\times H\times 2.21H$. Here,
 $x$ denotes the streamwise coordinate,
 $y$ the wall-normal coordinate and
 $z$ the spanwise coordinate, and the corresponding unit basis vectors are
 $\boldsymbol {e}_x,\boldsymbol {e}_y,\boldsymbol {e}_z$, respectively. The numerical grid employed has the same spacing
 $\varDelta =H/232$ in all directions, resulting in
 $1024 \times 232 \times 512$ grid points in the
 $x$,
 $y$ and
 $z$ directions, respectively. A no-slip condition was applied at the walls, and periodic boundary conditions were applied in the
 $x$ and
 $z$ directions. The gravitational acceleration acts in the direction
 $-\boldsymbol {e}_x$ with magnitude g, and the bulk velocity
 $U_b$ was kept constant by instantaneously adjusting a volume force, equivalent to a pressure gradient, thus imposing a desired bulk Reynolds number
 $Re_b=U_bH/\nu$, where
 $\nu$ is the kinematic viscosity of the fluid. The DNS were all conducted with
 $Re_b=5263$.
Schematic representation of the DNS configuration (not to scale). The marked region shows the location where the structure functions are calculated. (Main part of the picture reprinted from Ma et al. Reference Ma, Santarelli, Ziegenhein, Lucas and Fröhlich2017.)

The data used in this work were obtained for three monodisperse cases (SmMany, SmFew, LaMany) and one bi-disperse case labelled BiDisp, of the same void fraction as SmMany and LaMany with half the void fraction consisting of smaller bubbles and the other half of larger bubbles. Additionally, a single-phase simulation labelled Unladen was performed under the same conditions for comparison. Table 1 provides an overview of all cases with the corresponding labels.
Parameters of the cases used for the present study according to Santarelli & Fröhlich (Reference Santarelli and Fröhlich2016). The labels  $BiDisp(Sm)$ and
 $BiDisp(La)$ denote the results for the bi-disperse case,
 $BiDisp$, where averaging has been restricted to small and large, respectively. Here,
 $N_p$ is the number of bubbles,
 $\alpha _b$ is the bulk void fraction,
 $d_p$ the bubble diameter,
 $Ar\equiv |\rho ^{G}-\rho ^{L}|gd_{p}^{3}/(\rho ^{L}\nu ^{2})$ the Archimedes number. The values of
 $Re_p$, the bubble Reynolds number based on
 $d_p$ and the bubble to fluid relative velocity, as well as
 $C_D$ the drag coefficient, are obtained from the DNS;
 $\varDelta /\eta$ is the ratio of grid resolution and Kolmogorov length
 $\eta \equiv (\nu ^{3}/\langle \epsilon \rangle )^{1/4}$.

The ratios of  $\varDelta /\eta$ for all the cases are given table 1, where
 $\eta$ is the Kolmogorov scale based on the averaged dissipation in the channel centre obtained in Santarelli & Fröhlich (Reference Santarelli and Fröhlich2016). For single-phase turbulence,
 $\varDelta /\eta \lesssim 2.1$ is considered the requirement for a DNS to be well resolved in terms of accurately capturing the dissipation rate in the flow (Pope Reference Pope2000). Based on this criterion, our DNS are well resolved. For accurately capturing high-order moments of small-scale, single-phase turbulence, it is known that finer grids are required, and this likely also applies to bubble-laden turbulent flows. Given these resolution constraints, we restrict our focus in this paper to moments of order four or less. We expect that the grid resolutions of the DNS are sufficient to fully resolve the second- and third-order flow statistics which are the main focus of our paper. For the fourth-order moments, it is possible that the DNS is slightly under-resolved and these results must therefore be treated with some caution. However, as will be shown later, the SmFew case is the one which displays greatest flow intermittency at the small scales, but this case has
 $\varDelta /\eta =0.99$, which is more than twice as fine as required to resolve the dissipation, and may be sufficient for resolving the fourth-order moment. A study similar to Yeung, Sreenivasan & Pope (Reference Yeung, Sreenivasan and Pope2018) will need to be conducted in future work in order to precisely consider the effect of the grid resolution on higher-order statistics in bubble-laden turbulent flows. Another related point is that in Dodd & Jofre (Reference Dodd and Jofre2019) it was shown that the viscous length scale of the flow at a droplet interface in a turbulent flow,
 $\delta _\nu =\nu \sqrt {\rho^G /\tau _\varSigma }$ (
 $\tau _\varSigma$ is the mean interfacial shear stress), can be less that
 $\eta$, and that the grid resolution must be sufficiently fine to resolve this length scale. However, since
 $\delta _\nu$ is small,
 $\alpha _b\leqslant 2.14\,\%$, and we only consider flow data at points where there are no bubbles (see below), then the contribution to the flow data we are analysing arising from flow in the viscous layer around the bubbles in our flow will be very small. Hence, in the regions the flow that are the focus of our analysis, the grid resolution criterion is determined by
 $\eta$, not
 $\delta _\nu$. If, by contrast, we were to consider the flow properties close to the surface of the bubbles, such as was considered in Dodd & Jofre (Reference Dodd and Jofre2019), then it would indeed be necessary to ensure that the grid is sufficiently fine to resolve
 $\delta _\nu$.
2.2. Data processing
A standard way to analyse the multiscale properties of turbulence is to use the fluid velocity increments  $\Delta \boldsymbol {u}'(\boldsymbol {x},\boldsymbol {r},t)\equiv \boldsymbol {u}'(\boldsymbol {x}+\boldsymbol {r},t)-\boldsymbol {u}'(\boldsymbol {x},t)$, where
 $\boldsymbol {u}'\equiv \boldsymbol {u}-\langle \boldsymbol {u}\rangle$ is the fluctuating fluid velocity,
 $\boldsymbol {r}$ is the separation vector and
 $\langle \cdot \rangle$ denotes an ensemble average (estimated using appropriate space and time averages). The calculation of velocity increments in a bubble-laden flow is, however, delicate, since the phase boundaries can interrupt the fluid flow signal. To overcome this non-continuous velocity signal challenge, different methods have been used in the literature, such as smoothing the discontinuities by a Gauss function (Lance & Bataille Reference Lance and Bataille1991); considering only intervals between bubbles where the velocity signal is continuous (Martínez et al. Reference Martínez, Chehata, van Gils, Sun and Lohse2010; Roghair et al. Reference Roghair, Mercado, Van Sint Annaland, Kuipers, Sun and Lohse2011; Mendez-Diaz et al. Reference Mendez-Diaz, Serrano-García, Zenit and Hernández-Cordero2013); and measuring the wake behind a rising swarm of bubbles, where there are no bubbles (Riboux et al. Reference Riboux, Risso and Legendre2010). Here, we use a method ideally suited for interface-resolved DNS of disperse flows proposed in our previous study (Ma et al. Reference Ma, Santarelli, Ziegenhein, Lucas and Fröhlich2017). In this method, the fluid velocity is recorded along grid lines in the spanwise direction whose wall-normal location lies within the centre region
 $0.474H< y<0.526H$ highlighted in figure 1. This width corresponds to the smaller bubble diameter (table 1), which is a sufficiently thin region for these lines to be considered statistically equivalent. For each line, data were recorded whenever the entire line was free from bubbles, and we recorded 1 000 000 instances of this for each case. With this method, one cannot compute
 $\Delta \boldsymbol {u}'(\boldsymbol {x},\boldsymbol {r},t)$ for arbitrary
 $\boldsymbol {r}$, but can compute
 $\Delta \boldsymbol {u}'(\boldsymbol {x},r_3\boldsymbol {e}_3,t)$, allowing us to perform an extensive investigation into the scale-dependent properties of bubble-laden turbulent flows. Note that in the data analysis that follows,
 $\langle \boldsymbol {u}\rangle$ is computed based only on these lines of data, and therefore does not correspond to the average over the entire flow field. The mean velocity makes a negligible direct contribution to the statistics of
 $\Delta \boldsymbol {u}'(\boldsymbol {x},r_3\boldsymbol {e}_3,t)$ since the mean velocity is almost constant over the region
 $0.474H< y<0.526H$ in which the data are collected.
To test for statistical convergence, we computed higher-order moments of  $\Delta \boldsymbol {u}'(\boldsymbol {x},r_3\boldsymbol {e}_3,t)$ over the first and second halves of the dataset consisting of 1 000 000 lines of data. The results showed negligible differences, indicating that the 1 000 000 realizations are sufficient for statistical convergence of the results.
2.3. Reynolds number in bubble-laden turbulent flows
Before analysing the properties of the bubble-laden turbulent channel flows at different scales we first consider the Reynolds numbers of the different cases, since this gives insight into the range of excited scales of motion in the turbulent flow. As mentioned in § 2, the bulk Reynolds number  $Re_b=U_bH/\nu$ was kept fixed at
 $Re_b=5263$. However, since we are interested in the properties of the fluctuating component of the velocity field, it is more informative for our purposes to consider a Reynolds number based on the fluctuating velocity field. To that end we consider the Reynolds number
 $Re_H\equiv u^{\ast } H/\nu$, where
 $u^{\ast }\equiv \sqrt {(2/3)k_c}$, and
 $k_c$ is the turbulent kinetic energy (TKE)
 $k\equiv (1/2)\langle u_i'u_i'\rangle$ evaluated at the channel centre.
In figure 2 we plot  $Re_H$ vs
 $A_2$, where
 $A_2=a_{ji}a_{ij}$ is the second invariant of the Reynolds-stress anisotropy tensor (evaluated at the channel centre),
 $a_{ij}=\langle {u}'_i{u}'_j\rangle /k-(2/3)\delta _{ij}$, that quantifies the magnitude of the large-scale anisotropy in the flow. Plotting the results in this way gives further insight into how the range of excited scales in the flow is also related to the flow anisotropy. The results show that
 $Re_H$ varies significantly across the cases. In the SmFew case, it is only slightly larger than the unladen case as the bubble size
 $d_p$ is small and the bulk void fraction
 $\alpha _b$ is quite low. However, as
 $d_p$ and
 $\alpha _b$ are increased,
 $Re_H$ increases significantly, implying that as
 $d_p$ and
 $\alpha _b$ are increased (at least over the range we consider), the range of excited scales in the flow also increases, and hence the flow becomes increasingly multiscale. The increase cannot continue indefinitely, however, since when
 $d_p$ and
 $\alpha _b$ become sufficiently large, the problem becomes analogous to flow through a porous medium, for which the flow Reynolds number cannot be very large. This is also related to the fact that in such a regime,
 $H$ is no longer the relevant length scale in the flow Reynolds number, but rather the inter-bubble distance becomes the appropriate length scale. In the range of parameters considered for the bubble-laden cases, figure 2 suggests that
 $Re_H$ monotonically decreases with increasing
 $A_2$. While one may speculate that this is due to the differing properties of the bubble wakes for different sized bubbles, the explanation for the observed trend is not entirely clear since the behaviour may also depend on wake interactions which are more difficult to understand.
Reynolds number,  $Re_H$ plotted vs the second anisotropy invariant.

3. Multiscale anisotropy and second-order structure function
A systematic approach for analysing the multiscale anisotropy of a turbulent flow is to use the irreducible representations of the SO(3) group, which consists of projecting the multipoint turbulent correlation functions onto the space of spherical harmonics (Arad, L'vov & Procaccia Reference Arad, L'vov and Procaccia1999; Biferale & Toschi Reference Biferale and Toschi2001; Biferale & Procaccia Reference Biferale and Procaccia2005). However, such an analysis requires information on the full three-dimensional flow field, something that is usually not obtainable from experiments. Furthermore, as discussed in § 2, phase boundaries interrupt the flow field in multiphase flows, introducing further challenges in applying this method.
Due to these challenges, many investigations on anisotropy in turbulent flows focus directly on the structure function tensor (which are essentially moments of the velocity increments), comparing the longitudinal and transverse components in order to discern the level of anisotropy in the flow. In single-phase flows, the main focus was on scrutinizing the postulate of local isotropy and its implications (Kolmogorov Reference Kolmogorov1941b, K41 for brevity). In general, experiments and numerical simulations do not strictly confirm the convergence toward isotropy predicted within K41 theory as a function of the scale (Dhruva, Tsuji & Sreenivasan Reference Dhruva, Tsuji and Sreenivasan1997; Kurien & Sreenivasan Reference Kurien and Sreenivasan2000; Shen & Warhaft Reference Shen and Warhaft2002). In the context of the single-point Reynolds stresses, the Lumley triangle (Lumley & Newman Reference Lumley and Newman1977) provided a powerful way to quantify and visualize anisotropy in the flow. It would be desirable to have something analogous to this for the structure functions, which would then provide a way to quantify and visualize anisotropy in the flow at different scales.
3.1. Second-order structure function and its anisotropy
Consider the second-order structure function
 \begin{equation} D_{ij}(\boldsymbol{r},t)\equiv\langle \Delta u'_i(\boldsymbol{r},t)\Delta u'_j(\boldsymbol{r},t) \rangle . \end{equation}
Hereafter, we will suppress the time argument since we are focusing on statistically stationary flows. The Cartesian coordinate system chosen is depicted in figure 1, and as discussed in § 2, our DNS data only allow us to compute the velocity increments for separations in the spanwise direction, i.e.  $\boldsymbol {r}=r_3\boldsymbol {e}_3$ (and
 $r\equiv \|\boldsymbol {r}\|=r_3$). In this case the longitudinal structure function is
 $D_{LL}(r_3)=D_{33}(r_3)$, and for an incompressible, isotropic flow we would have
 \begin{equation} D_{11}^{iso}=D_{22}^{iso}=D_{33}+\frac{r}{2}\frac{\partial}{\partial{r}}D_{33};\quad D_{ij}^{iso}=0 \ (\mathrm{for} \ i\neq j). \end{equation}
Figure 3 displays the results for  $D_{11},D_{22},D_{33}$ as a function of
 $r/H$ for all of the DNS cases. We also plot the isotropic form of the results based on (3.2a,b) for the cases Unladen (labelled Unladen iso) and SmFew (labelled SmFew iso). The results show that, in general, the introduction of bubbles into the flow leads to strong enhancements of the fluctuations in all three directions of the flow. For
 $r/H\geqslant O(1)$,
 $D_{\gamma \gamma }\approx 2\langle u'_\gamma u'_\gamma \rangle$ as expected (no index summation is implied), and are consistent with the values obtained by Santarelli & Fröhlich (Reference Santarelli and Fröhlich2016) for the corresponding Reynolds normal stresses in the channel centre. Compared with the unladen case, the enhancement of the structure function level is in the sequence SmFew, SmMany, BiDisp to LaMany, which corresponds to increasing averaged bubble Reynolds number and/or gas void fraction. This holds for all three directions across all scales from around one channel width to the smallest dissipative scales, and shows that the bubbles modify fluctuations in the flow at scales both larger and smaller than the bubble length scale
 $d_p$. Moreover, the increase of the structure functions in the bubble-laden cases is more pronounced at the smaller scales than at the larger scales. This behaviour is in close agreement with the experimental results of Rensen et al. (Reference Rensen, Luther and Lohse2005) who used Taylor's hypothesis to construct the results. We also note that, although
 $D_{22}$ is very similar for the Unladen and the SmFew cases at the large scales, it is significantly different for these cases at the smaller scales (and similarly for
 $D_{33}$), with the bubbles significantly enhancing the smaller-scale fluctuations in the flow.
DNS results for the second-order transverse (a,b) and longitudinal (c) structure functions.

For the unladen case, departures from  $D_{11}= D_{11}^{iso}$ and
 $D_{22}= D_{22}^{iso}$ are not too strong, with stronger departures at the larger scales, consistent with the Reynolds-stress behaviour in the channel centre
 $\langle u_1'u_1'\rangle /\langle u_2'u_2'\rangle \approx 1.47$. As
 $r$ is decreased the flow becomes more isotropic, although, as we shall show later, the small scales do not actually reach an isotropic state. In contrast, for the bubble-laden cases, there are strong departures from isotropy at all scales. For example, for the SmFew case,
 $D_{11}$ shows significant deviations from
 $D_{11}^{iso}$ at all scales, and for
 $D_{22}$ the deviations from the isotropic form
 $D_{22}^{iso}$ actually become stronger as one goes to scales smaller than the bubble length scale (
 $d_p\approx 0.05H$ for this case), while the larger scales behave more isotropically. The return to isotropy can therefore be strongly violated for bubbly turbulent flows. This is not surprising, however, since the mean velocity of the bubbles is unidirectional, and the fact that
 $d_p\ll H$ means that the bubbles can directly inject fluctuations into the flow at the small scales, in contrast to the unladen case where the fluctuations are injected into the flow at large scales due to the mean shearing of the flow.
Figure 4 shows the ratios of the different structure function components in order to see more clearly the anisotropy of the flow. For an isotropic system we would have  $D_{11}/D_{22}=1$ at all scales, and for the unladen case
 $D_{11}/D_{22}$ is quite close to 1, especially at smaller scales, while for the bubble-laden cases
 $D_{11}/D_{22}$ deviates strongly from 1, reaching values
 $O(10)$. Except for the SmFew case, the curves for
 $D_{11}/D_{22}$ in the bubble-laden cases tend to decrease with decreasing
 $r$, but with a bump at scale
 $r=O(d_p)$, indicating the injection of anisotropy at the bubble scale. In isotropic turbulence,
 $D_{11}/D_{33}\rightarrow 1$ and
 $D_{22}/D_{33}\rightarrow 1$ for
 $r\geqslant O(H)$, while
 $D_{11}/D_{33}\rightarrow 2$ and
 $D_{22}/D_{33}\rightarrow 2$ for
 $r/H\to 0$ (Pope Reference Pope2000). While deviations from these are not too strong for the unladen case, strong departures are observed for the bubble-laden cases at all scales. The departures are strongest for the ratios involving
 $D_{11}$, which is to be expected since this is the direction of the mean trajectory of the bubbles. Moreover, for each of the ratios plotted in figure 4, the bubble-laden cases reveal a bump at
 $r=O(d_p)$, indicating the injection of anisotropy into the flow due to the bubbles and their anisotropic motion in the flow due to the buoyancy force acting on them.
Ratio of  $D_{TT}/D_{TT}$ (a) and
 $D_{TT}/D_{LL}$ (b,c) vs separation distance for all cases considered.

While comparisons of the ratios of  $D_{11}, D_{22}, D_{33}$ are a standard way to analyse the multiscale anisotropy in the flow (van de Water & Herweijer Reference van de Water and Herweijer1999; Brugger et al. Reference Brugger, Katul, De Roo, Kröniger, Rotenberg, Rohatyn and Mauder2018), this method provides limited quantitative insight into the degree of anisotropy. For example, while the behaviour of these ratios is well known for an isotropic flow in the limits
 $r/H\to 0$,
 $r/H\geqslant O(1)$, their behaviour for intermediate
 $r/H$ is not known and cannot be determined simply by the condition of isotropy. It is therefore desirable to provide a simple measure of anisotropy based on
 $D_{ij}$ that applies at all scales, and also helps to visualize the anisotropic behaviour. In the context of the Reynolds-stress tensor, this can be achieved using either the Lumley triangle (Lumley & Newman Reference Lumley and Newman1977) or, more recently, the barycentric map (BAM) proposed by Banerjee et al. (Reference Banerjee, Krahl, Durst and Zenger2007). However, as we describe in the next subsection, these methods cannot be directly applied to quantify multiscale anisotropy associated with
 $D_{ij}$, and modification is required.
3.2. Quantifying and visualizing scale-dependent anisotropy
Characterizing the scale-dependent anisotropy associated with  $D_{ij}$ is considerably more involved than that based on the Reynolds stress
 $\langle u_i u_j\rangle$. This is because the relationship between componentiality and isotropy breaks down at sub-integral scales. For example, in the case of the Reynolds-stress tensor, its components in the isotropic state are
 $\langle u'_i u_j'\rangle ^{iso}\equiv \langle u'_m u_m'\rangle \delta _{ij}/3$, according to which the components in all three Cartesian directions are the same (a ‘three-component flow’). In the case of
 $D_{ij}$, its isotropic state is (assuming the flow is incompressible)
 \begin{equation} D_{ij}^{iso}=D_{LL}\delta_{ij}+\frac{r}{2}\left(\delta_{ij}-\frac{r_ir_j}{r^{2}}\right)\frac{\partial}{\partial{r}}D_{LL} .\end{equation}
At the large scales  $(\partial /\partial r)D_{LL}=0$, and we have
 $D_{ij}^{iso}=D_{LL}\delta _{ij}=\langle u'_m u_m'\rangle \delta _{ij}/3$, and hence the isotropic state corresponds to a three-component flow. On the other hand, in the limit
 $r\to 0$ one has
 $D_{LL}=\langle \epsilon \rangle r^{2}/15\nu$ (Pope Reference Pope2000) and
 \begin{equation} D_{ij}^{iso}=2 D_{LL}\delta_{ij}-\frac{r_ir_j}{r^{2}}D_{LL} . \end{equation}
In this case the isotropic state does not correspond to a three-component flow, but rather the components transverse to  $\boldsymbol {r}$ are twice as large as those parallel to
 $\boldsymbol {r}$. Hence, in general there is no correspondence between the componentiality of the flow and isotropy. For this reason, measures such as
 $D_{ij}-(D_{mm}\delta _{ij}/3)$, which have previously been used to define scale-dependent anisotropy (e.g. Brugger et al. Reference Brugger, Katul, De Roo, Kröniger, Rotenberg, Rohatyn and Mauder2018), do not in fact quantify isotropy, but rather only quantify deviations from the three-component state.
In view of these considerations, anisotropy must be quantified by the deviation of  $D_{ij}$ from
 $D_{ij}^{iso}$, rather than from
 $D_{mm}\delta _{ij}/3$. To this end, we define two normalized tensors
 $\boldsymbol {A}^{iso}$ and
 $\boldsymbol {A}$ with components
 \begin{equation} A_{ij}^{iso}(\boldsymbol{r})\equiv\frac{D_{ij}^{iso}}{D_{kk}^{iso}} , \end{equation}
and
 \begin{equation} A_{ij}(\boldsymbol{r})\equiv\frac{D_{ij}}{D_{kk}} , \end{equation}
respectively. We may represent these symmetric tensors in their respective eigenframes, and then re-arrange to write them in the form
 $$\begin{gather} \boldsymbol{A}^{iso}=(\lambda_1-\lambda_2)\boldsymbol{P}_{1c}+(\lambda_2-\lambda_3)\boldsymbol{P}_{2c}+\lambda_3\boldsymbol{P}_{3c}, \end{gather}$$
 $$\begin{gather}\boldsymbol{A}=(\mu_1-\mu_2)\boldsymbol{Q}_{1c}+(\mu_2-\mu_3)\boldsymbol{Q}_{2c}+\mu_3\boldsymbol{Q}_{3c}, \end{gather}$$
where  $\lambda _{1}\geqslant \lambda _{2}\geqslant \lambda _{3}$ are the ordered eigenvalues of
 $\boldsymbol {A}^{iso}$ (due to isotropy we have
 $\lambda _1=\lambda _2$) with corresponding normalized eigenvectors
 $\boldsymbol {p}_1,\boldsymbol {p}_2,\boldsymbol {p}_3$ and
 $\mu _1\geqslant \mu _2\geqslant \mu _3$ are the ordered eigenvalues of
 $\boldsymbol {A}$ with corresponding normalized eigenvectors
 $\boldsymbol {q}_1,\boldsymbol {q}_2,\boldsymbol {q}_3$. The basis tensors in (3.7) and (3.8) are defined as
 $$\begin{gather} \boldsymbol{P}_{1c}\equiv \boldsymbol{p}_1\boldsymbol{p}_1;\quad \boldsymbol{P}_{2c}\equiv \boldsymbol{p}_1 \boldsymbol{p}_1+\boldsymbol{p}_2\boldsymbol{p}_2;\quad\boldsymbol{P}_{3c}\equiv \boldsymbol{p}_1\boldsymbol{p}_1+\boldsymbol{p}_2\boldsymbol{p}_2+\boldsymbol{p}_3\boldsymbol{p}_3, \end{gather}$$
 $$\begin{gather}\boldsymbol{Q}_{1c}\equiv \boldsymbol{q}_1\boldsymbol{q}_1;\quad \boldsymbol{Q}_{2c}\equiv \boldsymbol{q}_1\boldsymbol{q}_1+\boldsymbol{q}_2\boldsymbol{q}_2;\quad \boldsymbol{Q}_{3c}\equiv \boldsymbol{q}_1\boldsymbol{q}_1+\boldsymbol{q}_2\boldsymbol{q}_2+\boldsymbol{q}_3\boldsymbol{q}_3, \end{gather}$$
and represent the one-component, two-component and three-component limiting states of the tensor. For example, if the tensor  $\boldsymbol {A}$ has
 $\mu _1\neq 0, \mu _2=\mu _3=0$ then
 $\boldsymbol {A}=\mu _1\boldsymbol {Q}_{1c}$ so that the tensor is one-component, while if the tensor has
 $\mu _1=\mu _2,\mu _3=0$ then
 $\boldsymbol {A}=\mu _2\boldsymbol {Q}_{2c}$ so that the tensor is two-component etc. The two sets of basis tensors
 $\boldsymbol {P}_{1c}, \boldsymbol {P}_{2c}, \boldsymbol {P}_{3c}$ and
 $\boldsymbol {Q}_{1c}, \boldsymbol {Q}_{2c}, \boldsymbol {Q}_{3c}$ are related by rotation matrices and contain information on the orientation of the tensors. Our aim is to use a BAM to visualize the componentiality of the tensors, and the information on the componentiality is contained within the coefficients multiplying the basis tensors in (3.7) and (3.8). The BAM (like the Lumley triangle) therefore does not convey information about the orientation of the tensor in space, which is contained in the basis tensors.
The coordinates of a BAM are used to represent the componentiality of the flow, and to construct such a map, new variables are introduced corresponding to the coefficients in (3.7) and (3.8) normalized by the largest associated eigenvalue
 $$\begin{gather} \mathcal{I}_{1c}=(\lambda_{1}-\lambda_{2})/\lambda_1;\quad \mathcal{I}_{2c}=(\lambda_{2}-\lambda_{3})/\lambda_1 ;\quad \mathcal{I}_{3c}=\lambda_{3}/\lambda_1, \end{gather}$$
 $$\begin{gather}\mathcal{J}_{1c}=(\mu_{1}-\mu_{2})/\mu_1;\quad \mathcal{J}_{2c}=(\mu_{2}-\mu_{3})/\mu_1 ;\quad \mathcal{J}_{3c}=\mu_{3}/\mu_1. \end{gather}$$
Using these variables, the coordinates for a BAM can be defined as (Banerjee et al. Reference Banerjee, Krahl, Durst and Zenger2007)
 $$\begin{gather} (x_{BAM}^{iso},y_{BAM}^{iso})=\mathcal{I}_{1c}(x_{1c},y_{1c})+\mathcal{I}_{2c}(x_{2c},y_{2c})+\mathcal{I}_{3c}(x_{3c},y_{3c}), \end{gather}$$
 $$\begin{gather}(x_{BAM},y_{BAM})=\mathcal{J}_{1c}(x_{1c},y_{1c})+\mathcal{J}_{2c}(x_{2c},y_{2c})+\mathcal{J}_{3c}(x_{3c},y_{3c}). \end{gather}$$
Here,  $(x_{1c}, y_{1c})=(1,0)$,
 $(x_{2c}, y_{2c})=(0,0)$ and
 $(x_{3c}, y_{3c})=(1/2,\sqrt {3}/2)$ are the three corner points corresponding to the limiting states of componentiality, which are chosen to be corner points of an equilateral triangle as this aids the interpretation of the BAM results. By design, according to their definitions we have
 $\mathcal {I}_{1c}+\mathcal {I}_{2c}+\mathcal {I}_{3c}=1$,
 $\mathcal {J}_{1c}+\mathcal {J}_{2c}+\mathcal {J}_{3c}=1$ and at each corner of the triangle, only one of the coefficients is finite. As such, the location of a given coordinate in the triangle provides direct visual information regarding the componentiality of the flow at the scale considered, and the relative contribution of each of the three limiting states.
With this approach,  $\boldsymbol {A}^{iso}(\boldsymbol {r})$ and
 $\boldsymbol {A}(\boldsymbol {r})$ can be mapped to a location in the BAM, and the linear distance between the coordinates corresponding to these two tensors then gives a measure of the anisotropy at that scale. In particular, the anisotropy at a given scale can be quantified by
 \begin{equation} C_{ani}(\boldsymbol{r})\equiv\sqrt{(x_{BAM}-x_{BAM}^{iso})^{2}+(y_{BAM}-y_{BAM}^{iso})^{2}}. \end{equation}
For an isotropic flow,  $\boldsymbol {A}=\boldsymbol {A}^{iso}$, and consistent with this our definition yields
 $C_{ani}= 0\,\forall r$. The point in the BAM representing the state
 $\boldsymbol {A}=\boldsymbol {A}^{iso}$ will in general depend upon scale. At the large scales of an isotropic flow,
 $\mathcal {I}_{1c}=\mathcal {I}_{2c}=0$ and
 $\mathcal {I}_{3c}=1$, so that the coordinates for
 $\boldsymbol {A}^{iso}$ are
 $(x_{BAM}, y_{BAM})=(x_{3c}, y_{3c})$. Therefore, at the large scales
 $C_{ani}(\boldsymbol {r})$ recovers the property that anisotropy is related to distance from the top of the triangle which corresponds to the three-component state, just as for the single-point Reynolds-stress tensor (Banerjee et al. Reference Banerjee, Krahl, Durst and Zenger2007). At smaller scales,
 $\boldsymbol {A}^{iso}$ is not located at the point
 $(x_{BAM}, y_{BAM})=(x_{3c}, y_{3c})$, and its location in the triangle will depend upon
 $\boldsymbol {r}$. Provided that
 $(\partial /\partial r)D_{LL}\geqslant 0$ (true for a homogeneous flow), then all projections of
 $D_{ij}^{iso}$ in the plane orthogonal to
 $\boldsymbol {r}$ are equivalent and are greater than or equal to
 $D_{LL}$. As a result, the point representing
 $\boldsymbol {A}^{iso}$ is confined to the left side of the triangle, corresponding to a state of axisymmetric contraction. Moreover, as
 $r$ is decreased, this point moves monotonically away from the three-component state towards the two-component state. The linear distance from this point to the point in the triangle representing
 $\boldsymbol {A}$ represents the amount of anisotropy. This is illustrated in figure 5.
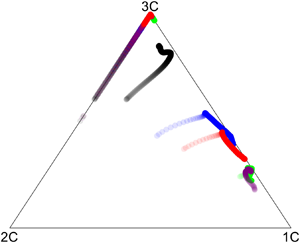
Representation of  $\boldsymbol {A}$ (3.6) and its isotropic form
 $\boldsymbol {A}^{iso}$ (3.5) in the BAM (a) for all cases considered. The transparency of a given colour reflects the scale size, with lighter/darker denoting smaller/larger scale. (b) Plot to illustrate the meaning of
 $C_{ani}({r})$, defined in (3.15), using data for the BiDisp case. In this plot,
 $C_{ani}({r})$ is depicted by the double-arrow lines, with different lines corresponding to
 $C_{ani}$ at different scales
 $r$. The start and end points for a given line correspond to points in the BAM representing
 $\boldsymbol {A}(r)$ and
 $\boldsymbol {A}^{iso}(r)$, and the length of the line denotes the value of
 $C_{ani}$. The lines shown correspond to the values of
 $C_{ani}$ for the smallest scale
 $r=\varDelta$ and largest scale
 $r=1.1H$ accessible with our dataset, and illustrate that the anisotropy is stronger at
 $r=1.1H$ than it is at
 $r=\varDelta$.

We note that in the traditional Lumley triangle, it is the fact the trace of the Reynolds-stress anisotropy tensor,  $a_{ii}$, is zero that allows its properties to be represented in a two-dimensional triangle using two independent eigenvalues of
 $a_{ij}$. This restriction does not apply to the BAM approach, which is why we are able to represent the properties of
 $\boldsymbol {A}^{iso}$ and
 $\boldsymbol {A}$ in a two-dimensional map, even though the trace of these tensors is not zero.
3.3. Application of the new method
We now turn to apply the new method described in § 3.2 to our DNS results. The trajectories for  $\boldsymbol {A}^{iso}$ in figure 5(a) all lie on the left side of the triangle, corresponding to the state of axisymmetric contraction, associated with the fact that
 $D_{11}^{iso}=D_{22}^{iso}\geqslant D_{33}$. The trajectories for
 $\boldsymbol {A}^{iso}$ at large
 $r$ are near to the three-component upper corner of the triangle, however, for the largest
 $r/H$ for which we have data,
 $(\partial /\partial r)D_{LL}\neq 0$ and so the exact three-component state
 $\boldsymbol {A}^{iso}=\boldsymbol {I}/3$ is not observed. As
 $r$ is decreased, the trajectory for
 $\boldsymbol {A}^{iso}$ moves down the left side of the triangle, towards the two-component corner. As discussed in § 3.2, the reason why
 $\boldsymbol {A}^{iso}$ is located along this edge of the triangle is that
 $D_{11}^{iso}=D_{22}^{iso}> D_{33}$ when
 $(\partial /\partial r)D_{33}> 0$, corresponding to a state of axisymmetric contraction.
The results in figure 5(a) for  $\boldsymbol {A}$ show that for all cases, at the large scales the flow is closer to a state of axisymmetric expansion than contraction (unlike
 $\boldsymbol {A}^{iso})$, due to the streamwise fluctuations being larger than those for the other directions. However, the bubble cases are much closer to the one-component corner of the triangle at the large scales than the unladen case. This is due to the fact that in addition to the streamwise pressure gradient acting on the flow, the bubbles also experience a strong buoyancy force in this direction which causes their streamwise fluctuations to be much larger than the fluctuations in the other directions. The trajectories of
 $\boldsymbol {A}$ in the triangle are highly nonlinear, and show a tendency to migrate towards the axisymmetric contraction side of the triangle as
 $r$ is decreased, consistent with an approach to isotropy as
 $r$ is decreased, although never obtaining an isotropic state. The exception to this is the SmFew case for which the trajectory of
 $\boldsymbol {A}$ actually approaches the one-component corner of the triangle as
 $r$ is decreased. This surprising behaviour is consistent with that observed in figure 4. For each of the bubble cases, and most noticeably for the LaMany and BiDisp cases, there is a cusp point at which the trajectory of
 $C_{ani}$ as a function of
 $r$ in the triangle changes direction. This turning point occurs at
 $r=O(d_p)$.
A quantitative measure of the scale-wise anisotropy is provided by  $C_{ani}$, introduced in § 3.2. This quantity provides a linear measure of anisotropy, and is zero for an isotropic flow. For illustration, in figure 5(b) we show the trajectories of
 $\boldsymbol {A}$ and
 $\boldsymbol {A}^{iso}$ for the BiDisp case and join the starting and ending points of these trajectories with double-arrow lines. The length of the line connecting the starting points represents
 $C_{ani}(r=1.1H)$, while the length of the line connecting the ending points represents
 $C_{ani}(r=\varDelta )$, where
 $\varDelta$ is the grid spacing in the spanwise direction. The plot shows that
 $C_{ani}(1.1H)>C_{ani}(\varDelta )$, such that the flow is more isotropic at the smaller scales in BiDisp case.
In figure 6 we show the results for  $C_{ani}$ as a function of
 $r/H$ for all cases. In general,
 $C_{ani}$ monotonically decreases with decreasing
 $r$, showing that the flow becomes more isotropic at decreasing scales. However, for these cases isotropy is never fully recovered, with anisotropy persisting into the dissipative range scales. Such behaviour for unladen turbulent flows has also been observed experimentally, including at much higher Reynolds numbers, as seen in studies by Kurien & Sreenivasan (Reference Kurien and Sreenivasan2000), Antonia, Zhou & Romano (Reference Antonia, Zhou and Romano2002) and Carter & Coletti (Reference Carter and Coletti2017). Furthermore, we note that for
 $r\leqslant 0.02H$ (most clearly seen in the semi-log plot of figure 6b) the return to isotropy is interrupted for the unladen case, and
 $C_{ani}$ actually becomes larger as
 $r$ is further decreased, implying increasing anisotropy at these scales. Similar behaviour has also been observed in both experimental (Carter & Coletti Reference Carter and Coletti2017) and numerical studies (Meneveau Reference Meneveau1991; Bos, Liechtenstein & Schneider Reference Bos, Liechtenstein and Schneider2007), where it was suggested to be due to anisotropic intermittency at the dissipative scales.
Anisotropy measures  $C_{ani}$ (a) linear plot, (b) the same data with semi-log plot. The two vertical dashed lines in (b) show
 $r=d_p$ for smaller and larger bubbles, respectively.

The results in figure 6 show that the departure from isotropy is in general much more pronounced for the bubble-laden cases than for the unladen case. This is again due to the fact that the bubbles introduce a significant source of momentum into the flow in the direction parallel to gravity due to the buoyancy force they experience. For the unladen case, the anisotropy is quite weak in the channel centre because the mean shear that generates the anisotropy is weak in that region of the flow. We also notice from figure 6(a) that the level of anisotropy decreases with increasing bubble Reynolds number,  $Re_p$. In particular, the anisotropy across the scales generally decreases in the sequence SmMany (SmFew), BiDisp to LaMany, which corresponds to increasing
 $Re_p$. This behaviour is likely due to both the
 $Re_p$-dependent structure of the wakes produced by the bubbles (see the supplementary material to Santarelli & Fröhlich Reference Santarelli and Fröhlich2016) and also the path of the rising bubbles which becomes more chaotic and less uni-directional as
 $Re_p$ increases (Horowitz & Williamson Reference Horowitz and Williamson2010; Ern et al. Reference Ern, Risso, Fabre and Magnaudet2012). It is also interesting to note that the cases SmFew and SmMany which have similar
 $Re_p$, but different
 $\alpha _b$, have a similar level of anisotropy. This suggests that
 $Re_p$ plays more of a role than
 $\alpha _b$ in determining the contribution of the bubbles to the flow anisotropy, at least over some regimes of
 $\alpha _b$ (of course it cannot be true in general since, for example, when
 $\alpha _b=0$ the bubbles have no effect on the flow).
Another observation prompted by figure 6 is that the shape of the  $C_{ani}$ curve is remarkably similar for the three cases involving the highest
 $\alpha _b$ (SmMany, LaMany and BiDisp). This shape may be approximately divided into three regimes: for
 $r>O(d_p)$, a range in which the anisotropy gradually reduces as
 $r$ is decreased; a bump (seen more clearly in the semi-log plot) is observed at the scale of the bubble
 $r=O(d_p)$; and a third regime at
 $r< O(d_p)$ where the anisotropy again reduces, but at a much faster rate with decreasing
 $r$ than it does in the first regime. This rapid reduction in anisotropy in the last regime is never fully successful, however, with significant anisotropy persisting at the smallest scales. For the SmFew case, the first two regimes can also be identified, however, we observe scale-independent anisotropy for
 $r< O(d_p)$. A possible reason for this difference is that due to the low gas void fraction in the SmFew case, scales at
 $r< O(d_p)$ are influenced more strongly than the other cases by the single-phase behaviour, which as discussed, leads
 $C_{ani}$ to actually increase at the smallest scales. Moreover, we notice that the rate at which the anisotropy decays with decreasing
 $r$ is stronger with increasing
 $Re_p$, even though the actual value of the anisotropy becomes weaker with increasing
 $Re_p$. This is in contrast with the phenomenological notion from single-phase homogeneous anisotropic turbulence that the rate of return is typically faster for more strongly anisotropic flows, and is related to the nature of the slow part of the pressure–strain interaction term (Chung & Kim Reference Chung and Kim1995). The present observation implies, however, that in bubbly flows the additional rapid pressure–strain term arising from the bubble-induced force production (Ma et al. Reference Ma, Lucas, Jakirlić and Fröhlich2020b) may play an important role in determining the scale-dependent anisotropy in bubbly turbulent flows. More extensive DNS data would be required in order to investigate this in detail.
The results in figure 6(b) also show that there is no clear difference in the scale at which the bump occurs in the  $C_{ani}$ curve when comparing cases with small and large bubbles. One reason for this is simply that if the injection of fluctuations into the flow by the bubbles occurs primarily at
 $r=O(d_p)$, then, unless
 $d_p$ differs significantly, one might not be able to discern a clear difference in the scale of the injection. This is the case for the present data, since the small and large bubbles have diameters in the ratio
 $0.052:0.076$, i.e. their ratio is order 1.
4. High-order structure functions
4.1. Energy transfer and third-order structure functions
The third-order structure function is of particular significance since it is related to the mean nonlinear energy transfer among the scales of a turbulent flow (Alexakis & Biferale Reference Alexakis and Biferale2018). In particular, in the Kármán–Howarth-type equation governing  $D_{ii}(r_3,t)$, the inter-scale energy transfer term is (Hill Reference Hill2001)
 \begin{equation} \mathcal{F}(r_3,t)=\sum_{\gamma=1}^{3}\mathcal{F}_\gamma(r_3,t)\equiv \sum_{\gamma=1}^{3}\left.\frac{\partial}{\partial r_\gamma}D_{\gamma ii}\right\vert_{\boldsymbol{r}=r_3\boldsymbol{e}_3},\end{equation}
where  $D_{\gamma ii}(\boldsymbol {r},t)\equiv \langle \Delta {u'_\gamma }(\boldsymbol {r},t) \varDelta u'_i(\boldsymbol {r},t)\Delta u'_i(\boldsymbol {r},t)\rangle$. Note that this definition does not assume isotropy of the flow, but applies to anisotropic flows as considered here.
When  $\mathcal {F}<0$, this corresponds to the nonlinear term supplying energy to the scale, while
 $\mathcal {F}>0$ corresponds to the nonlinear term removing energy from the scale. In a single-phase, three-dimensional turbulent flow, there is on average a downscale flux of energy with
 $\mathcal {F}<0$ in the inertial and dissipation ranges, representing the transfer of energy injected into the flow at the large scales down to the smallest scales where it is dissipated due to viscous stresses. However, the presence of bubbles in the flow could change this picture, since bubbles produce kinetic energy at scales
 $O(d_p)$ and some of this may then be transferred up towards the larger scales, as well as some being transferred down towards smaller scales. It is of great interest to understand this basic question of how the bubbles modify the energy transfer mechanisms and behaviour in the turbulent flow compared with the single-phase behaviour and mechanisms of strain self-amplification and vortex stretching (Carbone & Bragg Reference Carbone and Bragg2020; Johnson Reference Johnson2020). However, since our DNS data were obtained for a fixed streamwise and wall-normal location, we are only able to compute the
 $\mathcal {F}_3$ contribution in (4.1), and thereby cannot fully determine
 $\mathcal {F}$. Nevertheless, we can still partially explore the question of the effect of the bubbles on the energy transfer by considering
 $\mathcal {F}_3$.
In figure 7(a) we plot  $\mathcal {F}_3$ for the unladen case. The results show that at larger scales
 $\mathcal {F}_3>0$, while at smaller scales
 $\mathcal {F}_3<0$, corresponding to energy being taken from the large scales and passed down to the small scales via the nonlinear transfer term. At this low Reynolds number, there is no inertial range over which
 $\mathcal {F}_3$ is constant, indicating that there is no cascade in the strict sense. In figure 7(b) we plot
 $\mathcal {F}_3$ for all the cases. The first thing that is apparent from these results is that the nonlinear energy transfer is in general much stronger for the bubble cases than the unladen case. For example, for the LaMany case, the peak magnitude of
 $\mathcal {F}_3$ is three orders of magnitude larger than for the unladen case. However, this is mainly due simply to the fact that the bubble-laden cases have more turbulent kinetic energy in the flow (see figure 3). The second thing is that the direction of the energy transfer for the bubble cases is the same as the unladen case, indicating that energy is passed downscale from the large scales to the small scales in the flow. The study of Pandey et al. (Reference Pandey, Ramadugu and Perlekar2020) explored a homogeneous bubbly turbulent flow using a Fourier space analysis and also observed that there is a downscale energy transfer, although their flow was considerably different to ours, and as noted in the introduction, there are some issues with their analysis.
Contribution  $\mathcal {F}_3$ to the nonlinear energy transfer term: (a) unladen case, (b) all the cases.

Our results indicate then that the introduction of bubbles into the turbulent flow does not lead to an upscale energy transfer, at least for the cases we have considered and for the  $\mathcal {F}_3$ contribution. One possible reason for this is that the energy being sent downscale from the large scales (where it is produced due to the mean-shear production), simply overwhelms any energy being transferred upscale from the bubbles, so that overall the energy transfer is downscale. However, since in most of these bubble cases the dominant source of TKE comes from bubble induced production (Santarelli & Fröhlich Reference Santarelli and Fröhlich2016), rather than mean-shear production, this does not seem likely. A second possible reason is that since the scales at which the bubbles are producing kinetic energy,
 $O(d_p)$, are also scales at which the viscous forces in the flow are strong, then most of the kinetic energy produced by the bubbles may be simply dissipated before it is able to be transferred upscale by nonlinear forces in the flow. A third possible reason relates to the fact that although the bubble length scale is
 $d_p$, they may inject energy at scales significantly larger than this. Indeed, the wakes produced by bubbles can have a length that is
 $O(10 d_p)$. For the Reynolds number of our DNS the scale separation between the bubble diameter and the large scales of the flow is not very large, and therefore the bubbles may actually directly inject TKE into scales on the order of the large scales of the flow, and this energy is then able to be sent downscale via the nonlinear energy transfer term. If this third explanation is true, then an interesting implication is that if BIT flows can develop with
 $d_p\lll \ell _I$ (where
 $\ell _I$ is the integral length scale of the flow), then the maximum scale at which the bubbles will inject energy into the flow will be much smaller than
 $\ell _I$. In this case, an upscale energy transfer must occur at scales
 $\gg d_p$ since otherwise the large scales would have no source of energy.
In figure 8 we plot one of the contributions to  $\mathcal {F}_3$, namely
 $d D_{333}/dr$. In contrast to figure 7, this result shows that for the SmFew and SmMany cases there is an upscale transfer of energy, with energy being extracted from the small scales and passed to the large scales. This reveals a subtle effect of the bubbles; while overall the bubble cases still exhibit a downscale energy transfer, the energy transfer associated with particular components of the velocity field do exhibit an upscale energy transfer. By contrast, the LaMany case shows
 $d D_{333}/dr<0$ at the small scales, corresponding to a downscale energy transfer. This differing behaviour is likely because for this case
 $Re_p$ is much larger than for the small bubbles, leading to stronger turbulent mixing in the flow, and a behaviour closer to single-phase flow.
Derivative of  $D_{333}$, the third-order longitudinal structure function.

Figure 9 shows  $D_{333}/D_{33}^{3/2}$ (the skewness of the longitudinal velocity increment), as well as the unnormalized form
 $D_{333}$. For the present unladen case, in the channel centre we find
 $D_{333}/D_{33}^{3/2}\approx -0.4$ for
 $r\rightarrow 0$, which is in close agreement with the value found in isotropic turbulence (Ishihara et al. Reference Ishihara, Kaneda, Yokokawa, Itakura and Uno2007; Davidson Reference Davidson2015). The Reynolds number of the channel flow is too low for there to be a clear inertial range, and therefore the unladen data for
 $D_{333}$ do not show evidence of the ‘four-fifths law’
 $D_{333}=-(4/5)\langle \epsilon \rangle r$ predicted for the inertial range of isotropic turbulence by Kolmogorov (Reference Kolmogorov1941a). For the cases involving bubbles, a first observation is that
 $D_{333}/D_{33}^{3/2}$ is positive for all cases at
 $r=O(d_p)$, and for the SmFew and SmMany cases it remains positive in the limit
 $r\to 0$, while for others it becomes negative in this limit. The data for
 $D_{333}$ indicate that the fluctuations are much larger for the bubble cases than for the unladen case, especially those with higher volume fractions, while the results for the skewness show that the bubble cases have a skewness that is either larger or smaller in magnitude than the unladen case, depending upon the case. Note that, the skewness normalizes out the amount of energy in the longitudinal component, and so gives a clearer indicator as to how the bubbles modify the behaviour of the nonlinear transfer in the flow. The SmFew case is particularly interesting, since it exhibits a very large value of the skewness for
 $r< O(d_p)$, even though this case has the smallest volume fraction
 $\alpha _b$. However, as expected, the results for
 $D_{333}$ for this case reveal that the magnitude of
 $D_{333}$ is much smaller for the SmFew case than for the other three bubble cases that have higher values of
 $\alpha _b$. This shows how sensitive certain properties of the turbulent flow are to the presence of the bubbles, even for relatively low
 $\alpha _b$. It also implies that the bubbles could have a significant effect on tracer particle dispersion in turbulent flows, whose irreversibility is intimately related to the asymmetry in the velocity increment distributions (Jucha et al. Reference Jucha, Xu, Pumir and Bodenschatz2014; Bragg, Ireland & Collins Reference Bragg, Ireland and Collins2016; Bragg Reference Bragg2017).
Third-order longitudinal structure functions: (a) skewness; (b) unnormalized. The inset in (a) shows zoomed for the cases excluding SmFew. The two vertical dashed lines in the inset of (a) and in (b) show  $r=d_p$ for smaller and larger bubbles, respectively. The horizontal line in (a) is the value of
 $0$.

The transverse structure functions  $D_{111}$ and
 $D_{222}$ were also considered for each case. The associated skewness values were found to be very close to zero for all cases (not shown here).
4.2. Fourth-order structure functions
We now consider the fourth-order structure functions to explore how the bubbles influence the intermittency of the background turbulence. In figure 10(a–c) we consider the normalized fourth-order moments (i.e. the flatness of the velocity increments) in each of the directions, denoted by  $D_{1111}/D_{11}^{2}$,
 $D_{2222}/D_{22}^{2}$ and
 $D_{3333}/D_{33}^{2}$. If the velocity increments had Gaussian probability distributions, then these quantities would be equal to three at all scales. Departures from three indicate non-Gaussianity in the velocity increment distributions, while spatial dependence of these quantities indicates that the velocity increments are not only non-Gaussian, but also intermittent (Frisch Reference Frisch1995).
Normalized fourth-order transverse (a,b) and longitudinal (c) structure functions, corresponding to the flatness of the velocity increments. The two vertical dashed lines in (c) show  $r=d_p$ for smaller and larger bubbles, respectively. The horizontal lines in (a,b,c) correspond to the Gaussian value of
 $3$ for the flatness.

For the unladen case, the results in figure 10(a–c) show that, at the large scales, the quantities are close to three, but increase as  $r$ decreases. Furthermore, the results show that the departures from Gaussianity are stronger for the transverse components than they are for the longitudinal component, also observed in isotropic turbulence (Ishihara, Gotoh & Kaneda Reference Ishihara, Gotoh and Kaneda2009). The effect of the bubbles on these quantities is non-trivial. At the very smallest scales, the bubble cases show much stronger non-Gaussianity and intermittency in the turbulent flow than for the unladen case. A similar finding was also observed in the experiment of Rensen et al. (Reference Rensen, Luther and Lohse2005) for their fully developed turbulent bubbly flow and in Biferale et al. (Reference Biferale, Perlekar, Sbragaglia and Toschi2012) when comparing the small-scale properties of boiling and non-boiling convective turbulent flows. However, with the exception of the SmFew case, the bubbles tend to suppress intermittency in the flow at scales comparable to their diameter, for the streamwise and wall-normal velocity directions. Roughly speaking, it is only at scales smaller than
 $O(d_p)$ that the flatness starts to increase significantly.
The flatness results for the SmFew case reveal much stronger non-Gaussianity and intermittency in the flow compared with the other three bubble cases that have much higher gas void fraction ( ${\approx }7$ times than SmFew). Some insight into this behaviour can be found by considering the ways in which the bubbles modify the turbulent flow. The most significant qualitative modification the bubbles make to the turbulent flow is the wakes they generate, and the flow properties in these wakes will typically be significantly different from the properties of the background turbulence. When the number of bubbles is not too large (but still large enough to make a statistically significant contribution to the flow properties), there are relatively few regions in the flow where the flow differs due to the wakes from everywhere else (i.e. these regions are ‘rare’), breaking self-similarity in the flow and enhancing intermittency compared with the case without the bubbles. As the number of bubbles increases, the regions of the flow occupied by the wakes becomes less rare, and hence their contribution to the intermittency reduces. Moreover, as the number of bubbles/size of the bubbles increases, the possibility for wake interaction increases, and this can enhance mixing in the flow, which would reduce the impact of the wakes on the flow intermittency.
A striking result implied by the results in figure 10(a–c) concerns the relationship between  $Re_H$ and the level of intermittency. For example, as shown in figure 2, the LaMany case has a much larger
 $Re_H$ than the SmFew case, yet the latter exhibits much stronger intermittency in the flow than the former. This is in contrast to single-phase turbulence where small-scale intermittency increases with increasing Reynolds number (Frisch Reference Frisch1995). This again indicates that the mechanisms generating intermittency in bubble-laden turbulent flows are significantly different from those in single-phase turbulence, and are connected to the bubble wakes, as explained previously.
Finally, we remind the reader of the point made in § 2 that the fourth-order moments might be slightly under-resolved by the DNS. Consequently, these fourth-order results should be viewed with some caution, and future work is needed to examine the resolution criteria more thoroughly.
5. Conclusions
In this paper we have analysed various properties of bubble-laden turbulent flows across the range of scales of the flow, including the anisotropy, energy transfer and intermittency in the flow.
To explore the anisotropy of the flow at different scales, we developed an extension of the BAM approach that was previously developed for analysing the one-point Reynolds-stress tensor (Banerjee et al. Reference Banerjee, Krahl, Durst and Zenger2007). In our approach, the anisotropy at any scale may be quantified and visualized, as well as providing information on the componentiality of the flow at the scale. Using this we were able to explore how the bubbles modify anisotropy in the flow. We found that the bubbles significantly enhance anisotropy at all scales compared with the unladen case, and that for some bubble cases, very strong anisotropy persists down to the smallest scales of the flow. The strongest anisotropy was observed for the cases involving small bubbles. Deviations from the behaviour that would be expected for an isotropic flow occur not only in the streamwise/gravity direction, but also in the other directions.
Concerning the energy transfer among the scales of the flow, the DNS data did not allow us to thoroughly explore this, but we were able to consider a number of its important aspects. Our results indicate that for the bubble-laden cases, the energy transfer is from large to small scales, just as for the unladen case. However, there is evidence of an upscale transfer when considering the transfer of energy of particular components of the velocity field, rather than the full kinetic energy involving all three components of the flow. Similar findings were also reported in Lai et al. (Reference Lai, Fraga, Chan and Dodd2018) where the energy cascade in bubbly flows was shown to be highly anisotropic. We also conjectured, however, that in a bubble-laden channel flow at sufficiently high Reynolds number, and with channel height sufficiently large compared with the bubble size, there may exists an upscale transfer of energy at scales much larger than the bubble diameter. Our DNS does not lie in the parameter range required to observe such behaviour.
We also considered the normalized form of the fourth-order structure functions, corresponding to the flatness of the fluid velocity increments. These results revealed that the introduction of bubbles into the flow strongly enhances the intermittency of the turbulence in the dissipation range, but suppresses it at scales comparable to the bubble diameter. The SmFew case, however, shows enhancements of intermittency at all scales. We interpreted the effect of the bubbles on the flow intermittency in terms of the contributions of the bubble wakes to the overall properties of the turbulence. This strong enhancement of the dissipation-scale intermittency has significant implications for understanding how the bubbles might modify the mixing properties of turbulent flows, and the associated large velocity gradients. These will be the subject of future investigations.
Acknowledgements
The authors would like to acknowledge M. Iovieno for providing some of his DNS data to validate the code used in the present study. T.M. benefited from discussions on this topic with P. Brugger, M. Carbone. The authors would also like to thank the anonymous referees, whose thoughtful comments and questions improved the paper.
Funding
T.M. acknowledges funding by Deutsche Forschungsgemeinschaft (DFG, German Research Foundation) under Grants MA 8408/1-1 and MA 8408/2-1. J.F. and B.O. benefited from Grant JF 284002692.
Declaration of interests
The authors report no conflict of interest.


 Open access

