

1. Introduction
Following the ‘Black Death’ in in the mid-fourteenth century, early modern London endured a series of plague epidemics; the most visible being in the years 1563, 1593, 1603, 1625 and 1665.Footnote 1 London parish records of christenings, marriages and burials, together with surviving Bills of Mortality, provide opportunities for epidemiological study over this period. Several authors have already used them as datasets to explore the social structure of the metropolis and the way in which plague spread between the London parishes.Footnote 2 Although individual parish records vary greatly in terms of the information recorded, they have been found to contain accurate nominal lists of baptisms, marriages and burials before 1653.Footnote 3 Many studies have used data from several parishes to consider the impact of plague at the level of the metropolis but here we focus on a single parish, namely St Peter upon Cornhill, to investigate how plague exerted its effect at the level of household and, in turn, how the epidemic was shaped by social structure.
The St Peter upon Cornhill parish records lend themselves well to this type of investigation for two reasons. Firstly, it is one of only three from the old City of London to record the age at death in its burial records for an extended period; the others being All Hallows-on-the-Wall and St Botolph-without-Bishopsgate.Footnote 4 Secondly, it contains a range of useful information including the names of the deceased, the identity and occupation of heads of household, the occupations of deceased adults, and a precise record of where the deceased were actually buried. For example, an entry dated 16 October 1601 states:
Buried this day being Friday Annes Willis wif of Richard Willis Grocer, an honest painfull woman, of 46 years, in the south ile. The same day Buryed Jeames Rowley, servant to Samson Lecroft Armorer: 28 years old, his pit in the East Church Yard.
M. F. and T. H. Hollingworth examined a portion of the St Botolph dataset from 1580 to 1605 inclusive, with an emphasis on the plague of 1603.Footnote 5 Even though the information recorded by the parish clerks of St Botolph seldom exceeded the name and age of the deceased, these authors found that more men than women died in plague years and that children were particularly hard hit compared to adults. Later, Roger Finlay conducted a wider investigation of a selection of London parishes, which included St Botolph and St Peter upon Cornhill.Footnote 6 He confirmed that children generally seemed to be harder hit than adults but found that the relative proportion of male to female burials varied between parishes and that, although men might have been over-represented in the plague year of 1603, the same could not be said of 1593 or 1625. Another interesting observation made by Finlay, which begs further investigation, was that ‘the most curious feature about plague in St. Peter Cornhill was the effect it had on the 10–19 age group’, going on to speculate that ‘many … would have been servants or apprentices who had recently migrated to London and … may have been as susceptible as much younger children’. Nevertheless, J. A. I. Champion, writing on the plague of 1665, could not detect a disproportionate mortality of children and so the relative vulnerability of children may not have been universal for all London epidemics spanning the mid-sixteenth to mid-seventeenth centuries.Footnote 7 Earlier epidemics from the Black Death of 1348/9 onwards exhibit a similar variation. For instance, the ‘Second Pestilence’ of 1361 was said by some chroniclers to have disproportionally affected children and killed more men than women.Footnote 8
Similar observations were made by chroniclers of subsequent, lesser epidemics and there is some empirical evidence to support them.Footnote 9 In contrast, S. N. DeWitte examined skeletal remains present in the East Smithfield Black Death cemetery in London and found that the risk of mortality in London appeared to increase with adult age but that females did appear to be less susceptible than males, who may have been more sensitive to pre-existing health conditions.Footnote 10
The first aim of this article is to re-examine age and sex as factors moderating the vulnerability of individuals to plague in the mid-sixteenth to mid-seventeenth centuries and explore the extent to which servants, as a group, contributed to the mortality. In doing so it expands upon the work of the Hollingworths and Finlay by taking advantage of the additional information on age at death and occupation available in the parish records of St Peter upon Cornhill.
The second aim is to determine if the disease clustered within households and families or if it spread in a more uniform manner throughout the parish, since we might expect an infectious disease to be communicated more easily between members of the same household than between members of different households. One important component of this investigation will be to estimate the number and composition of households present over the period under investigation and thus, if possible, obtain some estimate of the proportion of households affected.Footnote 11
Clustering of burials within family groups has been a feature of the well-documented plague epidemics in the seventeenth-century English villages of ColytonFootnote 12 and EyamFootnote 13 as well as fifteenth- and sixteenth-century Milan and in the Italian town of Nonantola in 1630.Footnote 14 It is also interesting to note that a recent study of the medieval Eyam epidemic, using improved data and new mathematical techniques, suggests that both rodent-to-human and human-to-human transmission played an important role in spreading the plague and that they accounted, respectively, for a quarter and three quarters of all infections in that village.Footnote 15 It is also the case that several researchers have emphasised the apparent infectiousness of plague in early modern epidemics.Footnote 16 However, little attention has been directed towards clustering in London plagues and so here we look for similar patterns of spread throughout the metropolis in the late sixteenth and early seventeenth centuries. This aspect of our study is drawn by necessity to the identity of the pathogen concerned because we shall need to reconcile our findings, if possible, with the most recent understanding of how this disease propagates itself.
2. The identity of the pathogen responsible for historical and modern plague epidemics
In the past, many historians and biologists assumed that all three global pandemics were caused by the bacterial pathogen Yersinia pestis but others took a different view arguing that the differences in symptomology and epidemiology between the three pandemics rendered this explanation improbable. The resulting dispute, extending as it did for several decades, is well documented.Footnote 17 However, this controversy now seems to have been resolved by recent developments in molecular archaeology and a plethora of studies, undertaken by several independent laboratories, examining skeletal material in large number of plague burial sites throughout Europe. These studies have driven the emergence of a consensus that the aetiological agent for all three pandemics was, indeed, most likely Y. pestis.Footnote 18 In fact, researchers have now moved on from simply detecting fragments of microbial DNA to describing the entire genome of Y. pestis in ancient skeletal material, and results obtained from various sites in Europe indicate that the ‘Black Death’ and subsequent plague outbreaks in medieval Europe were caused by the same Y. pestis lineage.Footnote 19 Of most relevance to this article, skeletal material from the Smithfield Market burial pits, securely dated to the Black Death of 1348–1350, as well as material from the New Churchyard burial pits dated to the turn of the sixteenth century, which is consistent with the documented use of this burial site in 1603 and 1625, also contain DNA fragments peculiar to this pathogen.Footnote 20
Possibly due to the results of such work, the debate has acquired a different theme; for even if this pathogen was the aetiological agent of early modern plague epidemics, it is not at all clear how it did this, given that its behaviour then, and for centuries afterwards, appeared to vary greatly in terms of its epidemiology and symptomology.Footnote 21 This variation is, however, less of a surprise than one might imagine since the protean nature of plague epidemics is also a well-attested feature of the modern third plague pandemic.Footnote 22 For example, yersinial plague appears in at least two main forms, which are distinguished by the mode of infection. Bubonic plague in humans is typically the result of a bite from an arthropod vector, such as the flea Xenopsylla cheopis, which has been previously infected by feeding on a mammalian vector such as the Black Rat (Rattus rattus). This form of plague typically manifests itself in the form of swellings of the lymphatic glands known as buboes. Pneumonic plague, on the other hand, is a highly fulminant form of the disease, which can arise by introduction of the bacterium directly into the lungs. Generally, it appears as a highly virulent form of pneumonia and death occurs before the development of buboes or peculiar symptoms that might distinguish it from any other severe bacterial infection. Secondary pneumonic plague is said to develop in cases of bubonic plague where the infection spreads to the lung. Primary pneumonic plague is said to be the result of transmission via respiratory droplets from one human to another although the index case in a series may sometimes be the result of handling dead infected animals or companion animals such as cats and dogs.Footnote 23
The Plague Commission, operating in the Indian sub-continent in the early twentieth century, found that the vast majority of cases in this theatre, at that time, were of the bubonic type and such cases were not infectious to other humans since relatively few cases progressed to secondary pneumonic plague.Footnote 24 On the other hand, the Report of the International Plague Conference of 1911 in Mukden, Manchuria, described an epidemic causing the death of more than 50,000 individuals, which was almost exclusively pneumonic being clearly infectious and not needing the presence of an arthropod vector.Footnote 25 Other epidemics involving both bubonic and pneumonic cases occurring simultaneously have also been described.Footnote 26 It is clear, therefore, that the pathogen Y. pestis can cause modern epidemics that differ greatly in terms of infectiousness between people as well as in the actual manifestation of the disease.
3. The parish and register of St Peter upon Cornhill
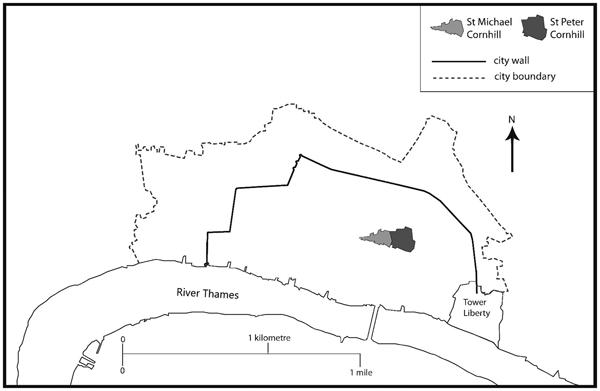
The church and parish of St Peter upon Cornhill lies centrally within the old city walls (Figure 1). The original church building was destroyed in the Great fire of London in 1666 but was later rebuilt to the designs of Sir Christopher Wren. The parish and church are briefly described in a contemporaneous note within John Stow's 1598 Survey of London.Footnote 27 Stow maintained that the church was of ancient origin stating that it
seemeth to be of an ancient building, but not so ancient as fame reporteth, for it hath been lately repayred, if not all new builded, except the steeple, which is ancient: … there remayneth in this Church a table wherein it is written, I know not by what authority, but of a late hand, that king Lucius founded the same church to be an Archbishops sea Metropolitane, & chief church of his kingdom, & that it so endured the space of 400 years, vnto the coming of Augustin the Monk.
The location of the Cornhill Ward within the Walls of The City of London. The darker shaded area is the parish of St Peter and the lighter area the parish of St Michael.

He goes on to say that the parish church of St Peter upon Cornhill was ‘occupied by a schoolmaster and his usher, over a number of scholars learning their grammer rules’. He also notes that within the parish were ‘divers fair houses for merchants and other among which one large house is called the Wey house where merchandises brought from beyond the seas are to be weighed at the kings beam’ and the Royal Exchange, which was built as ‘a burse, or place for merchants to assemble’, emphasised the parish's association with commerce.
The St Peter upon Cornhill parish registers were transcribed for publication on behalf of the Harleian Society in 1878 and this document provides the dataset used in this study.Footnote 28 The earlier years of the original burial register are attributable to William Averill, the parish clerk, and are believed to include a version of an earlier document that is now lost to us. The burial records begin in the year 1558 and includes entries from the year 1583 up to the year 1605, which is the period under study in this article. It is recorded therein that Averill was married on 2 November 1578, to Gillian, daughter of Robert Goodale, and together they had 17, or more, children. The baptisms of 16 of them are recorded in this register. Gillian was buried on 20 February 1595 and the entry tells us that ‘shee died of her 17th child’.Footnote 29 William was a member of the Merchant Taylors’ and Vintners’ Company and appeared to be a Greek and Latin scholar as attested by the numerous entries in those languages that appear in the margin of the Register. He also seems to have been the principal of the grammar school mentioned by Stow and wrote brief eulogies when recording the death of some of his pupils. In the case of St Peter upon Cornhill, the end of the practice of recording ages at death seems to coincide more-or-less with the date of William Averell's death in 1605.
The St Peter upon Cornhill burial records, with few exceptions, generally do not record where victims lived so that it is not possible to link clusters of deaths with specific locations within the parish. Nevertheless, it is possible to identify households or family groupings from the information provided since entries typically give the first and second names of the victim and then the relationship to the head of the household (for example, ‘son of’, ‘daughter of’, ‘wife of’ or ‘servant to’). The first and second names and occupation of the head of the household (almost exclusively male save for some females identified as ‘widows’) are also given. In this way it is also possible to identify servants and lodgers associated with a family group. However, this method does not identify family members who may have survived an attack of plague and neither can it identify the number of family members who were at risk by being present within the parish at the time of the epidemic since there is, unfortunately, no contemporaneous census. We therefore need to move forward to the ‘Settlement of Tithes 1638’ before we can begin get some idea of the number of households likely to have been dwelling in the parish of St Peter upon Cornhill in the early modern period.Footnote 30
4. Estimating the population size and structure of the parish of St Peter upon Cornhill
It appears that the clergy of London had sustained a longstanding grievance in that they believed that they did not receive as much tithe as they were entitled to be paid by law. They were eventually directed to carry out a survey in the reign of Charles I, which listed every householder, together with the discounted rentable value of each house. This has now become a valuable source for demographic study despite the apparent lack of uniformity in returns compiled by different assessors, the possibility that poorer households were not investigated thoroughly due to their perceived lack of wherewithal and that some ‘informal’ households may have been excluded from the survey altogether.Footnote 31 At this time, London was subject to considerable pressure to accommodate inward migration and this facilitated a tendency towards the sharing of divided houses by families and the construction of poor quality housing for ‘the lesser sort’. Nevertheless, in 1637, the Cornhill Ward was relatively wealthy and exhibited a low incidence of divided houses and non-family inmates.Footnote 32 For the purpose of this study we use the Settlement of Tithes only to estimate the number of households in St Peter upon Cornhill and it is not our intention to comment on the wider demographical issues that are better dealt with elsewhere. From this listing, it is possible to identify 123 households and 6 tenements in St Peter upon Cornhill. The definition of ‘tenement’ remains unclear but, presumably, refers to larger houses sub-divided to provide a number of low-rental dwellings.Footnote 33 It is acknowledged that the survey of 1638 occurred more than three decades after the epidemics of 1593 and 1603 so the extent to which the demographics it revealed then are relevant to earlier periods is uncertain. However, the number of households present in 1593 or 1603 is hardly likely to have been greater than that of 1638 so it seems reasonable to accept a figure of 123–9 households as an upper limit.
Another way of approaching this problem might be to work on the assumption that the number of live births in a parish is proportional to the population size. However, for both parish and metropolis, the population size is unknown so that even if the number of births is known, the birth rate must necessarily be a conjecture. Also, working at the level of a single parish involves much smaller numbers than those generated when working at the level of metropolis, thus the possibility of error is greater. A method commonly used by other scholars in this field is to apply a range of plausible estimates for the birth rate based on annual baptisms and so in keeping with these other studies, we use birth rates of 30 and 35 per thousand.Footnote 34 For the period 1580–1610 inclusive, the average number of births (recorded baptisms) per annum in the parish of St Peter upon Cornhill was 24.26. Thus, assuming birth rates of 30 and 35 per thousand, a rough estimate of the parish population would be between 693 and 809. The estimated population may also provide an indication of the number of households present in St Peter upon Cornhill on, say, the eve of 1603 if the mean size of households is known. Based on the marriage tax assessment of 1695, P. E. Jones and J. V. Judges arrived at the figure of 6.1 souls per household for parishes within the walls.Footnote 35 Assuming that this figure is also applicable to the earlier date we may estimate there to have been roughly between 113 and 133 households within the parish of St Peter upon Cornhill. This is similar to the actual number recorded in 1638 and seems quite plausible given that there is no noticeable increase in the number of baptisms per annum in this parish over the period 1580–1630 and there is decrease after 1635.Footnote 36 Nevertheless, an analysis of the marriage tax assessment of 1695 also indicates considerable heterogeneity in the make up of families and households so it should not necessarily be assumed that these patterns exactly replicate those in 1603.Footnote 37 It is also the case that some households consist of one person only and, based on a study of 91 communities from 1564–1821, Peter Laslett suggested that this might amount to 6 per cent of the total.Footnote 38 A bespoke sampling methodology for identifying household groups present on the eve of the 1603 epidemic is presented later in this article and the number of such groups detected by this sampling method can be compared with the estimates calculated above.
5. Baptisms, deaths and marriages from 1580 to 1605
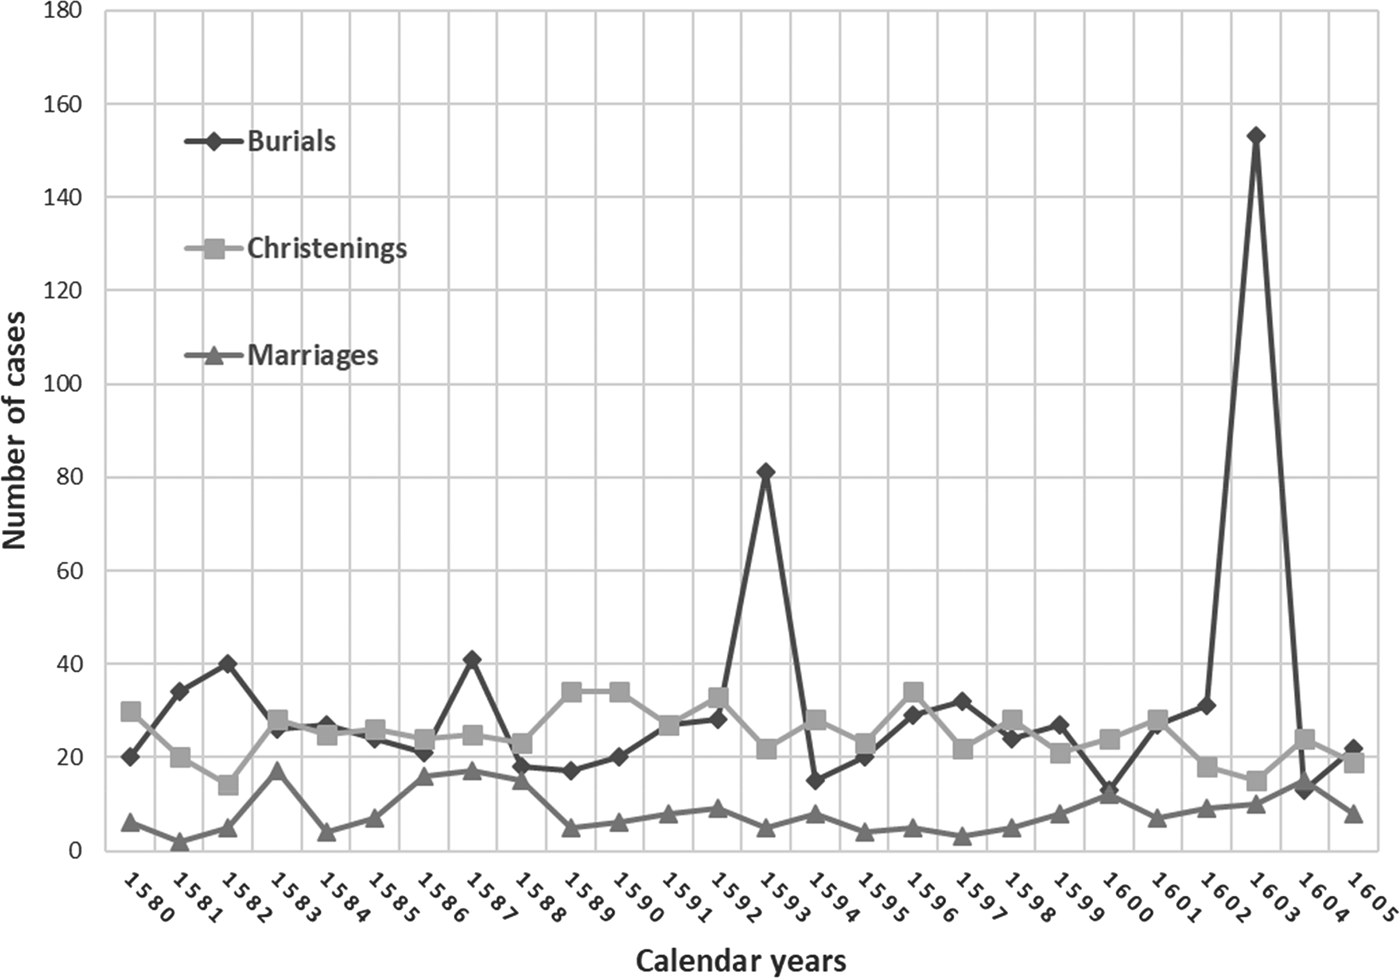
As a starting point, the baptisms, burials and marriages in the parish between the years 1580 and 1605 inclusive are presented in Figure 2, which illustrates the sharp increases in burials recorded for the plague years 1593 and 1603. Over this period the registers recorded a total of 216 marriages, 649 baptisms and 830 burials. If the plague year burials and baptisms are stripped out, we are left with a total of 612 baptisms and 596 burials, suggesting that the overall excess of burials over baptisms may have been largely the result of the mortality in plague years. Also, the overall difference between burials and baptisms, including those in plague years, implies a reduction in population over this period but it is interesting to note that there is no obvious upward or downward trend in recorded baptisms during this period.Footnote 39 Thus, the population at risk seems to have remained fairly constant as, presumably, the parish maintained a capacity to regenerate itself by absorbing newcomers, preserving the existing breeding stock in some way, or both.Footnote 40 It is generally held that the population of London doubled between 1550 and 1700 but that the greatest growth rates were to be found in the Out-Parishes and least in the old-established central parishes such as St Peter upon Cornhill.Footnote 41
Burials, christenings and marriages: St Peter upon Cornhill (1580–1605).

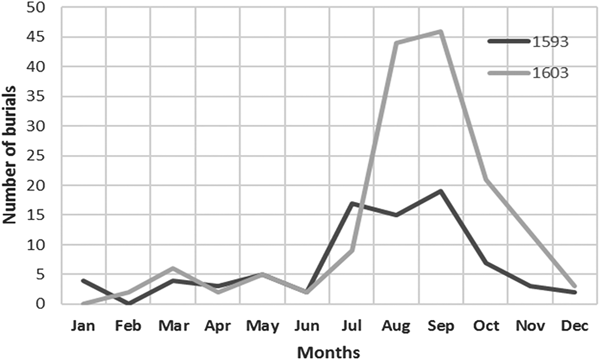
Figure 3 illustrates the frequency of burials in each calendar month for both 1593 and 1603 showing that in both years, the epidemic started in July and peaked in September before falling away as winter approached. Remarkably, the St Peter upon Cornhill records do not attribute any individual deaths to ‘plague’ in the plague year of 1603 and, in fact, the cause of death (‘consumption’) was only recorded in one instance. Presumably, cause of death was recorded elsewhere because it was mandatory for parishes to produce such statistics. Nevertheless, the total count for the year was inserted at the end of December 1603 thus:
From the 23 of December 1602 to the 22 December 1603 buried in this parish in
all; num: 158
Of them of the plague 87
Buried in all this yeare both without and w'in the liberties; and in the 8 out parishes
from the 14th of Julie 38244
Of them the plague: 30578
Frequency of burials, per calendar month for the years 1593 and 1603.

This contrasts with the adjacent parish of St Michael's where, throughout 1603, 87 of 147 burials were attributed to ‘plague’ in the parish records thus highlighting the idiosyncratic approach of individual parish clerks. It is also interesting to note that, almost without exception, the location of each burial is given as being within the church building of St Peter upon Cornhill itself, or its adjacent burial grounds, and this is as true for the plague years of 1593 and 1603 as it is for the intervening years.Footnote 42 This observation does not eliminate entirely the possibility that some burials might have taken place elsewhere and so went unrecorded, but there is no evidence to suggest that there was a need to consider the use of municipal plague pits since parish officials commonly sought to try and fit in as many burials as possible at this time.Footnote 43
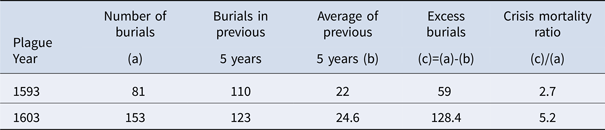
One approach to the problem of estimating plague deaths (without reference to diagnoses which may, or may not, be recorded) is to compare the total burials in a plague year with the average number of burials in non-plague years to calculate a ‘crisis mortality ratio’.Footnote 44 In our study, we have taken the average of the preceding five-year periods to compare with the plague years of 1593 and 1603 since there is no evidence of an unusual pattern of mortality in the years immediately preceding them. The results are given in Table 1 and are comparable to those calculated by Finlay, although he did not include the year immediately prior to plague years in his calculations.Footnote 45 The crisis mortality ratios, thus calculated, seem to indicate that plague had a greater impact on mortality in 1603 than 1593.
Overall mortality crisis ratios for 1593 and 1603 in the parish of St Peter upon Cornhill

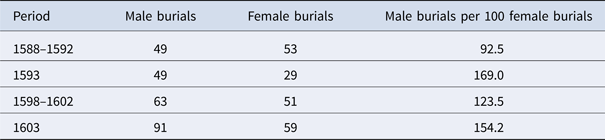
The number of male burials was compared to that of female burials by first counting the frequency of burials by sex over the five years immediately prior to a plague year and then calculating the ratio of male to female burials. The frequency of burial by sex was also recorded in the plague years 1593 and 1603 and similar ratios calculated.Footnote 46 The results are tabulated in Table 2, which suggests that there was an excess of males over females buried in 1593 compared with the previous five-year period when there was a slight excess of female burials. A similar excess of males was found in the plague year 1603 although there was also an excess, albeit smaller, of males in the previous five-year period. The frequency data table was submitted to a Chi2 test, but no significant difference was found between groups (Chi2 = 5.365; p = 0.147). Thus, we cannot reject the null hypothesis that these sex differences are simply the product of stochastic fluctuations.
The ratio of male to female burials for the plague years 1593 and 1603 and for the five-year periods immediately preceding them

6. Crisis ratios by age and social grouping
To make further progress, it would be useful to know the age structure and sex ratio of the population at risk as well as its size but, in the absence of a detailed census, this information is unavailable. One technique used to circumvent this problem is to consider the mortality rates of different cohorts with reference to the model life tables proposed by A. J. Coale and P. Demeney and using this approach, Finlay made some progress in the construction of mortality rate tables for London parishes over time periods of 50 years or more.Footnote 47 Nevertheless, Coale and Demeney themselves point out there are several provisos when relating schedules of mortality to the regions upon which they are based, stating that ‘Any extraordinary incidence of a cause of death that is highly age-and-sex specific produces a mortality schedule that naturally does not conform to the model tables’ and they offer outbreaks of infectious diseases as examples. Another difficulty to be overcome is that there is evidence of migratory behaviour in this, and other London parishes, which may not be replicated on a wider scale in a model population. For instance, it seems that it was common practice for women in the wealthier London parishes to send their newborn children to parishes outside the metropolis to be wet nursed.Footnote 48 Certainly, Roger Finlay found that the short intervals between successive births to mothers in parishes such as St Peter upon Cornhill were strongly indicative of this behaviour.Footnote 49 Another behaviour commonly reported was flight by the wealthier classes who sought to escape the epidemic. Such behaviour can reduce the population at risk and/or alter the relative proportions of the different age groups present at the time of the epidemic and thus compromise the calculation of differential mortality rates. Undoubtedly, Finlay's method has its merits but, as explained above, it is not without its weaknesses and so it has not been pursued here. Instead, we seek to compare the effects of plague on the frequency of burial of different age groups between plague and non-plague years using the dates and ages given in the parish records. This method stands or falls depending on the accuracy of the burial records, but both the Hollingworths and Roger Finlay found that the accuracy of the age given, when compared to the age calculated by subtracting the date of birth recorded from the date of death, was good – especially for young children. The recorded ages of older individuals were less convincing since there was some evidence of ‘age-heaping’ as older ages were usually given in round figures.Footnote 50 In this respect, many of the adults living in parishes such as St Peter upon Cornhill were inward migrants so there was no recorded birth date available for reference and calculation. Also, some may not have known their own ages while, in other cases, surviving companions might only offer an estimate. Nevertheless, since this study seeks to compare death rates for different ages between different years, it seems reasonable to assume that the same clerical errors would occur in each of the years considered and thus the comparison between them is not subject to bias on this variable.
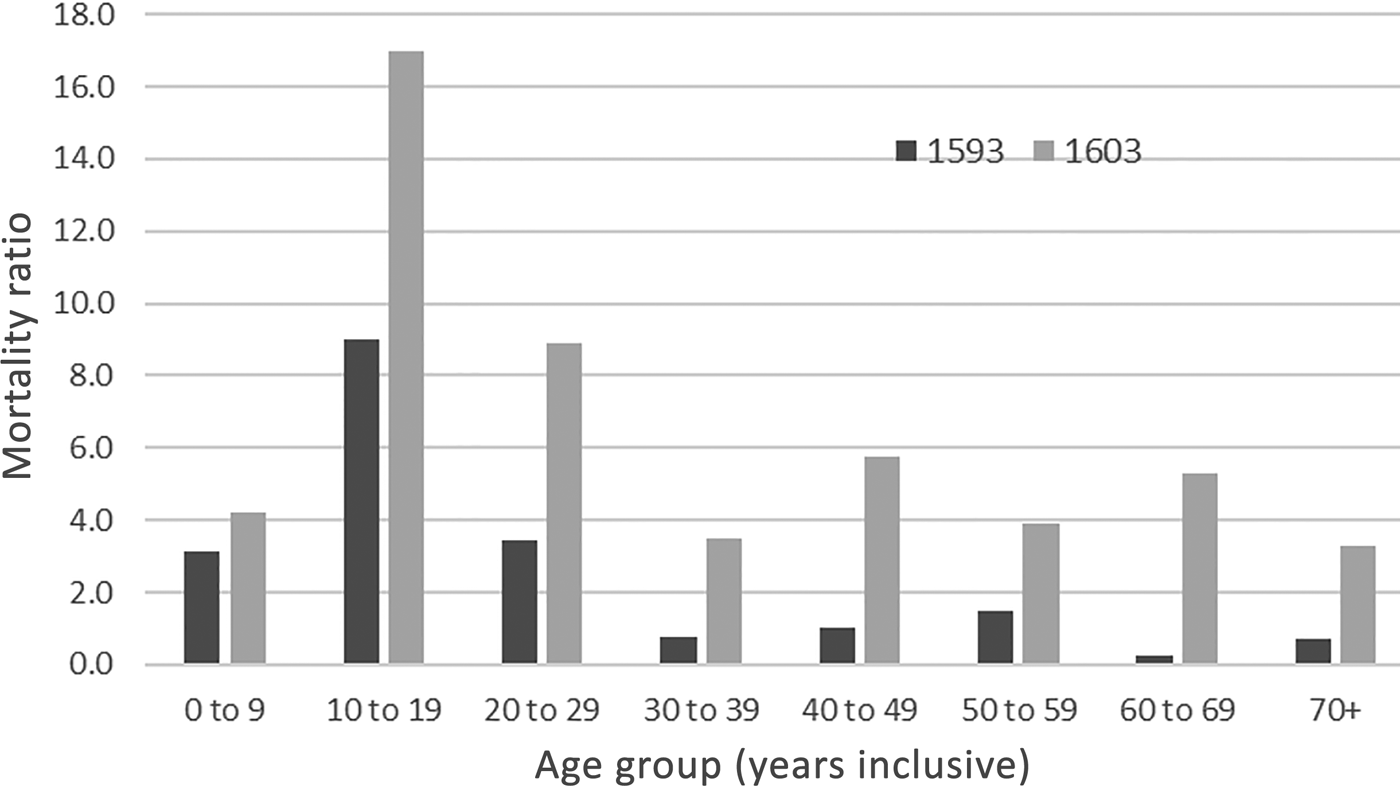
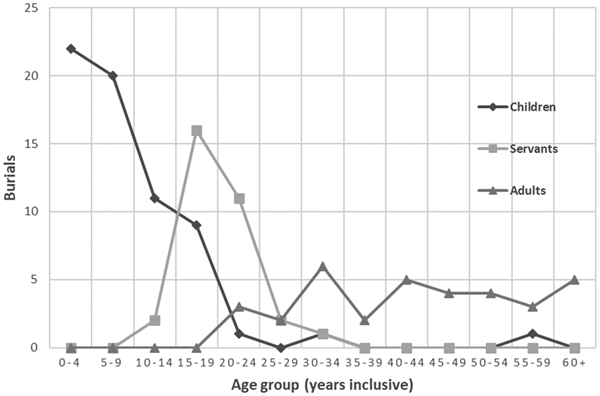
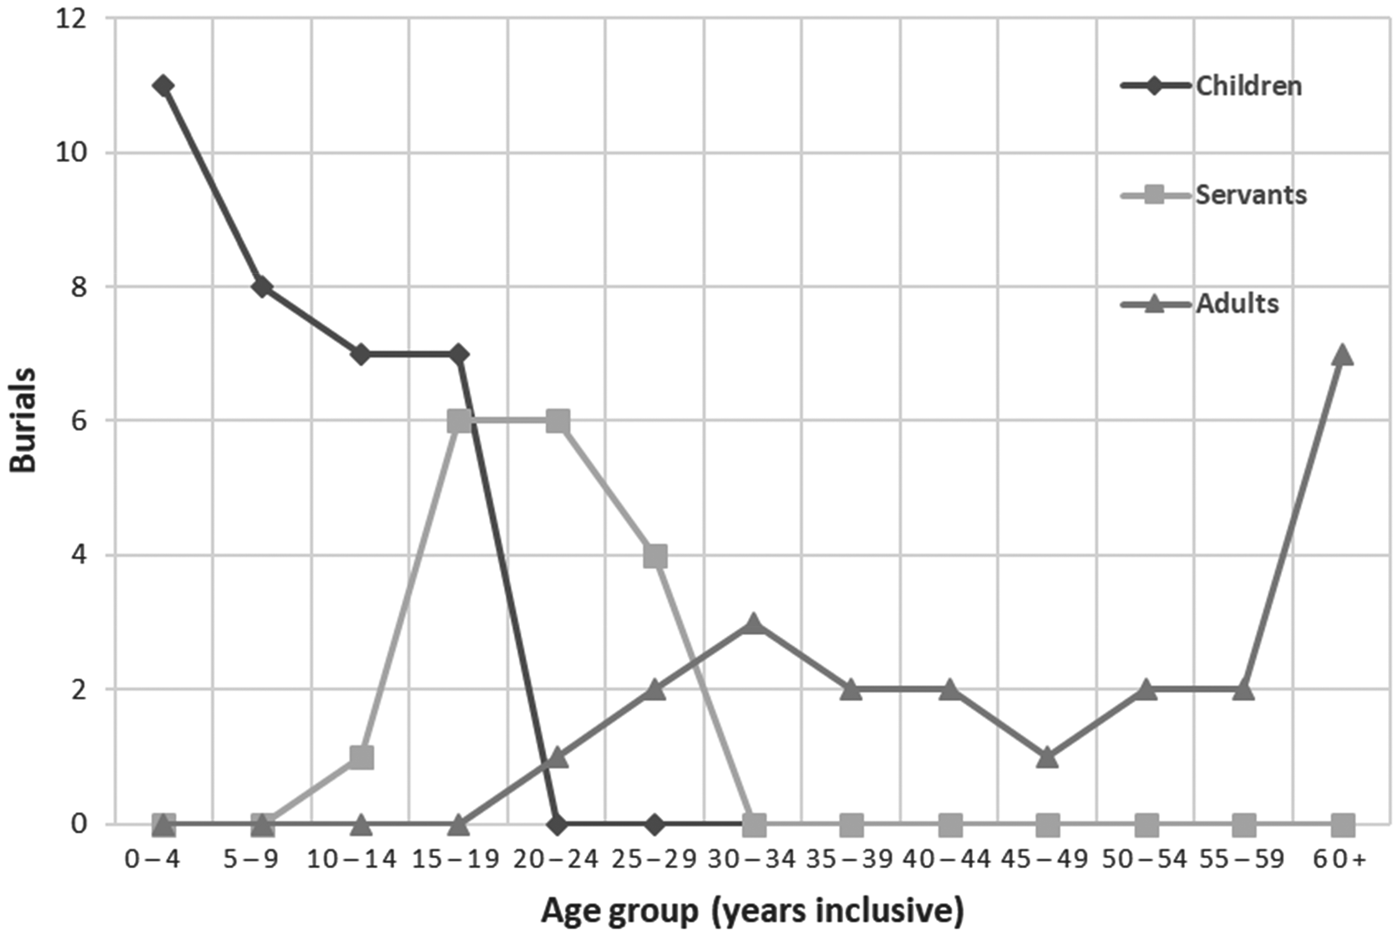
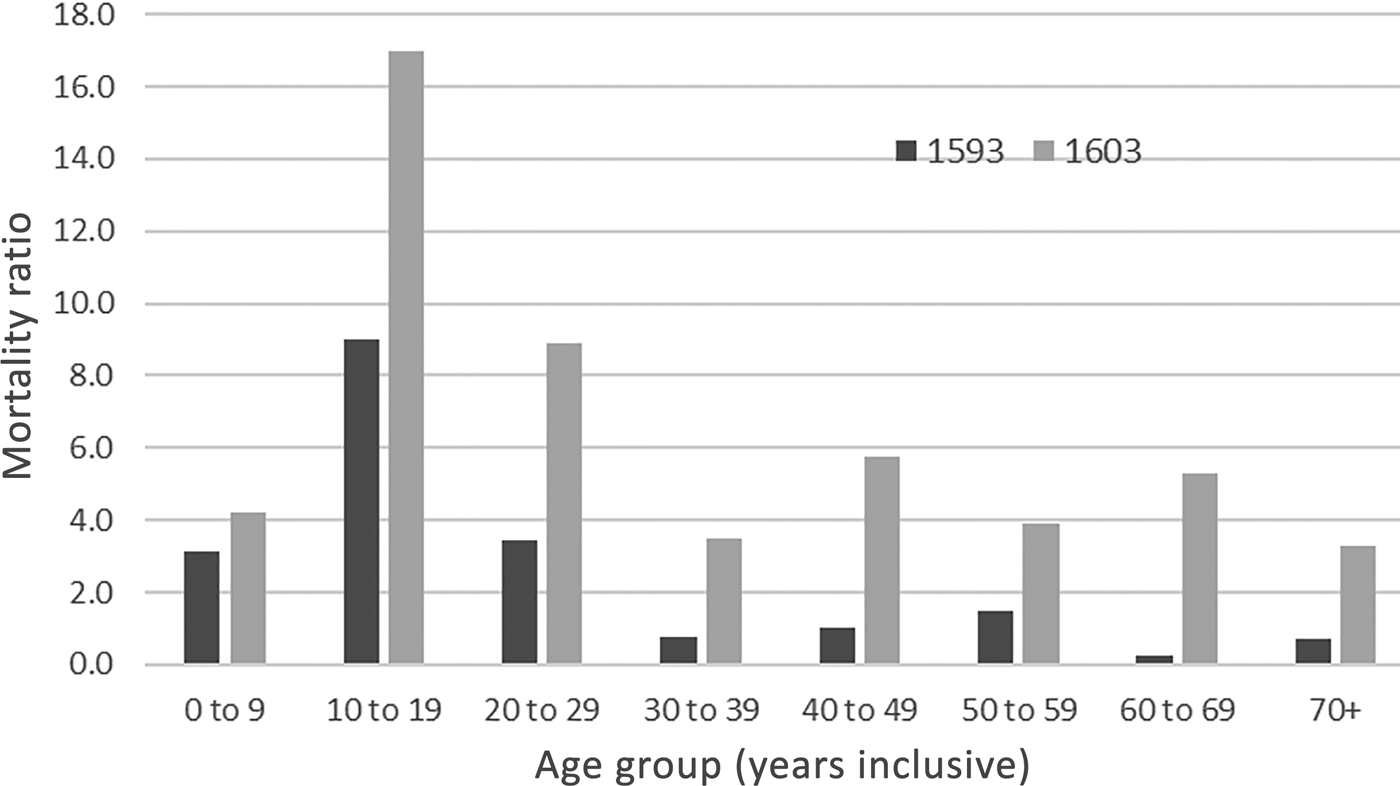
Another problem to consider might be the under-reporting of burials, especially those of poorer people, but this parish seems to have been liberal in its approach and what evidence there is seems to suggest that burials in the parish were not confined to permanent residents, nor did it appear to exclude those lacking ‘respectability’. For example, an entry dated 1 November 1601 states: ‘Sunday buried a Wench found dead in the Cage at Leden Haull not known how she came thether, in the East Yard.’ The crisis ratios for 1593 and 1603 were therefore recalculated using the same method used to calculate the overall crisis ratios presented in Table 1 but the data were first sub-divided to allow ratios, pertaining to different age groups, to be displayed. The results are presented in Figure 4. Overall it can be seen that crisis mortality ratios were higher in 1603 compared to 1593 but that there were also substantial differences according to age. The highest ratios were to be seen in the age groups 10–19 years and 20–29 years inclusive and lower ratios were associated with older age groups. Thus, it does seem to be the case that younger inhabitants were harder hit than older residents. This finding was examined further by looking at the frequency of burials for different social groups by age. The social groups selected were ‘children’, ‘servants’ and ‘adults’. Children were identified from the text as ‘son of’ or ‘daughter of’ the head of household.Footnote 51 Servants were identified by the labels ‘servant’, ‘maid’, ‘his man’ or ‘wench’ again with reference to the head of household. It is apparent that in every single case recorded in 1593 or 1603 the ‘servant’ had a different surname to that of the head of household indicating that servants were not close relatives and so were most likely immigrants to the parish although we cannot exclude the possibility that some were relatives of the mistress of the household.Footnote 52 The category ‘adults’ included men with a recorded occupation, wives and widows. These categories together accounted for the 87.6 per cent of the entries in 1603 burial register. The results are presented in Figure 5 and show that the age groups 15–19 and 20–24 were dominated by the burial of ‘servants’. Thus, the high crisis mortality ratios for age groups 15–19 and 20–24 as presented in Figure 3 seem to have been largely due to the high number of burials of servants. In contrast, adult burials were spread over a wide range of age groups. The same exercise was carried out for the plague year 1593 with similar results, as presented in Figure 6. In 1603, the burials of 31 servants were recorded of which 23 were male but only 8 were female. However, this apparent difference was not as marked in 1593 when the burials of 10 male and 7 female servants were recorded.
Crisis mortality ratios by age for the plague years 1593 and 1603.
The frequency of burials of children, servants and adults by age group in the plague year 1603.

The frequency of burials of children, servants and adults by age group in the plague year 1593.

7. Temporal clustering of burials
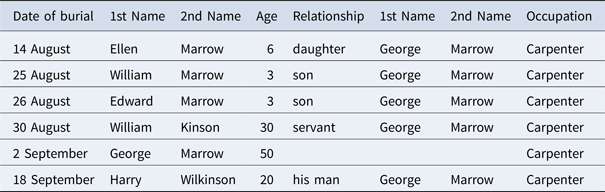
In this phase of our investigation we seek to determine if the disease clustered within households and families or if it ‘spread’ in a more uniform manner throughout the parish. As mentioned earlier in this article, the St Peter upon Cornhill burial records permit the identification of households or family groupings from the information provided since entries typically give the first and second names of the victim and then the relationship to the head of the household (for example, ‘son of’, ‘daughter of’, ‘wife of’ or ‘servant to’). Nevertheless, the possibility of using the method of ‘family reconstitution’ was first explored as it seemed to hold out the prospect of identifying family members who were present but did not appear in the burial records in the relevant plague years. Originally developed by Michel Fleury and Louis Henry, the technique of family reconstitution was adapted for the study of mortality at the parish level by Tony Wrigley and the Cambridge Group for the History of Population and Social Structure.Footnote 53 This method involves linking marriage, baptism and burial register entries to construct (ideally) a demographic profile of the (biological) nuclear family and it has been used effectively when investigating plague epidemics in the English villages of Eyam and Colyton.Footnote 54 However, while these villages were never totally isolated, there is no evidence to suggest that they were subject to the same level of inward and outward migration commonly experienced by inner London parishes. Gill Newton explained the problems in some detail, pointing out that in sixteenth- and seventeenth-century London, marriages frequently took place outside the home parish of either party and many burials of children are missed thus altering the number of children who appear to have survived.Footnote 55 It is also pertinent to note that Finlay did, in fact, complete a family reconstitution exercise for St Peter upon Cornhill to compare with the 1638 Settlement of Tithes listing but only succeeded in linking 67 per cent (83) households identified by reconstitution with those so listed in the Settlement of Tithes. Finlay explained that two very different kinds of data are being compared and that if a certain proportion of couples were childless they would not have appeared in family reconstitution forms.Footnote 56 Steven Ruggles also considered the effects of migration but came to the conclusion that family reconstitutions ‘should be seen for what they are: studies of a small sub-group of a population, which may or may not resemble the population as a whole’.Footnote 57 A complete family reconstitution was therefore not attempted but, since it is possible to identify burials of members from the same family group with some certainty, some progress can be made. For example, the series of records in the year 1603 relating to the family of George Marrow, a carpenter, is presented in Table 3.
Burials of members of the George Marrow family in 1603

In each case, the individual record is connected to George Marrow as head of household and his identity is confirmed by the listing of his occupation. The relationship of the deceased to the head of household is also given unambiguously.Footnote 58 This level of detail was consistent throughout 1603 and because it was also the most substantial epidemic within the period studied, a further investigation of this plague year was carried out.
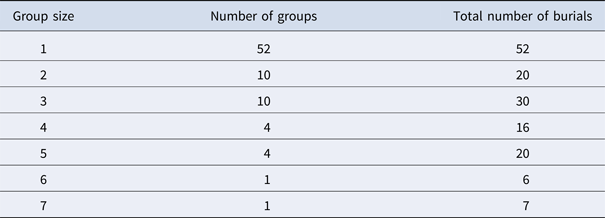
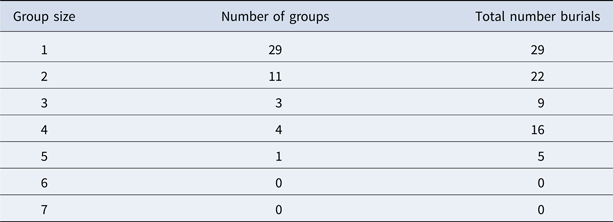
Of the 153 burials recorded in 1603, 52 (40 per cent) could not be linked with the burial of another family member or someone living within the same household. The remaining 101 burials (60 per cent) could each be linked with the burial of at least one other family member or someone living within the same household. These data are presented in Table 4 in more detail, which shows, for instance, that there were ten groups where a burial was linked to at least one other from the same household group, ten groups where three burials could be linked, four groups where four burials could be linked, etc.
Number of burials per household group size in 1603

Note: A household includes family members together with their servants or lodgers but only the burials are counted.
Since the date of each burial was recorded, the possibility that each cluster contained burials that were temporally associated could be investigated. Temporal clustering is indicative of diseases that are communicable or of single events that can precipitate disease in several individuals. However, the possibility that temporal clustering was a function of burial practices, that is, that burials might be lumped together on one or more days for convenience, needed to be eliminated. This notion required investigation because the records show that baptisms in St Peter upon Cornhill tended to be held over to Sundays, unless there was a danger that a newborn child might die before baptism could be arranged. Possibly, a similar process might apply to burials. Table 5 details the number of burials carried out on each day of the week throughout 1603 and confirms that there is no evidence of burial consolidation.
Number of burials recorded on each day of the week throughout 1603

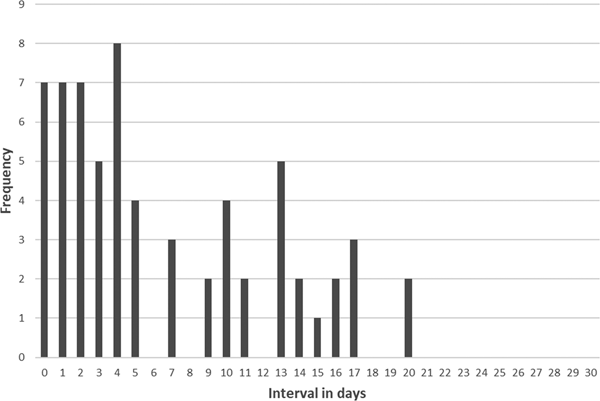
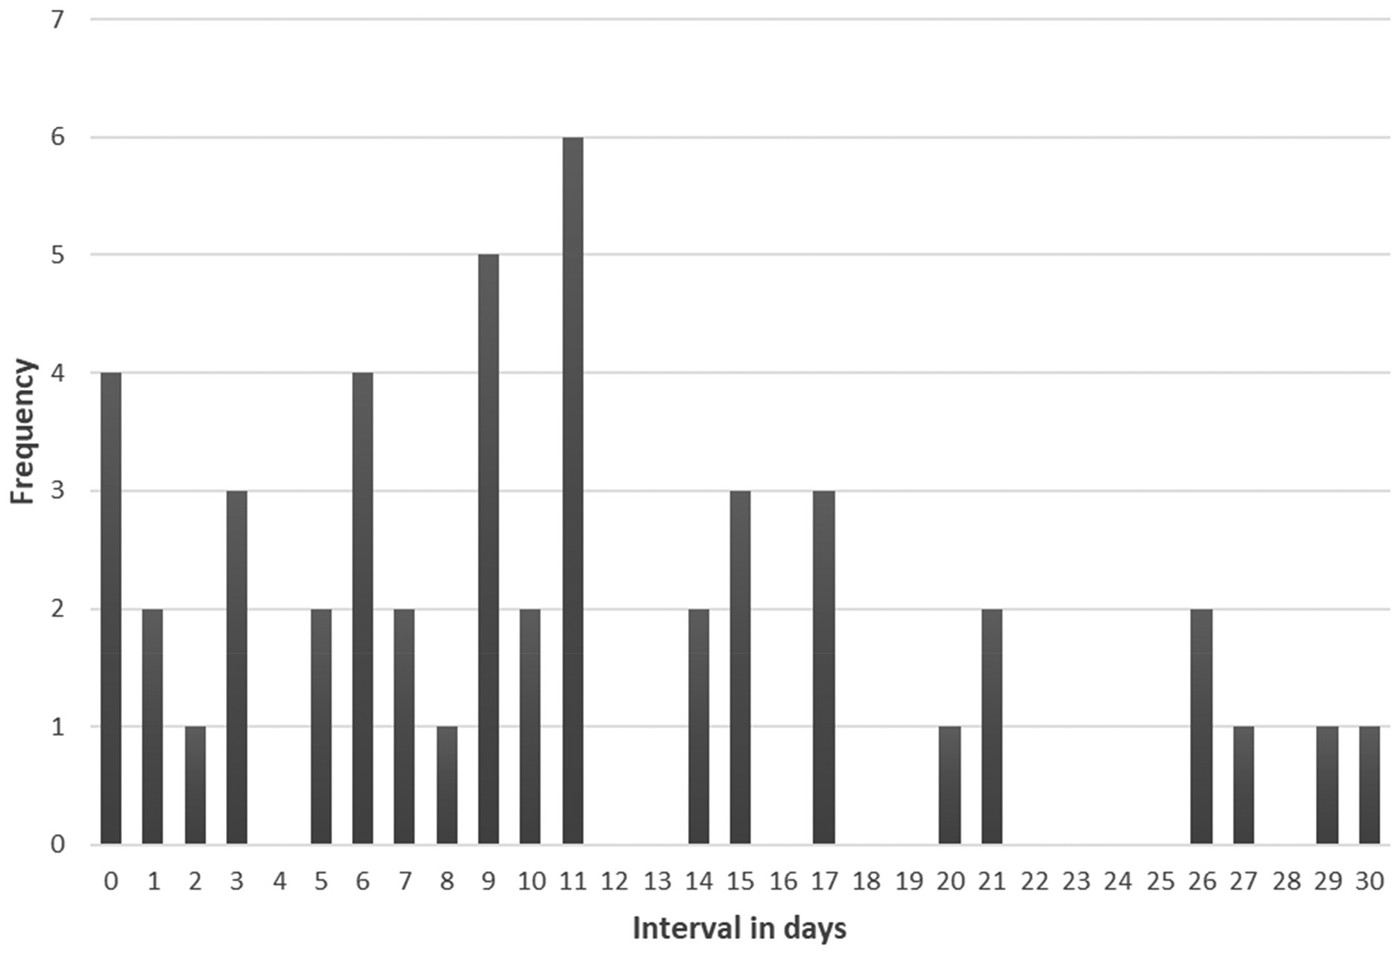
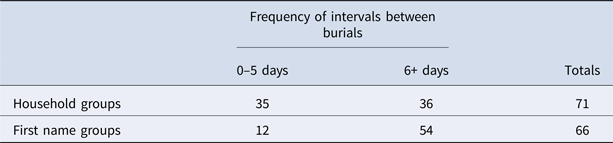
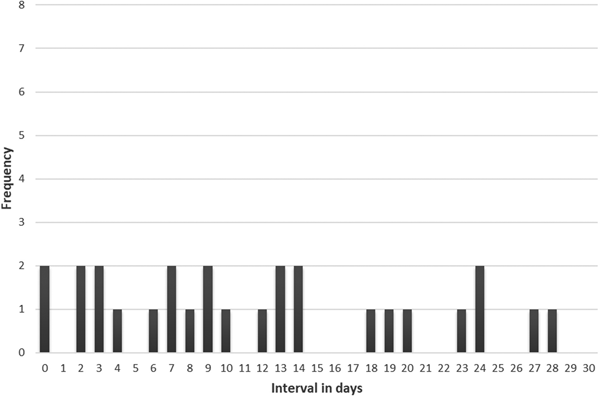
This investigation was continued by adopting a method for studying temporal clustering adapted from that used by Roger Schofield in his study of the Colyton outbreak.Footnote 59 Essentially, the interval in days between successive burials within each household group was recorded and the frequency of such time intervals was plotted as shown in Figure 7. (A further 7 intervals, in excess of 30 days, are not included on the graph). The most striking feature of Figure 7 is the seemingly high frequency of shorter intervals (from 0 to 5 days). This is a similar result to that observed in the Colyton study and indicates that burials within household groups did, indeed, exhibit temporal clustering with some occurring on the same day and many within five days. Nevertheless, this apparent finding needs to be confirmed statistically because we might expect to observe some clustering simply because burials tended to be concentrated in the months of August, September and October (as shown in Figure 3). To control for this possibility, we constructed ‘dummy’ groups of burials based on parish members with the same first name (for example, Thomas, Anne, Edward, Ellen, etc.) since, in general, we would not expect to see temporal clusters based on this characteristic. Twenty-two first name groups were constructed in this way with sizes ranging from 2 to 7.Footnote 60 The interval in days between successive burials within each 1st name group was recorded and the distribution plotted in the same way as had been done for household groups. The results are presented in Figure 8 (a further 18 intervals exceeding 30 days are also not included on the graph). In this case there was little evidence of a high frequency of shorter intervals, that is, 0–5 days. The apparent difference between household and first name groups was then subject to a statistical test for significance by comparing the two types of group in terms of the proportion of intervals from 0 to 5 days and intervals from six days onwards. The results are presented in Table 6. A significantly greater proportion of 0 to 5-day intervals was detected in the Household Groups (Chi2 = 14.69. d.f. = 1: p < 0.001) indicating that the apparent temporal clustering was a genuine phenomenon.
Interval in days between deaths within the same household group in 1603.

Interval in days between deaths within the same name group in 1603.

The frequency of burial intervals in days for both household and first name groups

The 1593 epidemic was also investigated using similar methods. Of the 81 burials recorded in 1593, 29 (36 per cent) could not be linked with another family member or someone living within the same household. The remaining 52 (64 per cent) burials could each be linked with at least one other family member or someone living within the same household. This data is presented in more detail in Table 7. It is evident that the number of groups exceeding three or more were fewer than that observed in the 1603 epidemic.
Number of burials per household group size in 1593

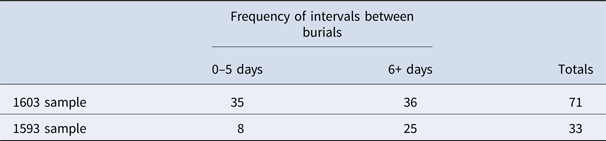
The interval in days between successive burials within each household group was then recorded and the frequency of such time intervals was plotted as shown in Figure 9 (a further seven intervals, in excess of 30 days, are not shown on the graph). The marked clustering of intervals from 0 to 5 days was not apparent in this sample. The results for 1593 were then compared to those of 1603 (see Table 8) and it was found that a significantly greater proportion of 0 to 5-day intervals were detected in 1603 than in the 1593 sample (Chi2 = 5.83, d.f. = 1: p < 0.02).
Interval in days between deaths within the same household group in 1593.

The frequency of burial intervals in days for household groups in 1603 and 1593

8. A brief description of a method used to sample family groups present on the eve of 1603
The baptismal, burial and marriage records, for the years 1598–1608 inclusive, were examined to identify household groups present on the eve of the 1603 epidemic. A household was deemed to be present if one of the following minimum criteria were met:
1. A birth was recorded in the year 1603 (a birth indicates the presence of a mother and the probable presence of her husband).
2. There were at least two entries in the burial records for 1603 for different household members.
3. There was an entry in the baptismal, burial or marriage records in the five years leading up to 1603 (1598–1602) followed by a second entry pertaining to a different household member in the five years leading from 1603 (1604–1608). This enabled the identification of households present but which did not contribute to baptisms or burials in 1603.
4. There was at least one entry in the burial records of 1603 and at least one other entry pertaining to a different family member in the baptismal, burial or marriage records five years prior or post 1603.
A total of 69 household groups met at least one of these criteria and so were added to the sample. The number of household groups sampled was fewer than the estimated number of between 113 and 133 we calculated earlier. However, this method is not likely to have been any more successful than the full family reconstitution carried out by Roger Finlay, mentioned earlier, which could only link 67 per cent of households listed in the Settlement of Tithes, 1638 with households identified by family reconstitution. If our detection rate was also 67 per cent it would imply the actual presence of 103 households, which is closer to the number calculated above. It also seems reasonable to believe that our sample of 69 households is sufficiently large enough to have been representative of the parish as a whole.
9. The incidence of plague within households detected by our sampling method
Twenty-one of the 69 household groups (30.4 per cent) did not experience a burial in 1603 and presumably escaped the plague altogether in this year. Remarkably, 13 households (18.8 per cent) were identified only because of multiple burials in 1603, without any further entries in any of the registers throughout the period 1598–1608 inclusive. This demonstrated that several families could have escaped observation, using our method, had it not been for deaths in 1603, and may reflect the migration of family groups both in and out of the parish. It also suggests that there may have been some families who did not experience deaths in 1603 and, without further entries in any of the registers throughout the period 1598–1608 inclusive, could also have escaped observation altogether thus potentially reducing the estimated number who escaped plague. In particular, households consisting of older adults and their children might not report further baptisms over this period.
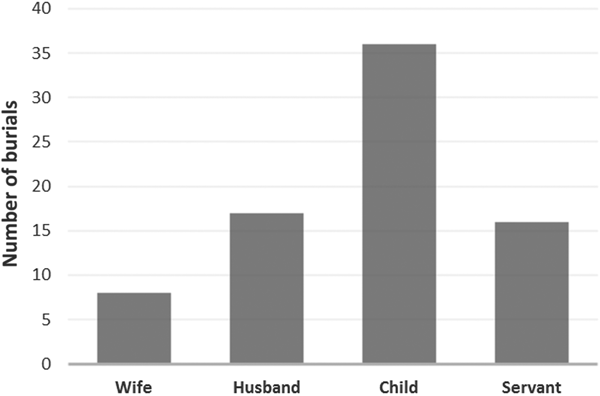
Forty-eight of the 69 families (69.5 per cent) registered at least one burial in 1603. There were multiple burials in 30 (43 per cent) families and single burials in 18 (26 per cent) families. The data were further examined to determine how many families experienced a burial of the wife, the husband, at least one child or at least one servant. The results are presented in Figure 10. In only eight families was the burial of a wife recorded, whereas in 36 families, at least one child was buried. Also, at least twice as many families experienced the death of the husband or a servant than wives. The data was analysed using the Chi2 test, which revealed a significant difference in the frequency of burials for the four types of family member (Chi2 = 36.67; df = 3; p < 0.001). The most marked difference was observed when comparing wives and children since more than four times as many families experienced the death of at least one child as experienced the death of the mother.
The frequency of burials of wives, husband, children and servants in 48 families with burials recorded in 1603.

10. Summary and discussion
The first objective of our study was to see if the plagues of 1593 and 1603 had a disproportionate effect on the mortality of children compared to adults within the parish of St Peter upon Cornhill, using the actual age at death recorded in the parish register rather than the alternative method of calculating mortality rates of different cohorts with reference to the model life tables proposed by Coale and Demeney. If such a bias could be detected, we proposed to examine the part that mortality among younger ‘servants’ contributed to this bias. We did, indeed, find a greater increase in the mortality crisis ratios for the younger age groups, which is in line with the earlier observations of the Hollingworths and Roger Finlay. We also found that individuals identified as ‘servants’ contributed greatly to this effect, accounting for most of the burials within the age group 15–24 thus providing substance to Roger Finlay's original conjecture. Typically, servants’ surnames indicated that they were not close relatives of the families within which they were placed and it seems odd that they should be so affected when relatively few of the older children born into such families were not. One possibility is that older children were absent from their families because they, themselves, had taken up apprenticeships or service in other parishes but, given that apprentices and servants were not attributed to their family of origin but to the family where they were stationed, it is not easy to see how this hypothesis can be tested. No statistically significant differences were found in the frequency of burials between the sexes in this study, which supports Finlay's wider study of several parishes but contrasts with the Hollingworths’ study of the St Botolph parish, which noted a bias in favour of male deaths. Further studies need to be carried out over a number of parishes to examine the possibility that the size of the population of ‘servants’, or the sex ratio of individuals in service, might exert effects on the bias towards children and male (or female) deaths more widely.
One explanation of the vulnerability of children and servants suggested by Roger Finlay might be that these groups had not developed immunity to the plague pathogen, whereas adults, living in London, may have done so in earlier plague episodes through exposure and survival.Footnote 61 Attractive though this hypothesis might seem, it must also be remembered that householders and their spouses were also likely to have been born and married outside the parish and many of them had, themselves, migrated to London as apprentices, servants or maids. Also, it must be said that the extent to which acquired immunity derived from prior exposure to Y. pestis can develop remains unclear.Footnote 62 An alternative explanation might be that it is the behaviour of adults and children, leading to different likelihoods of exposure, which is significant. In this respect it is interesting to note a similar vulnerability of children on the island of Madagascar, which continues to be a highly active focus for the disease.Footnote 63 An epidemiological survey of 20,900 cases during the second half of the twentieth century revealed the highest vulnerability to bubonic plague was also in the 10–19 age group.Footnote 64 The Madagascan investigators, however, believe that this vulnerability was not associated with immunity but was more likely the result of children playing, or sleeping, on the floor closer to infected fleas. The vulnerability of servants might likewise be a function of behaviour. For example, in the early modern period, the sleeping quarters of servants were often crowded and it was commonplace for them to share a bed with the children of the household.Footnote 65
The second major finding was that when there was more than one death in a household there was a marked tendency for the deaths to cluster within a short time of each other. It is interesting that there was significantly more temporal clustering in 1603 than 1593 and it is tempting to speculate that this played a part in the relative intensity of the epidemics. However, similar investigations need to be carried out on more parishes and over several of plague years to determine if such differences reflect a genuine difference between epidemic years or a general variation that might be observed within any epidemic year. Despite evidence of many cases clustering within households, a large minority of burials in 1593 and 1603 (36 per cent and 40 per cent, respectively) could not be linked to the burial of another member of the same household. How should these findings be interpreted? Possibly, some of these latter cases arose from contact with stricken households but there is no way of investigating this using the burial register data because such connections are not recorded. On the other hand, it seems that this finding could reflect the observations on the distribution of deaths in India, as summarised by the Plague Commission in 1908:
All the evidence … points to the conclusion that in the majority of instances a house during a plague epidemic yields only a single case. Moreover, it was also found that, when two or more cases do occur in a house, they are attacked practically simultaneously as if from a common source of infection, and that in houses with multiple cases the evidence regarding the rat mortality is much stronger than in those instances in which only a single case occurred in a house.Footnote 66
However, the findings of the Plague Commission were not beyond question even in the early twentieth century. For example, C. A. Gill, an Assistant Plague Medical Officer in Lahore, carried out a study of plague in the Punjab confirming that in bubonic outbreaks it was exceptional for there to be more than two cases in one house but in pneumonic outbreaks multiple cases in each house was the rule.Footnote 67 Possibly, our observations on the St Peter upon Cornhill database indicate that there are two processes at work that reflect the epidemiological pattern of a disease which, within the same outbreak, can both be transmitted by an insect vector from rodents and directly between people as proposed in the recent Eyam study.Footnote 68 However, the evidence presented in this study is insufficient for us to offer a view on whether direct transmission between individuals was through the medium of respiratory droplets (pneumonic plague), human ectoparasites (such as lice, or fleas), or both.Footnote 69 Presently, it is not clear how such a differentiation might be achieved if it is to be based on evidence rather than conjecture.
Having detected evidence that many cases clustered together in household groups, but that a large minority were singletons, we continued our study by attempting to estimate what proportion of household groups, within the parish, were affected by the plague. Using a bespoke method, we were able to uncover documentary evidence of 69 households. Forty-eight of these 69 families (69 per cent) registered at least one burial in 1603. There were multiple burials in 30 (43 per cent) families and single burials in 18 (16 per cent) families. Although we often tend to think of an epidemic sweeping uniformly throughout the metropolis, we find that, at the level of parish, the spread was evidently discontinuous, which may reflect different opportunities for exposure and/or the structure of household groups. It is also the case that some families escaped plague altogether, suffering no burials in 1603, while others would not have been identified by our methods as being present on the eve of 1603 had it not been for deaths in that year. One spectacular example of a substantial family that seems to have largely escaped the plague is provided by the aforementioned William Averell who, during the period from his marriage in 1578 until his death in 1605, produced 18, possibly 19, children. Even though the burials of his wife and six of his children are recorded, only one child was buried in 1603 and no family members were buried in 1593. There is also some suggestion that four times as many households experienced the burial of a child than that of the mother. Possibly, this is an indication that wives may have been encouraged to flee the parish to escape the plague, which might feed in to any biases towards male deaths. Apparently, however, they tended not take their children with them and neither, so it seems, their servants.
Finally, our results, taken together with those of Finlay, De Witte, Champion and others illustrate the point that plague epidemics, caused by the same pathogen, can differ in their epidemiological features but, as an alternative to invoking some property of the aetiological agent as the cause, researchers might also consider social factors including the structure of household groups as well as social behaviour and social structure, which can lead to differential exposure. These ideas are not new and powerful exemplars exist in the literature. For instance, the plague outbreak in Johannesburg in 1904 showed a heavy bias towards adult male mortality but this merely reflected the preponderance of men in that city, attracted by the ‘gold rush’ on the Witwatersrand.Footnote 70 Also, the early pneumonic phase of this epidemic was mostly confined to workers from the Indian subcontinent who were forced to live in a crowded ‘Coolie Location’, whereas the later bubonic phase was mostly confined to white residents and their black African servants who lived near the Market Square, which contained the seat of a rat epizootic. We should also bear in mind that substantially different methodologies used by independent investigators could contribute to this apparent variation. For example, we have used burial records whose accuracy depends on the whim of the parish clerk, but the sampling of skeletal material in a city such as London depends upon serendipitous uncovering of burial sites, often the corollary of modern building works, which may, or may not, be representative of the population as a whole.
Acknowledgements
The authors would like to thank Professor Richard Cust for making facilities available for this research and to Professor Cust and Dr Chris Callow (School of History and Cultures, Birmingham University) and Gill Newton (Cambridge Group for the History of Population and Social Structure, Cambridge University) for their helpful comments on an earlier version of this manuscript.