Introduction
Depression is frequent in institutional long-term care (LTC) populations; a review of 26 published studies found that the median prevalence of major depressive disorders was 10% (range 5–25%), while the median prevalence of depressive symptoms was 29% (range 14–82%; Seitz et al., Reference Seitz, Purandare and Conn2010). Variability in rates between studies seems to depend in part on criteria for depression, the specific measurement instrument, and the source of information (observer or self-reported symptoms). Self-reported measures of depressive symptoms are often poorly correlated with provider-reported measures of depression (Kerber et al., Reference Kerber, Dyck, Culp and Buckwalter2005).
It is of interest to be able to predict the course of depression in LTC in order to plan treatment programs; information on the characteristics of residents who are likely to have a more severe course can help to inform the targeting of such programs. Several longitudinal studies have described the course of depressive symptoms in LTC populations using different study designs and measures of depression. Some report that depressive symptoms are generally stable over periods from two months (Webber 2005) to 39 weeks (Abraham, Reference Abraham1991) to one year (Parmelee et al., Reference Parmelee, Katz and Lawton1992); others have reported decreases in the prevalence of depression over time in LTC populations (Payne et al., Reference Payne2002; Smalbrugge et al., Reference Smalbrugge, Jongenelis, Pot, Eefsting, Ribbe and Beekman2006). We have reported an increased incidence over time using a nurse-observed measure of depression (McCusker et al., Reference McCusker2014), which might be explained by increased awareness and reporting of symptoms over time by LTC nurses. The literature on the course of depression in LTC has several limitations: most studies use a limited number of assessment points, sometimes only two assessment points (Boorsma et al., Reference Boorsma2012), and none have attempted to describe different trajectories of depressive symptoms over time in LTC populations. The use of trajectories to describe the course of depression recognizes that severity of symptoms falls along a continuum, with fluctuations in severity over time. The more conventional approach to studying the course uses cut-points to define depression, possibly misclassifying a temporary increase in symptom severity as incident depression, or a temporary decrease in severity as remission. Research on depression trajectories and their predictors has been conducted in other settings; for example, in acute-care (McCusker et al., Reference McCusker2007).
Risk factors at baseline for a severe depression trajectory may be similar to those reported for incident depression in LTC: more severe depressive symptoms (McCusker et al., Reference McCusker2014); dementia diagnosis (Hoover et al., Reference Hoover2010; Boorsma et al., Reference Boorsma2012); younger age (Hoover et al., Reference Hoover2010; Boorsma et al., Reference Boorsma2012); physical comorbidity (Boorsma et al., Reference Boorsma2012); poor functional status (Parmelee et al., Reference Parmelee, Katz and Lawton1992); sensory impairment (Boorsma et al., Reference Boorsma2012); pain (Hoover et al., Reference Hoover2010); and use of antidepressant medication (Hoover et al., Reference Hoover2010).
In the present study, we sought to characterize depression symptom trajectories over six months among older LTC residents, and to identify resident characteristics (socio-demographic, physical and cognitive impairment, severity of depressive symptoms, use of antidepressants, comorbidity, pain and sensory impairments) at baseline that predict symptom trajectory.
Methods
This study was a secondary analysis of data from a six-month prospective, observational, and multi-site study whose original objectives were to investigate the occurrence of risk factors for delirium (McCusker et al., Reference McCusker2011). The methods of recruitment and follow-up of the study sample have been described previously (McCusker et al., Reference McCusker2011). We recruited both newly admitted and longer-term residents consecutively from lists of residents aged 65 years or more, admitted for LTC, with stratification by Mini-Mental State Examination (MMSE) into subgroups with and without severe cognitive impairment, using a cut-point of 9/10 (Folstein et al., Reference Folstein, Folstein and McHugh1975). Competence to consent to the study was based on the clinical impression of the primary nurse. Competent residents were invited to participate in the study by a research assistant (RA). Among incompetent residents, a letter describing the study was sent to the legal guardian if available, or (because many LTC residents are not legally declared incompetent) to the responsible family member. The legal guardian/family member informed the nurse if they were willing to meet the RA. The study protocol was approved by the research ethics boards of McGill University and those sites with such a review committee.
For the purposes of this study, the sample of analysis was limited to residents with an MMSE score of 15+ as the Geriatric Depression Scale (GDS) may not be valid in the population with lower scores (Gerety et al., Reference Gerety1994).
Resident assessments
The 15-item GDS (GDS-15) was used to assess self-reported depression symptoms. The GDS is recommended for use in nursing homes (Gerety et al., Reference Gerety1994), and has good performance characteristics among residents with MMSE of 15+ (McGivney et al., Reference McGivney, Mulvihill and Taylor1994; Jongenelis et al., Reference Jongenelis2005). At baseline and every four weeks up to 24 weeks, depressive symptoms were assessed using the GDS-15.
The RA also completed the MMSE (Folstein et al., Reference Folstein, Folstein and McHugh1975; Tombaugh and McIntyre, Reference Tombaugh and McIntyre1992), and validated for use in LTC (Kafonek et al., Reference Kafonek, Ettinger, Roca, Kittner, Taylor and German1989). The MMSE score ranges from 0–30, a lower score indicating greater cognitive impairment. Level of cognitive impairment was categorized as: <10 (severe); 10–17 (moderate); 18–23 (mild); and minimal (24 or more). The Confusion Assessment Method (CAM; Inouye et al., Reference Inouye, VanDyck, Alessi, Balkin, Siegal and Horwitz1990) was completed by the RA based on standardized observations of the resident that included, at a minimum, administration of MMSE questions 1–5 (assessing orientation and memory) and review of the resident's chart for the previous week. We categorized delirium status at each assessment as: (1) probable delirium (acute onset and/or fluctuation, inattention, and either disorganized thinking and/or altered consciousness); (2) core symptoms of delirium not meeting criteria for delirium (i.e. the presence of at least one of the following: inattention, fluctuation, disorganized thinking, or altered level of consciousness); and (3) no core delirium symptoms. The RA assessed pain among residents who were able to respond using the present pain intensity scale from the McGill Pain Questionnaire, the most reliable of simple pain-rating scales for use with elderly LTC residents (Melzack, Reference Melzack1975; Kaasalainen and Crook, Reference Kaasalainen and Crook2003). The RA observed at each assessment whether residents had visual or hearing impairment, and if so, whether it was corrected (i.e. the resident was wearing reading glasses or hearing aids respectively).
The Barthel Index (BI) was administered at each nurse interview (Mahoney and Barthel, Reference Mahoney and Barthel1965); the modified total weighted score (Shah et al., Reference Shah, Vanclay and Cooper1989) ranges from 0 (complete dependence) to 100 (complete independence). Scores were categorized as severe (0–19), moderate (20–59), and mild to no disability (60 and over).
Data from medical charts
At the end of the study, data on socio-demographic variables, medical problems, and antidepressant medications were abstracted from resident charts, blind to the RA assessments. Socio-demographic measures included age, sex, and duration of residence (less than one year, and one year or more). Medical problems were extracted from medical charts for the period between admission and baseline interview. These were used to compute the Charlson Comorbidity Index (CCI) (Charlson et al., Reference Charlson, Pompei, Ales and MacKenzie1987; Field et al., Reference Field2001), validated as a predictive index for survival in two elderly nursing home cohorts (Bravo et al., Reference Bravo, Dubois, Hébert, De Wals and Messier2002; Buntinx et al., Reference Buntinx, Niclaes, Suetens, Jans, Mertens and Van den Akker2002). The following specific medical problems were also coded from chart data: diagnoses of dementia, heart disease, hypertension, diabetes, and stroke (Bravo et al., Reference Bravo, Dubois, Hébert, De Wals and Messier2002). Antidepressant and analgesic medication prescriptions at baseline were extracted from medication charts.
Statistical methods
Our main goal was to develop a classification of GDS trajectories, using the same approach used in a previous study of depression trajectories in an acute-care setting (McCusker et al., Reference McCusker2007). This approach first models each individual trajectory as a linear or quadratic function of time and initial value (GDS). Then individuals are clustered based on the coefficients of this regression, using a standard classification technique. Finally, we assess the impact of a number of depression predictors on the probability of belonging to each cluster.
We used the Linear Mixed-Effect Model (Pinheiro and Bates, Reference Pinheiro and Bates2000; Galecki and Burzykowski, Reference Galecki and Burzykowski2013) to impute the incomplete data (ranging from 3.1% at the one-month follow-up to 18% at the six-month follow-up) and to estimate the course of depression, as measured by the GDS, during the six-month follow-up. The Akaike Information Criterion (AIC) (Akaike, Reference Akaike1974) and the Bayesian Information Criterion (BIC) (Schwarz, Reference Schwarz1978) were used for model selection, and nested models were also compared using the Likelihood Ratio Statistic (McNutt et al., Reference McNutt, Wu, Xue and Hafner2003). Standard techniques of model fit were used to check the hypothesis of normality of the residuals (Singer and Willett, Reference Singer and Willett2003). To identify clusters of GDS trajectories, we applied Hierarchical Cluster Analysis to the complete study sample with Ward's Minimum Variance Criterion (Ward, Reference Ward1963) to measure cluster similarity. Then we cut the classification tree by combining the pseudo F-statistic (Calinski and Harabasz, Reference Calinski and Harabasz1974; Hawkins et al., Reference Hawkins, Muller, Ten Krooden and Hawkins1982) and the Silhouette Coefficient (Kaufman and Rousseeuw, Reference Kaufman and Rousseeuw2005). The resulting clusters can be considered, as will be shown, as constituting an ordered categorical outcome (low, intermediate, and high level). Therefore, to predict this outcome from the initial GDS score and other predictors, we used the Proportional Odds Model (Yee, Reference Yee2010).
Baseline characteristics of residents were divided into four blocks of variables to predict GDS cluster; these included demographics (age, sex, and time since admission), current health and functional status (MMSE, Barthel, delirium symptoms, pain, analgesic medications, and visual and hearing impairment), medical history (dementia, cancer, hypertension, stroke, heart disease, and diabetes), and depression variables (baseline GDS score, history of depression, and current antidepressant medication). The CCI was removed from our predictive models because of the presence of multicollinearity among the predictor variables. We developed predictive models using the Partial Proportional Odds Model (Williams, Reference Williams2006) to address situations in which the proportional odds assumption applied to some but not all of the covariates. In the case that the proportional odds assumption was not supported for a covariate, a distinct cumulative odds ratio was computed for each pair of cumulative probability. Univariate and multivariable models were fitted for each block of variables. BIC and AIC criteria were used to obtain a parsimonious model for each block. We also assessed the impact of the initial GDS by fitting a model without it.
All the analyses were performed in Stata (version 12) and R (version 3.0.1).
Results
Study cohort
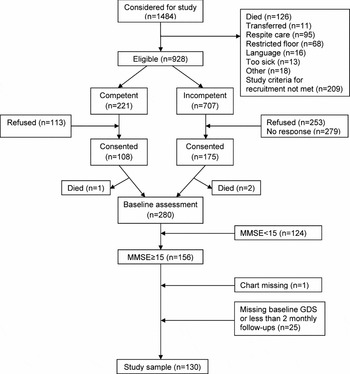
Figure 1 shows the derivation of the study sample of 130 residents with an MMSE score of 15+. Consent rates among eligible residents were low: 48.9% in competent and 24.8% in incompetent residents. The lower consent rate among incompetent residents was due to the difficulty in contacting family members. Among 280 residents who participated in the original study, 124 (44.3%) were excluded because their MMSE was less than 15, and another 26 were excluded (9.3%) because of missing data or less than two monthly follow-up assessments.
Flow chart.

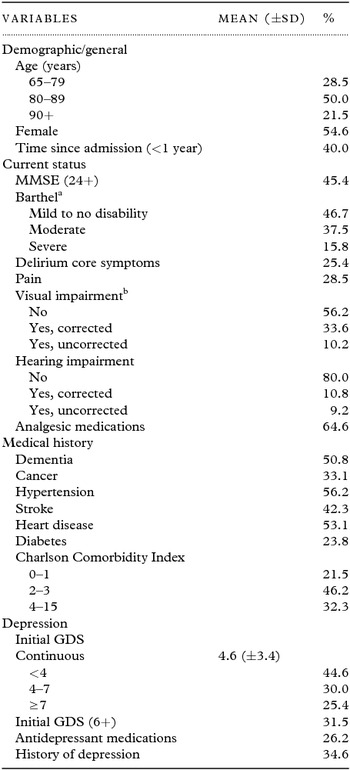
Table 1 shows the baseline characteristics of the study sample of 130 residents. The majority was aged 80 years or over, female, moderately disabled, and had no delirium core symptoms, visual or hearing impairment. The mean baseline GDS score was 4.6, 34.6% had a chart-documented history of depression, and 26.2% were receiving antidepressant medications. Most common prior chart diagnoses (50% or more of the sample) were hypertension, heart disease, and dementia.
Baseline characteristics of the study sample (n = 130)

Notes: aBarthel index scores, n = 120.
bVisual impairment, n = 128.
Development of clusters
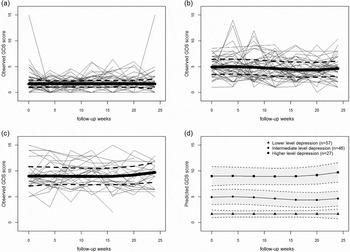
The methodology described above was applied to the data. The residuals of the linear model used to impute the data did not appear to invalidate the hypothesis of normality. The pseudo F-statistic suggested a two-cluster or three-cluster solution, while the Silhouette Coefficient suggested a three-cluster or six-cluster solution; we selected three clusters as the optimal solution. Panels (a), (b), and (c) in Figure 2 show the observed individual trajectories of GDS scores in each of the three clusters, together with the fitted average trajectory and its 95% Confidence Interval (CI). Panel (d) in Figure 2 shows all of the cluster-fitted average trajectories with their 95% CI. The average trajectories of the three clusters had predicted baseline GDS levels of 1.7, 4.9, and 9.0, which we describe as “lower,” “intermediate,” and “higher” levels of depressive symptoms respectively. (The crude average baseline levels were similar to the predicted values of 2.2, 4.9, and 9.0 respectively). The predicted average GDS scores over time were 1.7, 4.7, and 9.2 respectively. Within-subject variation over time, as measured by estimated residual variance, was relatively small in the lower (2.1) and higher (3.3) level symptom clusters. In contrast, subjects from the intermediate level cluster had a large within-subject variance (4.7). The results of the Proportional Odds Model indicated the following: (1) Subjects with initial GDS score of less than or equal to 3.48 belong to the lower level depression cluster with a probability of at least 0.48; (2) subjects with initial GDS score more than 3.48 and less than or equal to 7.28 belong to intermediate level depression cluster with probability of at least 0.48; (3) subjects with initial GDS score more than 7.28 belong to the higher-level depression cluster with a probability of at least 0.48.
Results of cluster analysis of GDS (Geriatric Depression Scale) scores over time. (a) Patient GDS scores in the Lower level depression cluster (n = 57). (b) Patient GDS scored in the Intermediate level depression cluster (n = 46). (c) Patient GDS scores in the Higher level depression cluster (n = 27). (d) Cluster mean course (continous lines) with 95% Cl (dashed lines) in the three clusters (n = 130).

Baseline predictors of depression trajectory
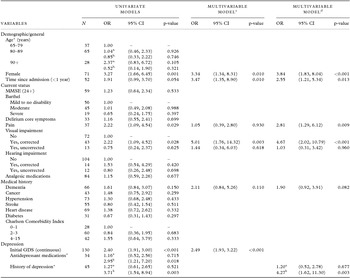
Table 2 shows the results of the univariate and multivariable regression models to predict depression trajectory. In the univariate models, residents with a more severe course were significantly more likely to be females, less than 12 months since admission, to have corrected visual impairment (versus no impairment), and had a higher GDS score at baseline. Moreover, the effects on the cumulative odds ratios of history of depression and current antidepressant medication were found to be non-proportional across two comparisons, that is, lower combined with intermediate clusters versus higher cluster, and lower cluster versus intermediate combined with higher cluster. In other words, for residents who had a history of depression and/or were currently taking an antidepressant medication, their potential risks of a higher symptom trajectory varied depending on the current severity of depression: These factors indicated an increased probability of a more severe course for those currently in the intermediate cluster, but not for ones in the lower cluster. Two parsimonious multivariable models, A and B, were fitted, with and without initial GDS respectively. Both models found significant independent effects of sex, duration of residence, and visual impairment. In model A, the initial GDS score was a significant predictor of the trajectory; in model B (that excluded the initial GDS), pain became a significant predictor of level of depression, and history of depression became a significant predictor of a more severe versus intermediate depression trajectory. Model A performed better than model B in the view of both AIC and BIC criteria.
Partial proportional odds model of baseline characteristics by levels of depression (n = 130)

Notes: OR: odds ratio (proportional); 95% CI: 95% confidence interval.
*The odds ratio of covariates are computed without the proportional assumption.
aCumulative odds ratio of (intermediate + higher) level versus lower level.
bCumulative odd ratio of higher level versus (lower + intermediate) level.
cParsimonious multivariable model, including initial GDS score.
dParsimonious multivariable model, excluding initial GDS score.
To further explore the joint relationship of baseline depression and other risk factors (female, less than 12 months since admission, and visual impairment) on the symptom trajectory, we divided the group of residents with a GDS of 7 or more into two categories: 0–1 other risk factors, and 2–3 other risk factors (i.e. female sex, shorter duration of residence, and corrected visual impairment). The probability of a more severe trajectory was 47% (8/17) among those with 0–1 other risk factors and 94% (15/16) among those with 2–3 other risk factors (p-value = 0.010).
A posteriori power calculations based on a type I error of 0.05 (two-tailed), with a sample size of n = 130 show, for a binary predictor, that the minimum power to detect an odds ratio of 2.00, 2.25, and 2.5 is 60, 70, and 80% respectively (Whitehead, Reference Whitehead1993).
Discussion
This study aimed to characterize depression symptom trajectories over six months among older LTC residents with MMSE scores of at least 15, and to identify resident factors that predicted symptom trajectory. We found that, similar to results in older medical inpatients (McCusker et al., Reference McCusker2007), there were three types of trajectories, characterized by their stability over time but differentiated by the level of symptom severity. Within each group of trajectories, the individual course may include fluctuations. In the more severe trajectories, fluctuations may be identified as recurrence and remission of depression; when considered in the context of the overall course of symptoms, however, the apparent recurrences and remissions can be better understood as fluctuations. The group with higher severity (20.8% of the sample) had mean over time GDS scores of 9.2. This group represents residents with clinically significant depression; 59% had a history of depression recorded in the chart and 44% were currently receiving antidepressants; there may be opportunities to improve the treatment of depression in this group. The group with intermediate severity (35.3% of the sample) had a mean over time GDS score of 4.7, just below the commonly used threshold score for screening. The trajectories of these residents occasionally peaked above the threshold score. This group represents residents with mild symptoms. The group with lower severity (43.8% of the sample) had a mean over time GDS score of 1.7, indicating minimal depressive symptoms. Notably, the intermediate and lower severity groups had similar proportions of residents receiving antidepressant medications (17.4% and 24.6% respectively); and with a chart-recorded diagnosis of depression (23.9% and 31.6% respectively); admittedly, symptom trajectories may be mild or minimal in some of these residents because they were receiving effective antidepressant treatment.
Four baseline resident characteristics predicted the subsequent depression symptom trajectory: the initial GDS score, female sex, less than 12 months since LTC admission, and corrected visual impairment. If the initial GDS is not considered in the analysis, then more severe pain and a history of depression, both associated with initial GDS, become significant predictors of a more severe trajectory. In a previous study among older medical inpatients, initial symptom level, female sex, and duration of depression were the main predictors of a more severe symptom trajectory (McCusker et al., Reference McCusker2007). Other research has also found that depressive symptoms are more severe during the first year after admission to an LTC facility (Hoover et al., Reference Hoover2010), suggesting that depressive symptoms be monitored more closely during this period. Visual impairment has been associated with depression in prior cross-sectional studies (Bruce, Reference Bruce2001; Jongenelis et al., Reference Jongenelis, Pot, Eisses, Beekman, Kluiter and Ribbe2004; Rovner et al., Reference Rovner, Casten, Hegel, Leiby and Tasman2007). In a previous study in the same population using a nurse-reported measure of depression, we found that uncorrected visual impairment at follow-up was associated with incident depression, a finding that is consistent with the current study (McCusker et al., Reference McCusker2014). These residents may have more severe visual impairment. Alternatively, depression may reduce the motivation to use reading glasses, or to have an eye examination. The sample size of residents with uncorrected visual impairment was small (n = 13), perhaps explaining the lack of an association with depression among these residents. Pain has been associated with incident depression in previous research (Hoover et al., Reference Hoover2010), suggesting the need for attention to treatment of pain among residents with depressive symptoms. Several risk factors for incident depression identified in previous research were not found to be predictive of a more severe course of depression in this study, notably comorbidity, poor function, and younger age. These discrepancies may be due to the characteristics of the sample, the exclusion of those with more severe cognitive impairment, or the small sample size in certain categories of interest.
Four potential limitations of the study should be noted. First, low rates of participation limit the representativeness of the sample. Second, the results cannot be generalized to residents with severe cognitive impairment, as we excluded residents with MMSE scores less than 15 due to lack of validity of the GDS in these residents. Third, the study had limited statistical power (a minimum power less than 60% to detect odds ratios smaller than 2.0). Fourth, the statistical methodology, although state-of-the-art, may not be optimal. In theory, a model-based clustering approach could be developed, which would not require the complexity of the data imputation and would, in a single step, extract “‘soft clusters” directly from the data; in particular, the determination of the number of clusters could be obtained on the basis of widely accepted criteria such as the AIC and the BIC. However, the model-based approach for longitudinal data is still under development and the software now available is not stable enough to warrant routine use (Ciampi et al., Reference Ciampi, Campbell, Dyachenko, Rich, McCusker and Cole2012). Moreover, assessing the effect of covariates on model-based clusters (through their impact on the mixing coefficients), although possible, would require the use of sophisticated software still under development (Leisch, Reference Leisch2003). Finally, the approach used here to identify classes of trajectories is by no means unique: indeed, several alternatives have recently been proposed in the area of mental health (Chi and Weisner, Reference Chi and Weisner2008; Kuchibhatla et al., Reference Kuchibhatla, Fillenbaum, Hybels and Blazer2012; von Gunten et al., Reference von Gunten, Mosimann and Antonietti2013). Our approach was dictated essentially by familiarity with the methods and successful earlier application by our research group (Sylvestre et al., Reference Sylvestre, McCusker, Cole, Regeasse, Belzile and Abrahamowicz2006; McCusker et al., Reference McCusker2007). A comparison of different approaches would be useful, but well beyond the scope of this work.
The results have implications for clinical practice and research in LTC. The conventional approach to diagnosis based on screening or diagnostic criteria may result in misclassification: residents with a short-term increase in severity from a normally mild or minimal level may be classified as depressed, while those with short-term decline in severity may be defined as non-depressed. There is a resultant potential for over- and under-treatment. A longitudinal approach that uses repeated screening measures may result in more accurate classification of residents. However, as many LTC settings lack the resources to do repeated screenings, it is noteworthy that a single GDS screen appears to accurately predict the future trajectory in about half of the residents. Use of additional information (i.e. female sex, less than one year since admission, and history of depression) may help to identify residents at higher risk of a more severe symptom trajectory; such residents might be targeted for more frequent screening and/or evaluation and treatment of their depression.
Conflict of interest
All authors declare the following: (1) The study sponsor had no involvement in the study design, the collection, the analysis, and the interpretation of data, the writing of the report, and in the decision to subject the report for publication; (2) no personal relationships with any companies that might have interest in the submitted work are present; (3) none of their spouses, partners, or children have any financial relationships that may be relevant to the submitted work.
Author contributions
Jane McCusker and Martin G. Cole: Conception and design, obtaining funding, acquisition of data, analysis and interpretation of data, drafting of manuscript, and supervision. Philippe Voyer: Conception and design, obtaining funding, acquisition of data, drafting of manuscript, and supervision. Johanne Monette and Nathalie Champoux: Conception and design, obtaining funding, and drafting of manuscript. Antonio Ciampi, Eric Belzile and Chun Bai: Analysis and interpretation of data, and drafting of manuscript. Minh Vu: Acquisition of data, drafting of manuscript, and supervision.
Acknowledgments
Funding: This work was support by the Canadian Institutes of Health Research (IAO69519), Canadian Institute of Aging & Institute of Gender and Health (CRG-82953), and the Alzheimer's Society of Canada and the Canadian Nurses Foundation (07-91).