I. INTRODUCTION
Stainless steels have found their applications in various fields such as aerospace, marine structures, energy-related machinery, construction equipment, and household appliances. However, composite organic, inorganic and biological fouling occurs on stainless steel surface. The surface fouling will lower the corrosion resistance and smear the highly polished surfaces of stainless steels.Reference Rosmaninho, Santos, Nylander, Paulsson, Beuf, Benezech, Yiantsios, Andritsos, Karabelas, Rizzo, Muller-Steinhagen and Melo1–Reference Tavares, Shahryari, Harvey, Coulombe and Omanovic3 Processes relating to protection of stainless steel from corrosion and keeping the surface clean are an area of study commanding considerable attention, given the broad applications of stainless steel.
Applications of photocatalytic processes are widely recognized as viable solutions to solve the surface fouling problems, because organic species can be completely mineralized to carbon dioxide or become nontoxic materials by photocatalytic pathway.Reference Fujishima, Zhang and Tryk4, Reference Ravelli, Dondi, Fagnoni and Albini5 Among many candidates for photocatalysts, titanium dioxide (TiO2) is the most intensively studied material for decontamination and disinfection of water,Reference Paleologou, Marakas, Xekoukoulotakis, Moya, Vergara, Kalogerakis, Gikas and Mantzavinos6, Reference Liu, Bai and Sun7 purification of volatile organic compounds in indoor air,Reference Puddu, Choi, Dionysiou and Puma8 carrying out organic synthesis by solar energy,Reference Palmisano, Augugliaro, Pagliaro and Palmisano9 and even for producing hydrogen as fuel by water photohydrolysis.Reference Ni, Leung, Leung and Sumathy10 Construction of TiO2 coatings on stainless steel surface are therefore of interest for photocatalytic purpose. Several methods have been used to fabricate TiO2 thin films on stainless steel surface, including sputtering,Reference Cui, Du and Wen11 chemical or physical vapor deposition,Reference Evans, Pemble and Sheel12, Reference Giolli, Borgioli, Credi, Di Fabio, Fossati, Miranda, Parmeggiani, Rizzi, Scrivani, Troglio, Tolstoguzov, Zoppi and Bardi13 and sol-gel process.Reference Li, Qiu and Yang14 In these methods, stainless steels with photocatalytic properties were prepared by tedious processes that resulted in poor homogeneity. Another major disadvantage is that it is difficult to obtain polished surface in stainless steels using surface coating technologies. Moreover, the band gaps for anatase and rutile TiO2 being 3.2 and 3.0 eV require ultraviolet (UV) light for activation.Reference Chong, Jin, Chow and Saint15 But UV light in solar radiation as reaching the earth’s surface constitutes relatively a small fraction (approximately 3–5%).Reference Tachikawa, Fujitsuka and Majima16 Iron (III) oxide (Fe2O3), the most stable iron oxide under ambient conditions, is one of the promising materials for photocatalytic applications. The band gap energy of Fe2O3 is 2.2 eV,Reference Zhou, Yang, Wang, Mao, Wang, Yang and Liu17 which can be activated with visible light (<560 nm), collecting up to 40% of the solar spectrum energy.Reference Mor, Prakasam, Varghese, Shankar and Grimes18 However, the major drawback of Fe2O3 as a photocatalyst is the poor electron mobility resulting in rapid electron-hole recombination,Reference Pradhan and Parida19 which becomes the principal challenge for its practical applications. Nanostructured Fe2O3 materials have exhibited improved photocatalytic performance due to their large aspect ratio, reduced scattering of free electrons, and enhanced electron mobility.Reference Hahn, Ye, Flaherty, Bard and Mullins20, Reference Zhang, Hossain, Miyazaki and Takahashi21 Aligned Fe2O3 nanopores/nanotubes have shown encouraging visible light photocatalytic performance for their improved charge transport properties compared with other nanostructures.Reference Mohapatra, John, Banerjee and Misra22, Reference Zhang, Hossain and Takahashi23
Great interest has been aroused in the context of electropolishing of metals or metallic alloys, especially on aluminum or titanium surfaces,Reference Su and Zhou24, Reference Schmidt-Stein, Thiemann, Berger, Hahn and Schmuki25 also, when designing periodic arrangement of nanopores/nanotubes in certain physicochemical conditions. Aligned Fe2O3 nanotubes have been realized on pure iron surface by electrochemical anodization in fluoride-containing electrolytes.Reference Mohapatra, John, Banerjee and Misra22, Reference Zhang, Hossain and Takahashi23, Reference Habazaki, Konno, Aoki, Skeldon and Thompson26 But anodization of stainless steel often led to disordered surface morphology composed of Cr-rich oxide films.Reference Diaz, Sevilla, Galan, Escolar, Engel and Gil27, Reference Taveira, Montemor, Belo, Ferreira and Dick28 The synthesis of aligned NPAs on stainless steel surface by anodization and their application for visible-light photocatalysis is described in this article. Meanwhile, the as-prepared stainless steel is still maintained with polished surface featuring corrosion resistance. This photocleanable stainless steel shows admirable range of potential applications in many fields, particularly in outdoor construction materials.
II. EXPERIMENTAL DETAILS
AISI 304 grade stainless steel foil containing (wt%): Cr: 17.89, Ni: 9.38, Mn: 1.23, C: 0.015 and Fe balance percentage, was cut into specimens of× 15 × 20 × 0.5 mm. Perchloric acid (HClO4, 70%) and ethylene glycol (EG, 99.8%, anhydrous) were obtained from Sigma-Aldrich (St. Louis, MO). Other chemicals were of analytical grade. And double distilled water (DDW) was used throughout. The specimen was mechanically polished with abrasive papers (grade 1000, 1200, 1500, 2000) followed by diamond pastes of decreasing grade (3.5, 1 and 0.5 μm). Then it was rinsed with ethanol and DDW under ultrasonic bath for 20 min and served as the anode. The electrolyte was EG solution containing perchloric acid. Anodization was conducted in a stirred two-electrode electrochemical cell by a direct current power supply (IT6154, ITECH, Nanjing, China) at 5 °C with a 9 cm2 graphite foil serving as the cathode. The morphology and chemical composition of the NPAs were characterized using field emission scanning electron microscopy (FESEM; Nova. 400 Nano-SEM, FEI, Hillsboro, OR) and Physical Electronics PHI 5802 X-ray photoelectron Spectrometer (Perkin-Elmr Corporation, Eden Prairie, MN). The micro images of the NPAs were obtained in “tapping mode” by atomic force microscope (AFM) Agilent 5500 (Agilent Technologies, Chandler, AZ) with a scanning range of 3 μm. The photocatalytic activities of the NPAs on stainless steel surface were estimated by degradation of 2 mg/L methylene blue (MB) in a Pyrex reactor under visible light (≥420 nm) using an artificial sunlight simulator of 20 mW/cm2 with an ultraviolet filter. The concentrations of MB during the photocatalytic reactions were determined by monitoring the changes of the main absorbance maximized at 664 nm. The corrosion resistance of stainless steel was evaluated by electrochemical potentiodynamic polarization with a CHI650b potentiostat in 3.5 wt% NaCl solution. A saturated calomel reference electrode (SCE) and a graphite counter electrode were used throughout the electrochemical polarization.
III. RESULTS AND DISCUSSION
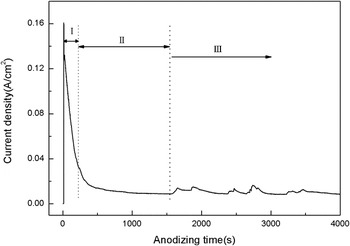
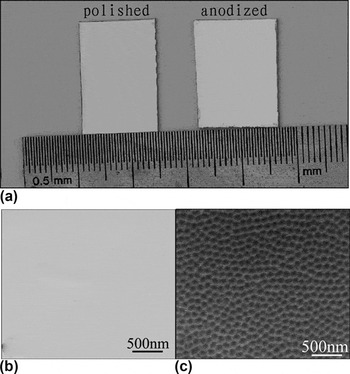
Electrochemical anodization is carried out in EG solution containing 3, 5, 7, and 10 vol% HClO4 respectively, at a constant voltage of 40 V for 10 min. Electrochemical anodization is maintained at temperature of 5 °C to impede the volatilization of perchloric acid. As shown in Fig. 1(a), an ordered nanoporous structure was shown after 3 vol% HClO4 [Figs. 1(a)–1(d)]. The depth of 23, 26, 21, and 23 nm were observed using AFM analyzing for the nanoporous structure, which indicated that the maximum depth of the NPAs is obtained in 5 vol% HClO4 EG solution. Figures 2(a)–2(d) shows AFM images of the surface microstructure at different anodization voltages, 20, 30, 40, and 50 V respectively in 5 vol% HClO4 EG solution for 10 min. The ordered pattern of NPAs does not occur until the anodization voltage goes above 30 V. However, when the voltage reaches 50 V or higher, the same results in surface ablation, which in turn destroys the NPAs formed on the surface. The average diameter and depth of NPAs at 40 V are much larger than those formed at 30 V. Therefore, the voltage of 40 V was chosen for anodization. It can be seen from the 2D image in Fig. 2(c) that ordered NPAs are formed on AISI 304 stainless steel surface organized in a perfect honeycomb pattern, which is composed of infinite spreading of polygons with an average diameter of 150 nm. To further understand the formation of the NPAs on the surface of stainless steel, a series of anodization times were investigated in 5 vol% HClO4 EG solution at 40 V as shown in Figs. 3(a)–3(d). Current densities at 40 V during anodization can be divided into three stages (Fig. 4). The initial oxide layer grows to nanoporous array. Then the formation and dissolution of oxide layer shifts from equilibrium to unstable competition between the electrochemical oxide layer formation on the one hand and dissolution in the electrolyte solution on the other. The NPAs pattern is formed at the initial stage of 3 min [Fig. 3(a)]. The evolution of surface morphology shows that the diameter of NPAs remains almost unchanged at all stages while the depth of NPAs increases merely in the beginning 10 min. With anodization time extended to 60 min [Fig. 3(c)], the boundary of the polygonal nanopores becomes blurred, and the depth of nanoporous structure decreases from 26 nm to 13 nm. The NPAs pattern is seriously distorted at longer anodization time of 180 min for the dissolution of the boundary [Fig. 3(d)]. This should be ascribed to the competition between electrochemical oxide layer formation and dissolution in perchloric acid EG solution. The results are consistent with the current density fluctuations. It is interesting to note that the formation of NPAs does not damage the polished appearance of stainless steels [Fig. 5(a)]. The specimen of AISI 304 stainless steel with NPAs [Fig. 5(c)] still possesses a highly polished surface, which shows no significant difference from that of the mechanically polished specimen with the pristine polished surface being still under microscopic observation [Fig. 5(b)], after anodization in 5 vol% HClO4 EG solution at 40 V for 10 min.
AFM images of NPAs on stainless steel specimens prepared by anodization at potential of 40 V for a duration of 60 min at 5 °C, in EG containing (a) 3 vol% HClO4; (b) 5 vol% HClO4; (c) 7 vol% HClO4; (d) 10 vol% HClO4.

AFM images of stainless steels prepared by anodization in 5 vol% HClO4 EG solution, for 10 min at 5 °C, at potential of 20 V (a); 30 V (b); 40 V (c); 50 V (d); inset in (c): 2D image of NPAs at potential of 40 V.

AFM images of stainless steels prepared by anodization in 5 vol% HClO4 EG solution at potential of 40 V at 5 °C, for a duration of 3 min (a); 10 min (b); 30 min (c); 180 min (d).

Current densities of the specimen prepared in 5 vol% HClO4 EG solution at 40 V for 180 min at 5 °C. Step I, formation of the initial oxide layer; Step II, steady state of the balance between formation and dissolution of oxide layer; Step III, Competition between formation and dissolution of oxide layer.

The photo of the polished and anodized AISI 304 stainless steels (a); The FE-SEM of the polished AISI 304 stainless steel (b); the FE-SEM of the AISI 304 stainless steel anodized in 5 vol% HClO4 EG solution at potential of 40 V at 5 °C for 10 min (c).

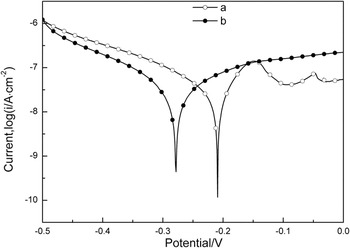
The anodized stainless steel shows almost comparable corrosion resistance with that of pristine AISI 304 stainless steel as estimated by electrochemical polarization curves. As shown in Fig. 6, the electrochemical polarization curves of the mechanically polished specimen and the specimen prepared by anodization in 5 vol% HClO4 EG solution at potential of 40 V at 5 °C for 10 min are illustrated in Fig. 5. Prior to test, the specimens were immersed in 3.5 wt% NaCl solution for 60 min to stabilize the open circuit potential. The corrosion potential (Ecorr) of the anodized specimen (Ecorr = −0.278 V) was slightly lower than that of the mechanically polished specimen (Ecorr = −0.209 V). The corrosion current density (icorr) of the anodized specimen (icorr = 4.432 × 10⁻⁸ A/cm2) was slightly higher than that of the mechanically polished specimen (icorr = 3.777 × 10⁻⁸ A/cm2).
Electrochemical polarization curves obtained in a 3.5% NaCl solution of the mechanically polished AISI 304 stainless steel and the AISI 304 stainless steel anodized in 5 vol% HClO4 EG solution at potential of 40 V at 5 °C for 10 min.

XPS experiments were conducted after a 3-nm-thick surface layer was removed by argon (Ar) ion beam sputtering, to examine the chemical composition of the anodic stainless steel surface after anodization in 5 vol% HClO4 EG solution at 40 V for 10 min. All spectra were calibrated using the adventitious C 1 s peak with a fixed value of 284.5eV. The results as shown in Fig. 7 indicate the presence of O, Fe, Cr and Ni atoms, but Ni is almost free at the anodization layer. Figure 7(d) shows that a high O content (∼76 at.%) is observed on the outmost surface and remains almost unchanged in 12 nm. A sudden decrease of O content to nearly zero occurs below the depth of 24 nm. The contents of Fe, Cr and Ni are estimated to be ∼15 at.%, ∼10 at.%, and ∼1 at.% respectively in electrochemically formed NPAs. The contents of Fe, Cr and Ni are also remarkably changed at depth of 24 nm, confirming the depth of NPAs estimated above. The high-resolution spectra of O 1 s, Fe 2p and Cr 2p were all analyzed in the depth of 24 nm and 60 nm, corresponding to oxide layer and metallic layer respectively. The O1s peaks in Fig. 7(a) reveal two distinct components with the binding energy (BE) at 529.5eV and 531.5eV, respectively, attributable to oxygen atoms in an oxide and hydroxide at 24 nm.Reference Nair, Tripathi and Samdarshi29, Reference Liang, Cui, Zhu and Yang30 A horizontal line is observed at 60 nm, which is associated with oxygen free metal alloy. As shown in Fig. 7(b), the peaks at 24 nm centered at 711eV and 724.5eV should be attributed to Fe 2p 3/2 and Fe 2p 1/2Reference Qu, Kobayashi and Komatsu31 of Fe3+ in Fe2O3 and FeOOH, respectively. And the BE of Fe 2p is consistent with the O 1 s spectra. The Fe 2p core level spectra demonstrate that the BE at 24 nm is higher in than that at 60 nm with BE at 706.75eV and 719.75eV, which is ascribed to Fe atoms in metal alloy. The Cr 2p core level peaks in Fig. 7(c) (Refs. Reference Elsener, Addari, Coray and Rossi32 and Reference Doff, Archibong, Jones, Korolev, Skeldon and Thompson33) at 576.9 eV and 586.7 eV correspond to Cr 2p 3/2 and Cr 2p 1/2 lines of Cr2O3 at 24 nm respectively. While the peaks at 574 eV and 583.2 eV depict the Cr atoms in metal alloy at 60 nm. Ni is almost absent in the NPAs because it’s more readily to dissolve than iron and chromium during electrochemical anodization. The ClO4ˉ negative ion can break the electrochemically oxide overlayer and leads to substantial dissolution of the oxide under high value of applied potential. The NPAs formed on the stainless steel surface are the result of competition between formation and dissolution of the oxide overlayer. From XPS quantitative analysis, the Cr/Fe atom ratio in NPAs layer is ∼0.68. In contrast, the Cr/Fe atom ratio is ∼0.27 in the metallic alloy. This result is in agreement with the previous reportsReference Diaz, Sevilla, Galan, Escolar, Engel and Gil27, Reference Taveira, Montemor, Belo, Ferreira and Dick28 that the Cr-rich oxide overlayer was formed on the surface of stainless steel after anodization.
High resolution spectra of depth profiling of NPAs on stainless steel prepared by anodization at potential of 40 V in 5 vol% HClO4 EG solution at 5 °C with 10 min obtained by XPS for O1s (a); Fe2p (b); Cr2p (c); and atomic concentration (d).

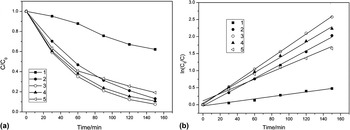
MB is chosen as the model contaminant to evaluate the photocatalytic activities of the anodized stainless steel due to its stability under visible-light irradiation. The specimens are immersed in MB solution in darkness for 2 h before the photocatalytic degradation experiments. As shown in Fig. 8, the degradation of MB is carried out on NPAs that are formed at anodization times of 3 min, 10 min, 30 min and 180 min respectively with potential of 40 V in 5 vol% HClO4 EG solution. Figure 8(a) shows that the NPAs on anodized specimens exhibit remarkable photocatalytic activities. The specimen after 10-min anodization time exhibits the highest photocatalytic activity due to its maximal nanopore depth in all specimens. 3 min-anodized sample has faster reaction rate then the 180-min anodized sample. The photocatalytic activities of 3 min-anodized and 180 min-anodized specimens are very close. An intersection of their photodegradation curves is observed. Figure 8(b) shows the pseudo-first-order kineticsReference Zhang, Hossain and Takahashi23 of the MB degradation under visible light irradiation expressed by the linear transforms ln (C0/C) = f(t) = kt, where k is the reaction rate constant, C0 and C are the initial and the reaction concentrations of the MB solution. The reaction rates of MB degradation are calculated to be 0.0034, 0.01348, 0.01724, 0.01497 and 0.01065 min−1, with regression coefficients of 0.9747, 0.99791, 0.99979, 0.99705, 0.97242, for self degradation of MB, and MB photodegradation over anodized stainless steels in the time values of 3 min, 10 min, 30 min and 180 min respectively. The remarkable photocatalytic activity of the anodized stainless steels should be attributed to photocatalytic performance of Fe2O3Reference Mor, Prakasam, Varghese, Shankar and Grimes18 and the heterojunction consisting of Fe2O3 and Cr2O3,Reference Ferreira, Hakiki, Goodlet, Faty, Simoes and Belo34, Reference Hakiki35 The crystal structure of passive films on Fe-Cr alloys was first found by McBee and Kruger in 1972.Reference McBee and Kruger36 The structure of oxide films formed on AISI 304 stainless steel is comparable to that of a heterojunction with two interfacial regions of an inner chromium oxide region and an outer iron oxide and hydroxide regionReference Xiong, Joly, Holtom, Wang, McCready, Beck and Hess37. Since the ionic radius of Cr3+ and Fe3+ are 0.064 nm and 0.067 nm respectively, Cr2O3 can enter the lattices of crystalline Fe2O3 to form solid solution.Reference Chen and Lu38 The band gap energy is 2.2 eV and 4.8 eV for Fe2O3 and Cr2O3 respectively. Under light radiation (4.8 eV > hν> 2.2 eV), electrons in the valence band (VB) of Fe2O3 are excited to conduction band (CB) and leave the same amount of holes in VB. The VB energy of Cr2O3 is lower than that of Fe2O3, the holes will diffuse to Cr2O3 layer, whereas the electrons remain in Fe2O3 layer. Consequently, the staggered band of Cr2O3/Fe2O3 promotes the dissociation of e−/h+ pairs generated from Fe2O3 layerReference Chambers, Williams, Henderson, Joly, Varela and Pennycook39. Moreover, the large surface/volume ratio of NPAs further enhances the photocatalytic activity.
(a) The photocatalytic activity, and (b) the reaction kinetics of MB degradation under visible light radiation for self degradation without catalyst (1); the stainless steel anodized for 3 min (2); 10 min (3); 30 min (4); 180 min (5).

IV. CONCLUSION
We have demonstrated the formation of NPAs on the surface of AISI 304 stainless steel by anodization in EG solution containing perchloric acid. Perchloric acid concentration, applied voltage and anodization time of anodization process were investigated. The maximum depth of anodic overlayer was 26 nm composed of Fe2O3 and Cr2O3 after anodization in 5 vol% HClO4 EG solution at 40 V for 10 min. The anodized stainless steel shows significant visible-light photocatalytic activities, which should be attributed to the photocatalytic performance of Fe2O3 and the Fe2O3–Cr2O3 heterojunction. Moreover, the formation of NPAs does not damage the polished appearance of stainless steels and retains good corrosion resistance.
ACKNOWLEDGMENTS
This work was supported by National Natural Science Foundation of China (No.50771075, No.51171133) and the Program for New Century Excellent Talents in University (No. NCET-07-0650). And we would like to thank Mr. X.M. Zhang for the technical support during this study.