Introduction
The capability to accurately identify the emotions expressed by others is a precondition for understanding one another and for making satisfactory mutual adjustments. This capability is often impaired in schizophrenia. A large body of literature has accumulated on this issue, and most studies have focused on the recognition of emotional facial expression (Edwards et al. Reference Edwards, Jackson and Pattison2002; Kohler & Martin, Reference Kohler and Martin2006). There is a general consensus that patients with schizophrenia show deficits in recognizing facial expression of emotions in most tasks. Although many studies have not reported performance for individual emotion categories, it has been suggested that happiness, surprise, fear and sadness are recognized more poorly than other emotion categories; however, reports are contradictory (Edwards et al. Reference Edwards, Jackson and Pattison2002). There is evidence that deficits in recognizing emotion in facial expressions are greater during acute psychosis than after remission (Gessler et al. Reference Gessler, Cutting, Frith and Weinman1989; Gaebel & Wolwer, Reference Gaebel and Wolwer1992). One study showed an increased impairment in advanced as compared to first-episode schizophrenia (Kucharska-Pietura et al. Reference Kucharska-Pietura, David, Masiak and Phillips2005), and the deficit seems to be correlated with general cognitive deficits in schizophrenia (Bozikas et al. Reference Bozikas, Kosmidis, Anezoulaki, Giannakou and Karavatos2004; Sachs et al. Reference Sachs, Steger-Wuchse, Kryspin-Exner, Gur and Katschnig2004). Reports on differences concerning paranoid and non-paranoid schizophrenia are contradictory (Edwards et al. Reference Edwards, Jackson and Pattison2002). Most studies, however, have neither differentiated between schizophrenia subtypes nor reported the ratio of subtypes in their samples.
Beyond facial expression, emotional prosody (i.e. speech melody) is another important source for non-verbal emotional communication. Several studies have addressed deficits in schizophrenia in order to identify emotional prosody using different kinds of stimuli (Edwards et al. Reference Edwards, Pattison, Jackson and Wales2001, Reference Edwards, Jackson and Pattison2002; Kucharska-Pietura et al. Reference Kucharska-Pietura, David, Masiak and Phillips2005; Leitman et al. Reference Leitman, Foxe, Butler, Saperstein, Revheim and Javitt2005; Bozikas et al. Reference Bozikas, Kosmidis, Anezoulaki, Giannakou, Andreou and Karavatos2006; Matsumoto et al. Reference Matsumoto, Samson, O'Daly, Tracy, Patel and Shergill2006). These studies found evidence for impaired recognition in acute and chronic schizophrenia. Deficits in emotional prosody identification have been linked to impaired performance in basic auditory perception (Leitman et al. Reference Leitman, Foxe, Butler, Saperstein, Revheim and Javitt2005, Reference Leitman, Hoptman, Foxe, Saccente, Wylie, Nierenberg, Jalbrzikowski, Lim and Javitt2007; Matsumoto et al. Reference Matsumoto, Samson, O'Daly, Tracy, Patel and Shergill2006), negative symptoms (Bozikas et al. Reference Bozikas, Kosmidis, Anezoulaki, Giannakou and Karavatos2004), illness duration (Kucharska-Pietura et al. Reference Kucharska-Pietura, David, Masiak and Phillips2005) and male gender (Bozikas et al. Reference Bozikas, Kosmidis, Anezoulaki, Giannakou, Andreou and Karavatos2006). Differences between paranoid and non-paranoid schizophrenia have been reported equivocally (Edwards et al. Reference Edwards, Jackson and Pattison2002), although, as in research on facial expression, most studies did not report schizophrenia subtypes. Specificity of deficits with regard to emotion categories has been reported ambiguously. Some studies did not analyse performance in individual emotion categories (Leitman et al. Reference Leitman, Foxe, Butler, Saperstein, Revheim and Javitt2005; Matsumoto et al. Reference Matsumoto, Samson, O'Daly, Tracy, Patel and Shergill2006; also see Edwards et al. Reference Edwards, Jackson and Pattison2002 for an overview), whereas others have suggested deficits in recognizing sadness (Murphy & Cutting, Reference Murphy and Cutting1990), sadness and fear (Edwards et al. Reference Edwards, Pattison, Jackson and Wales2001), sadness, anger and surprise (Bozikas et al. Reference Bozikas, Kosmidis, Anezoulaki, Giannakou, Andreou and Karavatos2006), and negative emotions in general (Kucharska-Pietura et al. Reference Kucharska-Pietura, David, Masiak and Phillips2005).
To summarize, although there is good evidence that emotional prosody identification is often impaired in schizophrenia, reports on specificity are contradictory between studies. In the present study, we focused on two possible explanations for this ambiguity.
As prosodic stimuli, almost all studies used sentences with neutral content spoken with emotional intonation. This means that vocal and verbal information can be inconsistent. Inconsistency between verbal and vocal information can, for example, induce specific neural responses (Mitchell et al. Reference Mitchell, Elliott, Barry, Cruttenden and Woodruff2003). The importance of such inconsistencies in everyday language is easily illustrated with examples such as ‘Great job!’, which might be understood as sarcasm when tone of voice contradicts verbal meaning (Schirmer & Kotz, Reference Schirmer and Kotz2006). Low performance in identifying the vocal meaning of such a stimulus could therefore reflect a deficit in emotion recognition and also a deficit in dealing with inconsistent information. Such inconsistency might be present only in specific emotion categories that would eventually be more difficult to identify. There are two possibilities to prevent such inconsistencies: the filtering of vocal stimuli to render the semantic content incomprehensible (Kotz et al. Reference Kotz, Meyer, Alter, Besson, von Cramon and Friederici2003), or the use of nonsense syllables spoken with affective intonation (Grandjean et al. Reference Grandjean, Sander, Pourtois, Schwartz, Seghier, Scherer and Vuilleumier2005; Sander et al. Reference Sander, Grandjean, Pourtois, Schwartz, Seghier, Scherer and Vuilleumier2005; Bach et al. Reference Bach, Grandjean, Sander, Herdener, Strik and Seifritz2008). To our knowledge, such stimuli have only been used in one early study on emotional prosody identification in schizophrenia that, however, did not report performance in individual emotion categories (Turner, Reference Turner and Davitz1964).
Another possible explanation for contradictory reports on deficit specificity refers to the clarity of stimuli, which often differs between emotion categories. Contrary to an intuitive assumption, there is evidence that deficits in the recognition of emotions in facial expression are more pronounced when the expressed emotion is easier to recognize for healthy participants (Kohler et al. Reference Kohler, Turner, Bilker, Brensinger, Siegel, Kanes, Gur and Gur2003). In this study, both patients with schizophrenia and healthy control participants performed better on high-intensity than on low-intensity stimuli, but the relative performance deficit of patients with schizophrenia increased when cues were easier to identify. There are, however, no studies so far examining whether this effect is limited to the processing of emotional facial expression or part of a more general pattern of emotional processing in schizophrenia.
The purpose of the present study was therefore (a) to examine emotional prosody identification using nonsense syllables in order to avoid inconsistencies between vocal and verbal meaning. Furthermore, this study was aimed at (b) testing the hypothesis that, similar to identification of emotional facial expression, patients with schizophrenia do not profit from greater clarity of stimuli to the extent that healthy individuals do.
To achieve these goals, a set of prosodic stimuli was used that had been validated previously in healthy participants (Banse & Scherer, Reference Banse and Scherer1996). This carefully selected set comprises both high- and low-clarity stimuli for the emotions of fear, sadness, anger and happiness. To control for deficits in the visual modality, we used a simple facial expression identification task, the Facial Affect Computer Task (FACT), that had been used in previous studies on schizophrenia (Feinberg et al. Reference Feinberg, Rifkin, Schaffer and Walker1986; Edwards et al. Reference Edwards, Pattison, Jackson and Wales2001). As schizophrenia is a relatively broad diagnosis comprising subtypes with specific symptoms and deficits, differences in sample composition might further add to equivocal results between studies. We therefore aimed at limiting our findings to the most frequent subgroup, paranoid schizophrenia. To exclude the possibility that our findings would be due to patient status rather than to the specific illness, a clinical control group with unipolar depression was also included.
Method
Study design
The emotional prosody identification task followed a three-way ANOVA design with the within-subjects factors emotion category and emotion clarity, and the between-subjects factor group. Planned contrasts were performed to compare patients with schizophrenia with both other groups. As the set of prosodic stimuli that was used here comprised emotion categories with and without graded clarity, a first analysis was performed on all six emotion categories while not accounting for clarity, and a second analysis on the four clarity-graded emotion categories.
The facial expression identification task used a two-way ANOVA design with the within-subjects factor emotion category, and the between-subjects factor group. The other three facial control tasks followed a one-way ANOVA design with the between-subjects factor group.
Participants
Twenty-five patients with paranoid schizophrenia and 25 healthy control participants were studied, and 25 patients with unipolar depression served as a clinical control group. Exclusion criteria for all participants were psychiatric co-morbidity, known organic brain damage, mental retardation, epilepsy, current drug or alcohol abuse, and non-fluent command of the German language. This was checked by interview for all participants, and additionally by screening patients' clinical documentation.
Patients were recruited as in-patients in the University Hospital for Psychiatry, Bern, Switzerland. Diagnoses were made by the treating clinician and confirmed by a clinically trained member of the study group (D.R.B.). Patients with paranoid schizophrenia were required to have a clinically confirmed diagnosis according to the ICD-10 (WHO, 2004), as indicated by a predominance of delusions and/or auditory hallucinations. To ensure a stable diagnosis, it was also required that the retrospectively assessed onset of first symptoms was more than a year ago. Symptoms were assessed with the Positive and Negative Symptom Scale (PANSS; Kay et al. Reference Kay, Fiszbein and Opler1987). Patients with depression fulfilled the ICD-10 criteria for unipolar depression. Symptoms were additionally assessed with the Beck Depression Inventory (BDI; Hautzinger et al. Reference Hautzinger, Bailer, Worall and Keller1994) and the 21-item version of the Hamilton Depression Rating Scale (HAMD; Hamilton, Reference Hamilton1960). All patients were approached as soon as the treating clinician judged them to be able to give informed consent and to maintain attention for the required amount of time (about 2×15 min). Healthy control participants were recruited from the general population by advertisement and were given no reward for their participation.
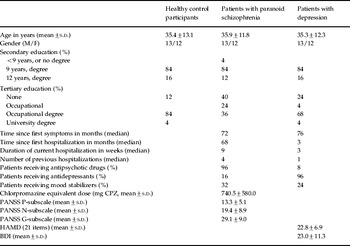
The three groups were matched for gender and age with a maximum difference of 5 years within each triple. As it has been speculated that education might influence emotional cue identification, all but two triples were also matched for secondary education. This was achieved by drawing from a larger participant pool the best-matching healthy and depressive participant for each patient with schizophrenia. Sociodemographic and illness-related characteristics of the sample, including chlorpromazine equivalent (CPZ) doses, are listed in Table 1. All participants gave written informed consent, and the study was approved by the local ethics committee (Kantonale Ethikkomission Bern).
Sociodemographic and illness-related data for the study participants

M, Male; F, female; s.d., standard deviation; PANSS, Positive and Negative Symptom Scale; HAMD, Hamilton Depression Rating Scale; BDI, Beck Depression Inventory.
Emotional prosody tasks
For the emotional prosody identification task, stimuli from a validated set of Banse & Scherer (Reference Banse and Scherer1996) were used. The original work was concerned with acoustic profiles in vocal emotion expression that addressed the emotions fear, sadness, anger, disgust, neutral affect, and happiness. In the original set, 12 professional actors performed the emotions. There were two sentences for each emotion and clarity level, and each sentence was performed twice in two different eliciting scenarios. From the whole set, items were selected on the basis of expert ratings by an independent group of 12 actors. Those items were then included in a recognition study with naïve participants. Into that recognition study, stimuli were included also from actors who did not perform well on all emotions but only on some. To minimize variance caused by low-level acoustic features, we used only stimuli from the two actors (one male, one female) who performed the whole set of emotions. Therefore, the stimulus set used in the present study comprised only a part of the original set. Nine additional stimuli performed by a different actor were used as practice items for the present study.
Hence, there were eight items for each clarity level of the clarity-graded emotions, for two actors, two sentences, and two scenarios. For neutral and disgust, there were two different items from each actor/sentence/scenario combination, adding up to 16 items, to keep the total number of items per emotion category constant. The sentences were ‘Hat sundig pron you venzy’ and ‘Fee gott laish jonkill gosterr’. These meaningless sentences comprise phonemes from several Indo-European languages and resemble normal speech. According to the validation study, ‘listeners generally have the impression of listening to an unknown foreign language’ (Banse & Scherer, Reference Banse and Scherer1996).
Thus, the emotional prosody task used 96 stimuli expressing fear, sadness, anger, disgust, neutral affect, and happiness. Only stimuli for fear, sadness, anger, and happiness were graded in two clarity categories. It should be noted here that, in the original study, high-intensity sadness (despair) was recognized more poorly than lower-intensity sadness. Therefore, it seemed appropriate to classify the stimuli according to their clarity rather than to their intensity.
Each stimulus was about 2 s in length. Stimuli were presented in randomized order. Participants responded by selecting the appropriate emotion category. They had as much time to respond as they needed, but the presentation could not be repeated. Most participants required about 15 min for the whole task.
Facial Affect Computer Task (FACT)
Identification of emotional expression in faces was used as a control paradigm. A computerized task was adapted from a study by Feinberg et al. (Reference Feinberg, Rifkin, Schaffer and Walker1986) on schizophrenia and affective disorders; this task had also been used in a well-controlled experiment on emotional prosody and facial expression recognition in first-episode schizophrenia by another study group (Edwards et al. Reference Edwards, Pattison, Jackson and Wales2001). As the original Feinberg task comprised seven emotion categories, including surprise, we also used seven emotions for comparability across studies. This, however, rendered the facial expression tasks slightly more difficult than the prosody task, for which only six emotion categories were available.
In addition to identification of emotional expression in faces, the FACT includes facial expression discrimination, face discrimination and reversed face discrimination. Those tasks were also used in the present study.
Twenty-one slides from the Pictures of Facial Affect (Ekman & Friesen, Reference Ekman and Friesen1975) were selected, showing photographs of three actors (MF1, NR1, C1) with standardized poses of fear, sadness, anger, disgust, neutral affect, surprise, and happiness. All faces were presented with a vertical visual angle of about 7° on a white background. Stimulus order was randomized for each participant. As in the prosody identification task, participants had as much time to respond as they needed, but the presentation could not be repeated.
FACTs 1 and 2
These tasks were designed to examine facial identity discrimination regardless of emotional content. On each trial, two faces were shown sequentially with an interstimulus interval (ISI). Both tasks used faces of two female actors (MF1 and NR1) with a close resemblance to each other regarding hair, facial size and complexion. Every emotion was paired with every other emotion. There were 10 pairs of the same actor, and 11 pairs of different actors. Participants had to select whether they saw the same person or not. In FACT 1, they saw the faces upside-down. Because FACT 1 is more difficult than the other tasks, each face was presented for 2000 ms in FACT 1 and for 500 ms in FACT 2 with an 1000 ms ISI. This is in accordance with previous studies using FACT.
FACT 3
This was a facial expression discrimination task. On each trial, two faces were shown sequentially for 500 ms with an ISI of 1000 ms. Participants saw 42 combinations of three actors, of which 21 pairs had the same emotion (each emotion was repeated three times in different pairs of actors) and 21 had different emotions (each emotion was paired once with each of the other emotions). Participants selected if they had seen the same emotion in both faces or not.
FACT 4
In the proper facial expression identification task, participants were shown all 21 slides for 500 ms and had to select the appropriate emotion category from a set of seven categories.
Procedure
As we were mainly interested in emotional prosody identification and used the FACT as the control task, the order of the tests was constant for all participants. After completing the emotional prosody identification task, FACTs 1–4 were conducted.
Apparatus
All experiments were programmed in e-prime version 1.1.4.4 (Psychology Software Tools, Pittsburgh PA, USA) and run on a laptop using Windows XP with a 14-inch LCD screen. Auditory stimuli were presented through headphones (SBC HP800, Philips, Amsterdam, The Netherlands). In all tasks, participants selected the correct response with a computer mouse. Data extraction was conducted using R (www.r-project.org).
Statistical analysis
To test the hypothesis that patients with paranoid schizophrenia perform worse than both healthy control participants and the clinical control group, the following a priori contrasts were defined for the group factor in all analyses and were tested simultaneously: (1) healthy control participants versus patients with paranoid schizophrenia, and (2) patients with depression versus patients with paranoid schizophrenia.
Emotional prosody identification was analysed using a 3 (group) × 6 (emotion) repeated-measures ANOVA in the GLM procedure of SPSS version 12.0 (SPSS Inc., Chicago, IL, USA). For emotions with high- and low-clarity stimuli, both clarity levels were collapsed for this analysis. Performance differences in single emotion categories were tested as a priori contrasts for deviation from the group mean.
Influence of emotion clarity on emotional prosody identification was analysed using a 3 (group) × 4 (emotion) × 2 (emotion clarity) repeated-measures ANOVA, using only emotions with high- and low-clarity stimuli (i.e. excluding disgust and neutral affect). Performance differences in both levels of clarity were tested separately as a priori contrasts.
Facial expression identification was analysed using a 3 (group)×7 (emotion) repeated-measures ANOVA. Performance differences in single emotion categories were tested as a priori contrasts for deviation from the group mean.
The results for facial expression discrimination, face discrimination and reverse face discrimination were calculated as overall task performance and analysed using a one-way ANOVA with three levels for the group factor.
To assess the association of emotional prosody identification with identification of emotional facial expression, gender, and disorder-related variables (PANSS subscales, CPZ equivalents, time since illness onset, time since first hospitalization, number of hospitalizations, duration of current hospitalization), those were entered into a multiple regression model in SPSS. Forward, backward and stepwise methods were compared and led to the same results.
As one previous study found an effect of gender on emotional prosody identification in schizophrenia (Bozikas et al. Reference Bozikas, Kosmidis, Anezoulaki, Giannakou and Karavatos2004), gender was introduced into all ANOVAs as an independent parameter in an exploratory analysis. As there were no main or interaction effects of gender, the results from these analyses are omitted here.
Results
Emotional prosody identification
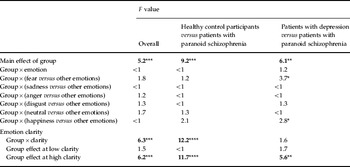
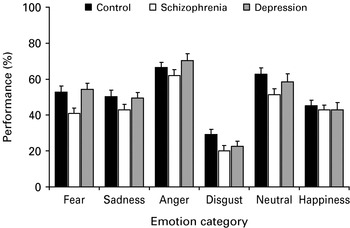
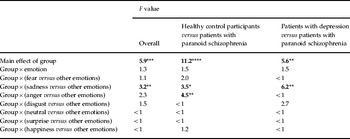
Identification of emotional prosody was significantly impaired in patients with schizophrenia compared to both healthy control participants and patients with depression (Tables 2 and 3, Fig. 1). This performance deficit was not significantly different for any particular emotion category compared to the mean of all categories. There was a trend towards significance for the contrast between patients with schizophrenia and patients with depression concerning performance in happiness and fear identification. Descriptively, the performance difference between patients with schizophrenia and depression was not as large for happiness as for the other emotion categories, and it was greater for fear than for the other emotions. In other words, although patients with depression generally performed better than patients with schizophrenia, they performed much better in the recognition of fear, whereas the performances of the two groups were more similar in the identification of happiness.
Results of the ANOVAs on emotional prosody identification and on the influence of emotional prosody clarity (n=25 per group, df=1, 72 for the overall main effect of group, df=10, 360 for the overall interaction group×emotion, df=2, 72 for overall contrasts on the interaction group×emotion, df=1, 72 for group differences in individual emotion categories). Contrasts for single emotion categories show group differences for deviations from the respective group mean. Contrasts for low and high clarity show group differences calculated separately for both levels of clarity

df, degrees of freedom.
Bold face denotes significant results.
* p<0.10, ** p<0.05, *** p<0.01, **** p<0.001.
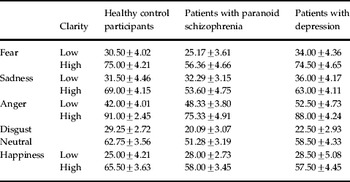
Performance (in percentage correct responses) for the emotional prosody identification task

Values given as mean±standard error of the mean.
Performance (in percentage correct responses) of healthy control participants, patients with paranoid schizophrenia, and patients with unipolar depression in emotional prosody identification. For emotions with high- and low-clarity stimuli (fear, sadness, anger, and happiness), the results are averaged across clarity levels. Statistical analyses are summarized in Table 2.

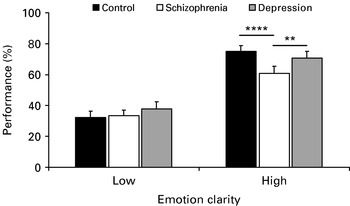
In a three-way ANOVA model including group, emotion category and emotion clarity, there was a strong group×clarity interaction. That is, the influence of emotion clarity on emotional prosody identification was less pronounced in patients with schizophrenia than in healthy control participants (Tables 2 and 3, Fig. 2). Although the performance of these groups did not differ for low-clarity stimuli, patients with schizophrenia performed worse than healthy control participants on high-clarity stimuli. In other words, the performance deficit of patients with schizophrenia was only present in high-clarity stimuli, and not in low-clarity stimuli. There was no difference between patients with schizophrenia and patients with depression in the overall effect of emotion clarity. Separate contrasts on low- and high-clarity stimuli revealed, however, a better performance for patients with depression on high-clarity stimuli compared to patients with schizophrenia, and no difference on low-clarity stimuli.
Interaction of emotion clarity and group for the emotions with low- and high-clarity stimuli (fear, sadness, anger, and happiness). Statistical results are summarized in Table 2. Separate contrasts for the clarity levels: ** p<0.05, **** p<0.001.

Identification of emotional facial expression
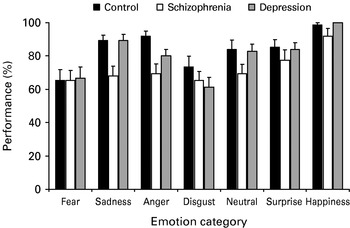
Identification of emotional facial expression was significantly impaired in patients with schizophrenia compared to both healthy control participants and patients with depression (Table 4, Fig. 3). Compared to healthy control participants, this overall deficit was significantly more pronounced for anger than for the other categories. For sadness, there was a trend towards a greater deficit compared to healthy controls, and the deficit was significantly greater compared to patients with depression.
Results of the ANOVAs on facial expression identification (i.e. FACT 4; n=25 per group, df=1, 72 for the overall main effect of group, df=12, 432 for the overall interaction group×emotion, df=2, 72 for overall contrasts on the interaction group×emotion, df=1, 72 for group differences in individual emotion categories). Contrasts for single emotion categories show group differences for deviations from the respective group mean

FACT, Facial Affect Computer Task; df, degrees of freedom.
Bold face denotes significant results.
** p<0.05, *** p<0.01, **** p<0.001.
Performance (in percentage correct responses) of healthy control participants, patients with paranoid schizophrenia, and patients with unipolar depression in facial expression identification. Statistical analyses are summarized in Table 3.

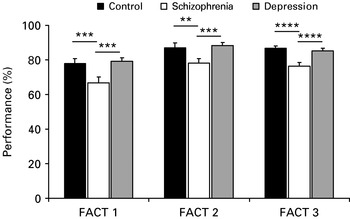
Facial expression discrimination, face discrimination and reverse face discrimination were also significantly impaired in patients with schizophrenia compared to both healthy control participants and patients with depression (Fig. 4).
Performance (in percentage correct responses) of healthy control participants, patients with schizophrenia, and patients with depression in reversed face discrimination [Facial Affect Computer Task (FACT) 1], face discrimination (FACT 2), and facial expression discrimination (FACT 4). ** p<0.05, *** p<0.01, **** p<0.001.

Association of emotional prosody identification with other parameters
A multiple regression model on emotional prosody identification in patients with schizophrenia was calculated including facial expression identification, gender and illness-related parameters as predictors. The best model fit was achieved using only facial expression identification as the predictor (R=0.46, p<0.05). As facial expression identification might itself correlate with gender and illness-related parameters, it was excluded from the model for a second analysis. Here, a model comprising only the PANSS subscale for negative symptoms achieved the best model fit (R=0.44, p<0.05).
In an exploratory analysis, gender was also included as covariate into all ANOVA models. There was no main effect or interaction involving gender in any measure.
Discussion
Emotional prosody identification
In a first analysis of all emotion categories, averaging across clarity levels in the clarity-graded categories, participants with paranoid schizophrenia performed worse than both of the control groups. This replicates previous findings on emotional prosody identification in schizophrenia (Murphy & Cutting, Reference Murphy and Cutting1990; Edwards et al. Reference Edwards, Pattison, Jackson and Wales2001, Reference Edwards, Jackson and Pattison2002; Kucharska-Pietura et al. Reference Kucharska-Pietura, David, Masiak and Phillips2005; Leitman et al. Reference Leitman, Foxe, Butler, Saperstein, Revheim and Javitt2005; Bozikas et al. Reference Bozikas, Kosmidis, Anezoulaki, Giannakou, Andreou and Karavatos2006; Matsumoto et al. Reference Matsumoto, Samson, O'Daly, Tracy, Patel and Shergill2006). Although reports on deficits in specific emotion categories are conflicting between previous studies (Murphy & Cutting, Reference Murphy and Cutting1990; Edwards et al. Reference Edwards, Pattison, Jackson and Wales2001; Bozikas et al. Reference Bozikas, Kosmidis, Anezoulaki, Giannakou and Karavatos2004; Kucharska-Pietura et al. Reference Kucharska-Pietura, David, Masiak and Phillips2005), we found no specific deficit for any of the emotion categories. In other words, for no individual emotion category including neutral stimuli, the deficit was significantly different from the mean deficit for all categories. Although the null hypothesis cannot be proven, these results are in favour of a non-specific deficit across emotion categories. One reason for the difference between this and previous studies might be the use of nonsense syllables rather than neutral sentences as stimuli because inconsistencies between verbal and vocal content might render specific emotion categories particularly difficult. This effect is avoided by using stimuli without semantic content.
Influence of clarity on emotional prosody identification
In a second analysis, only the four clarity-graded emotion categories (fear, sadness, anger, and happiness) were included. This analysis revealed a strong clarity×group interaction for the contrast schizophrenia versus healthy participants. In other words, the influence of clarity was significantly greater in the healthy control participants than in the patients with schizophrenia, who profited less from higher clarity than the healthy participants. Separate contrasts in low- and high-clarity stimuli showed that performance differences occurred only in the high-clarity category, whereas performance in low-clarity stimuli was not significantly different between healthy control participants and patients with schizophrenia.
This result is in accordance with a previous study on facial expression of emotions (Kohler et al. Reference Kohler, Turner, Bilker, Brensinger, Siegel, Kanes, Gur and Gur2003), in which patients with schizophrenia showed less benefit than healthy participants from increased intensity of facial expression. Our results are in accordance with this finding in emotional prosody identification. An important difference between the study of Kohler et al. (Reference Kohler, Turner, Bilker, Brensinger, Siegel, Kanes, Gur and Gur2003) and ours is that, in our task, stimuli were analysed according to clarity rather than intensity. This was because in the validation study for our stimuli, high-intensity sadness was recognized less well than low-intensity sadness (Banse & Scherer, Reference Banse and Scherer1996), a finding that was replicated in the present study. A similar effect was also present in the study of Kohler et al., where extreme disgust was recognized less well than mild disgust by both participant groups. For this specific emotion, the identification deficit in schizophrenia was descriptively the same for both levels. In our study, however, the identification deficit in schizophrenia was only present in high-clarity (i.e. low-intensity) and not in low-clarity (i.e. high-intensity) sadness, similar to the other three emotion categories. In our stimulus set, therefore, clarity seemed to be the relevant factor rather than intensity. This was also reflected in an exploratory ANOVA using intensity instead of clarity as an independent factor, which revealed a still significant intensity×group interaction but a much lower F value (F=4.0, p<0.05) than the clarity×group analysis. Although this is a description of results, it does not statistically disentangle intensity and clarity. One possibility to do this would be to use stimulus intensity (within emotions) and stimulus clarity (between emotions) as independent variables. For such an analysis, it would be feasible to estimate stimulus clarity from an independent sample. This study, however, was not designed to perform such analyses and cannot therefore resolve the issue.
Our results seem to contradict the analysis of visual scan paths in patients with persecutory delusions, who in one study showed an abnormal scan pattern in pictures of ambiguous threat scenes (Phillips et al. Reference Phillips, Senior and David2000) that was more pronounced than in clearer threat scenes. However, the study by Phillips et al. did not analyse identification of the scenes, but visual path only. In addition, the stimuli used in our experiment and in the study by Kohler et al. (Reference Kohler, Turner, Bilker, Brensinger, Siegel, Kanes, Gur and Gur2003) were not directly threatening and constitute, therefore, a somewhat different stimulus category. Therefore, altered visual scan of ambiguous but not clear threat scenes might well be compatible with altered performance in high-clarity but not ambiguous emotional cues.
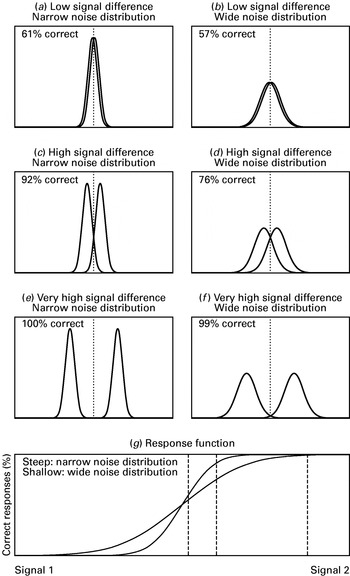
An explanation of both our results and the study by Kohler et al. (Reference Kohler, Turner, Bilker, Brensinger, Siegel, Kanes, Gur and Gur2003) refers to internal noise levels in schizophrenia. It has been proposed that part of the altered brain function in schizophrenia might be due to a reduced signal-to-noise ratio and increased statistical fluctuations in cortical brain networks, which in simulations could be explained by dysfunction in transmitter systems (Loh et al. Reference Loh, Rolls and Deco2007). We describe here, with examples from signal detection theory, how this relates to our findings. In the terminology of signal detection theory, reduced signal-to-noise ratio can be described as a broader distribution of noise in the internal representation of a given signal. This is illustrated in Fig. 5, where each of the panels (a)–(f) shows the internal representations of two external signals. The left panels show an individual with a narrow noise distribution (e.g. a healthy individual), the right panels an individual with a broad noise distribution (e.g. a patient with schizophrenia). Both individuals are assumed to have the same peaks of the internal signal representations and the same unbiased response criterion (depicted as a dashed line). Panels (a)/(b), (c)/(d) and (e)/(f) compare these two individuals on a hypothetical two alternative forced-choice recognition task. In this example (and similar to the present study), correct responses refer to the sum of hit rate and correct rejection. It can be shown that when the two signals are fairly similar [i.e. panels (a)/(b), low signal difference], the difference in correct responses between the two groups is small. As the distance increases, so does the group difference [i.e. panels (c)/(d), high signal difference]. At very high signal difference, the group difference again decreases [i.e. panels (e)/(f)]. The maximum group difference in this particular simulation is found when the reference (‘normal’) individual performs at around 90% correct responses. (A similar pattern is found over a wide range of noise distribution variance ratios.) Stimuli with such a high performance would have been classified as ‘high-clarity’ stimuli in the present study. Hence, the performance difference between the two individuals would be higher at ‘high clarity’ than at ‘low clarity’. Fig. 5g shows a different visualization of the same idea by depicting response curves over a transition from signal 1 to signal 2; that is, the relationship of signal strength (x axis) and performance (y axis). The dotted lines represent signal strengths that are similar to the ones in the panels above. Again, it can be seen that the maximum group difference is in the vicinity of the middle dotted line, corresponding to ‘high clarity’ in the present experiment. This is in line with a study on category transitions in emotional facial expression (Kee et al. Reference Kee, Horan, Wynn, Mintz and Green2006). In this study, two emotional expressions were morphed into each other, and response curves are reported for these transitions. Although patients with schizophrenia and normal individuals exhibited similar shift points (i.e. criteria, or response biases), the steepness of the response curves differed, and patients with schizophrenia showed shallower response curves. This can be explained by a broader internal noise distribution, and is in accordance with both the simulation depicted in Fig. 5 and the results from our study.
Simulated performance data on a hypothetical two alternative forced-choice recognition task under conditions of a narrow internal noise distribution [left (a, c, e)] and wide internal noise distribution [right (b, d, f)]. Noise is modelled as Gaussian distribution with an arbitrary standard deviation of s.d.narrow=1 and s.d.wide=2 (high noise). Signal difference is modelled as distance between the peaks of the internal signal representations and is assumed to be similar in both groups. Response criterion is assumed to be unbiased (i.e. equals the mean between the two peaks) for both groups (dashed line). (a, b) Low signal difference, distance=0.5×s.d.narrow. (c, d) High signal difference, distance=2.7×s.d.narrow. (e, f) Very high signal difference, distance=10×s.d.narrow. (g) Response curve for transitions from signal 1 to signal 2 for narrow noise distribution (steep curve) and wide noise distribution (shallow curve). Dotted lines indicate the signal relationships that are depicted in the panels above.

Although the lack of a group difference at low clarity might seem like a statistical artefact (i.e. a ‘floor effect’) at first sight, it is of clinical importance, as the very same effect would be present in everyday situations. Also in real life, differences in emotion recognition would be most distinctive at fairly high clarity of the emotional expression. It might, however, still be possible for patients with schizophrenia to accomplish very good emotion discrimination when the clarity is further increased. Therefore, although Kohler et al. (Reference Kohler, Turner, Bilker, Brensinger, Siegel, Kanes, Gur and Gur2003) conclude ‘that more extreme facial expression of emotion may not lead to better recognition in patients with schizophrenia’, the assumption of a higher internal noise level in schizophrenia would lead to the prediction that, at very high clarity, group differences would again decrease. The variance of the internal noise distribution cannot be assessed with recognition experiments, but this prediction is easy to test experimentally. Another testable prediction arises from the analysis of the discriminability parameter d′, which, according to this hypothesis and different from correct responses, should not vary with clarity.
Even though patients with paranoid schizophrenia did not benefit from stimulus clarity as healthy control participants did, there was no significant difference between patients with schizophrenia and depression in our study when the emotion clarity was analysed. This might suggest that the described deficits in schizophrenia are shared by depressive patients, and that they are linked to patient status rather than to the specific illness. However, when examining clarity levels separately, there was a significant difference between the two patient groups in high-clarity stimuli, with better performance in patients with depression. This is, albeit weak, evidence that the effect of clarity is indeed a phenomenon specific to schizophrenia. As Kohler et al. (Reference Kohler, Turner, Bilker, Brensinger, Siegel, Kanes, Gur and Gur2003) did not include a clinical control group, it is not known whether the intensity/clarity effect in facial affect identification is linked to schizophrenia or is also present in other disorders.
Control tasks
Patients with paranoid schizophrenia performed worse than both control groups in the facial expression identification task and also in the other control tasks, thus replicating findings from previous studies with the same (Feinberg et al. Reference Feinberg, Rifkin, Schaffer and Walker1986; Edwards et al. Reference Edwards, Pattison, Jackson and Wales2001) and also with different stimulus sets (see Kucharska-Pietura et al. Reference Kucharska-Pietura, David, Masiak and Phillips2005, for a well-controlled study). This deficit was particularly pronounced in anger and sadness, compared to the other emotions. The greater deficit for sadness is in line with a previous study using the same stimulus set and task (Edwards et al. Reference Edwards, Pattison, Jackson and Wales2001).
Association of emotional prosody identification with other parameters
To assess cross-modality correlations and the influence of illness-related factors on emotional prosody identification, a multiple regression model was calculated for patients with schizophrenia. Facial expression identification emerged as the best predictor for emotional prosody identification, rendering all illness-related variables redundant. This is in line with previous studies that have shown a cross-modality correlation for emotion identification (Edwards et al. Reference Edwards, Pattison, Jackson and Wales2001; Kucharska-Pietura et al. Reference Kucharska-Pietura, David, Masiak and Phillips2005).
When facial expression identification was excluded from the model, the negative symptom subscale of the PANSS emerged as the best predictor, rendering other illness-related factors redundant. This extends previous reports that identification of emotional prosody (Bozikas et al. Reference Bozikas, Kosmidis, Anezoulaki, Giannakou and Karavatos2004) and of facial expression (Sachs et al. Reference Sachs, Steger-Wuchse, Kryspin-Exner, Gur and Katschnig2004) are related to a general cognitive deficit and to stage of illness (Kucharska-Pietura et al. Reference Kucharska-Pietura, David, Masiak and Phillips2005). Although illness-related factors might also be correlated with performance, they were less predictive in this study than the negative symptom subscale. A possible reason for this is that illness-related factors converge on negative symptoms or cognitive deficits. This study was not, however, designed to explore the direction into which those factors influence each other.
No association was found between positive symptoms and emotion recognition deficits. This might be explained by the fact that partly recovered patients were examined, with relatively little between-subject variance in positive symptoms. Studies focusing on different stages of the illness might be better suited to highlight the effect of positive symptoms on emotion recognition.
Unlike a previous study on the recognition of emotional prosody (Bozikas et al. Reference Bozikas, Kosmidis, Anezoulaki, Giannakou, Andreou and Karavatos2006), we found no association of any of the performance measures with gender.
Limitations
Our results regarding the influence of emotion clarity on emotional prosody identification are highly significant and resemble a previous finding concerning facial affect identification (Kohler et al. Reference Kohler, Turner, Bilker, Brensinger, Siegel, Kanes, Gur and Gur2003). A perennial caveat of all behavioural studies on emotion identification is the assumption that deficits in explicit emotion labelling are associated with impairments in everyday life, where emotional expression of other people is usually appraised without explicit reference. These two types (or levels) of emotional appraisal recruit distinct neural structures (Bach et al. Reference Bach, Grandjean, Sander, Herdener, Strik and Seifritz2008), and impairments of patients with schizophrenia might differ depending on appraisal level. One limitation of the present study is that the influence of clarity could not be compared across modalities. Another limitation is that only four out of five non-neutral emotion categories were clarity graded because of the construction of the original stimulus set (Banse & Scherer, Reference Banse and Scherer1996). Although our results were significant for analyses using either clarity or intensity as independent parameter, clarity seemed to be a better predictor of deficits. However, the two factors could not be formally disentangled in the present study. A clinical control group was included in the present study, but evidence is somewhat weak that the clarity effect is limited to paranoid schizophrenia. In addition, the present findings are limited to paranoid schizophrenia and cannot be generalized to other subtypes of schizophrenia.
Conclusions
This study investigated emotional prosody identification with stimuli that have no verbal content, and assessed the influence of emotion clarity on performance. Facial expression identification was used as a control task. Although patients with paranoid schizophrenia performed worse on emotional prosody identification than both healthy participants and patients with depression, there was no specific deficit in any of the emotion categories. The benefit from emotion clarity was significantly reduced in patients with paranoid schizophrenia, who performed similar to healthy participants in low-clarity but worse in high-clarity stimuli. There was, albeit weak, evidence that this deficit was linked to paranoid schizophrenia rather than to patient status. Also in the facial control tasks, patients with paranoid schizophrenia performed worse than both control groups, with an increased deficit in identifying anger and sadness. In a multiple regression model in patients with paranoid schizophrenia, facial expression identification was a better predictor for emotional prosody identification than illness-related factors. When excluding this parameter from the model, the negative symptom subscale of the PANSS was the best predictor for performance in the prosody task. Taken together and in light of previous studies, our results indicate that the emotion recognition deficit of patients with schizophrenia is most impaired when the emotion is easy to recognize for healthy persons. It can be shown that such a result pattern is in line with the hypothesis that schizophrenia is characterized by high internal noise due to increased statistical fluctuations in brain networks.
Acknowledgements
We thank Karl Friston and members of the neurobiology group at the Wellcome Trust Centre for Neuroimaging for discussion of the results of this study.
Declaration of Interest
None.