1. Introduction
The phenomenon of ‘guided jet waves’, originally referred to as ‘trapped waves’, is a relatively recent discovery. It involves upstream and downstream-propagating waves within the potential core of high subsonic and supersonic jets. These waves interact and resonate in certain frequency ranges depending on flow conditions (Towne et al. Reference Towne, Cavalieri, Jordan, Colonius, Schmidt, Jaunet and Brès2017). A clear manifestation of the waves and their resonance is seen in the pressure fluctuations occurring in the vicinity of the nozzle exit. The pressure fluctuation spectra measured just outside the jet near the nozzle exhibit a series of peaks, as shown by the data clip in figure 1. The data are from a round jet at a high subsonic Mach number, and they are shown here schematically in arbitrary scales to highlight the general characteristics of the phenomenon. These ‘guided wave’ spectral peaks, referred to hereafter as ‘GW peaks’, are found to be ubiquitous not only with round nozzles of different diameters, but also with nozzles of other geometries (Zaman, Fagan & Upadhyay Reference Zaman, Fagan and Upadhyay2021).
Pressure fluctuation spectra measured near the nozzle exit shown in arbitrary scales.

The existence of the GW peaks and their underlying mechanisms was first brought to light by Towne et al. (Reference Towne, Cavalieri, Jordan, Colonius, Schmidt, Jaunet and Brès2017) while analysing the large-eddy simulations (LES) results of a Mach 0.90 jet conducted earlier (see Bres et al. Reference Brès, Jordan, Jaunet, Le Rallic, Cavalieri, Towne, Lele, Colonius and Schmidt2018). (The cited journal publications supersede several earlier conference papers by these authors and their colleagues, e.g. presented at the 22nd AIAA Aeroacoustics Conference, 2016.) An analysis by Towne et al. (Reference Towne, Cavalieri, Jordan, Colonius, Schmidt, Jaunet and Brès2017) showed that both upstream and downstream-propagating waves could exist within the jet's potential core, as seen in the LES database. Combined with end conditions imposed by the nozzle and the contracting potential core, it was predicted that these waves could resonate in limited frequency bands in the Mach number range 0.82 > M J > 1. Such resonance led to the pressure fluctuations in the vicinity of the jet, as observed in brief experiments accompanying the study. Significant advances have been made in recent years about the characteristics of these waves and their dynamics, as touched upon in later discussions.
The waves within the jet core follow from inviscid instability of the jet's shear layer. Spatial stability analysis of a free cylindrical shear layer provides a primary mode solution that represents the well-known Kelvin–Helmholtz (K–H) waves. There is a second solution, first noted decades ago by Michalke (Reference Michalke1970). While the K–H mode had a pressure fluctuation maximum in the shear layer, the second mode had a maximum on the jet centreline. Michalke discounted the second mode as unrealistic, since it was never observed in experiments, and assumed that it must be a result of the simplifying assumption that the jet was represented by an infinitely long cylindrical vortex sheet, whereas in practice the jet spreads. Tam & Hu (Reference Tam and Hu1989) later conducted detailed analyses of the second mode, and identified two sub-branches – one with supersonic propagation speed, and the other with subsonic propagation speed. They noted that the waves were confined within the jet and that some of the waves propagated upstream. The lead author later studied the role of the upstream-propagating waves in various flow resonance phenomena, e.g. screeching jets (Shen & Tam Reference Shen and Tam2002), impinging jets (Tam & Ahuja Reference Tam and Ahuja1990) and jets grazing over a plate (Tam & Chandramouli Reference Tam and Chandramouli2020).
Since the companion works of Towne et al. (Reference Towne, Cavalieri, Jordan, Colonius, Schmidt, Jaunet and Brès2017), Bres et al. (Reference Brès, Jordan, Jaunet, Le Rallic, Cavalieri, Towne, Lele, Colonius and Schmidt2018) and Schmidt et al. (Reference Schmidt, Towne, Colonius, Cavalieri, Jordan and Brès2017), the role of the upstream-propagating guided jet waves in various resonance phenomena has been studied extensively. Edgington-Mitchell et al. (Reference Edgington-Mitchell, Jaunet, Jordan, Towne, Soria and Honnery2018), Gojon, Bogey & Mihaescu (Reference Gojon, Bogey and Mihaescu2018), Mancinelli et al. (Reference Mancinelli, Jaunet, Jordan and Towne2019) and Nogueira et al. (Reference Nogueira, Jaunet, Mancinelli, Jordan and Edgington-Mitchell2022) addressed the ‘A1’ and ‘A2’ stages of screech tones in supersonic jets. (For basics of screech, see e.g. Raman Reference Raman1998.) In Edgington-Mitchell et al. (Reference Edgington-Mitchell, Jaunet, Jordan, Towne, Soria and Honnery2018), it was shown that the upstream-propagating wave completing the feedback loop of the screech phenomenon indeed had a mode shape similar to that of the mode 2 solution discussed above. Detailed spectral measurements for screech frequency variations were found to agree well with analytical predictions in Mancinelli et al. (Reference Mancinelli, Jaunet, Jordan and Towne2019). Based on the analysis of high-speed schlieren movies of jets from two different nozzles, the staging behaviour of screech tones was studied by Edgington-Mitchell et al. (Reference Edgington-Mitchell, Li, Liu, He, Wong, Mackenzie and Nogueira2022); a refined ‘unifying’ analysis based on triadic interactions of guided jet waves and K–H waves with the shock cell structure captured various stage jumps of screech.
Jordan et al. (Reference Jordan, Jaunet, Towne, Cavalieri, Colonius, Schmidt and Agarwal2018) discussed the interaction tones between a round jet and an inclined flat plate (flap). These authors noted that the strongest tones were due to a coupling between the downstream-propagating K–H waves and ‘a family of trapped, upstream-travelling acoustic modes in the potential core’. Vare & Bogey (Reference Varé and Bogey2022) considered jets impinging on a plate with a hole, and found different feedback processes depending on the geometry; some of these processes involved the upstream-propagating guided waves.
Research especially on the analytical front related to the characteristics of the guided jet waves and their role in the generation of various resonance phenomena in subsonic as well as supersonic jets has progressed at a fast pace in recent years. For overviews of the fundamental aspects of the guided waves, see e.g. Martini, Cavalieri & Jordan (Reference Martini, Cavalieri and Jordan2019), Nogueira et al. (Reference Nogueira, Jordan, Jaunet, Cavalieri, Towne and Edgington-Mitchell2021, Reference Zaman, Bridges, Upadhyay and Brown2024), Edgington-Mitchell et al. (Reference Edgington-Mitchell2019, Reference Edgington-Mitchell, Wang, Nogueira, Schmidt, Jaunet, Duke, Jordan and Towne2021, Reference Edgington-Mitchell, Li, Liu, He, Wong, Mackenzie and Nogueira2022) and Bogey (Reference Bogey2021, Reference Bogey2022a , Reference Bogey2024a , Reference Bogey2025). Of note is the study of Nogueira et al. (Reference Zaman, Bridges, Upadhyay and Brown2024), who showed that sound from a source placed within a jet (cylindrical vortex sheet) can undergo reflection and refraction at the shear layer for a range of frequencies and wavenumbers. After internal reflection, both upstream- and downstream-propagating guided jet waves can occur in discrete frequency/wavenumber bands, depending on the Mach number. These results as well as those of some others (e.g. Bogey Reference Bogey2021) will be invoked while discussing the present experimental results. The Nogueira et al. (Reference Zaman, Bridges, Upadhyay and Brown2024) study was complemented recently with a numerical analysis by Bogey (Reference Bogey2025).
In the present study, our focus is not on the guided waves per se, occurring within the jet, but instead on the resultant peaks in the pressure spectra outside of the jet (i.e. the GW peaks). Apart from academic curiosity, these spectral peaks are deemed relevant from a practical standpoint. These went unnoticed in decades of far-field jet noise measurements. If these bore an influence on the far-field noise, then this influence should be understood and accounted for in jet noise prediction codes. Ongoing NASA efforts aim to improve the accuracy of such codes as they are frequently relied on for future aircraft concepts as well as by government regulatory agencies for noise certification purposes; see e.g. Berton (Reference Berton2023) and Bridges (Reference Bridges2025).
As noted earlier by Zaman et al. (Reference Zaman, Fagan and Upadhyay2021), the occurrence of the GW peaks in the vicinity of high subsonic jets was indeed a surprising revelation. These basically went undetected over decades of experimental studies on jet noise and flow instability. The waves disappear in the far acoustic field at typical measurement locations, and thus went unnoticed in jet noise experiments. They went undetected in jet instability experiments because the K–H waves grow fast and dominate the flow, and also because the instability experiments have typically been conducted in incompressible flows whereas the GW peaks are observed in the compressible regime at high-subsonic and supersonic conditions.
The GW peaks were in fact observed by others in the past but considered to be spurious and/or facility related. To our knowledge, the first such observation was by Suzuki & Colonius (Reference Suzuki and Colonius2006) in connection with phased-array measurements in a round jet. Some microphones of the phased array located near the nozzle exhibited spectral peaks as in figure 1. The origin of the peaks was not known at the time. The authors considered the possibility that these were plenum chamber duct modes; the results were inconclusive, and they reported them in an appendix of their paper, stating ‘we have observed a spurious resonance phenomenon, particularly at higher Mach numbers for unheated jets’. A second such experimental observation is described by Bogey (Reference Bogey2022b ), as discussed shortly.
Following the work of Towne et al. (Reference Towne, Cavalieri, Jordan, Colonius, Schmidt, Jaunet and Brès2017), a preliminary experiment was conducted by Zaman & Fagan (Reference Zaman and Fagan2019). This was followed by detailed measurements, and a summary of all results was given in Zaman et al. (Reference Zaman, Fagan and Upadhyay2021). Several observations were made from the experimentalists’ vantage point. The GW peaks were found to be independent of the nozzle's exit boundary layer thickness and state. Data from several round nozzles showed that the frequency of the first peak on the left (denoted f0 in figure 1) scaled with the nozzle diameter; however, the Strouhal number was not a constant but a unique function of the jet Mach number (M J ). The higher frequency peaks ( f1, f2, f3, etc.) were noted to follow a ‘fractional relationship’ with f0, as elaborated later. The phenomenon also occurred with rectangular jets, the number of peaks noted on the short and long edges bearing a ratio dictated by the aspect ratio of the nozzle.
Extensive numerical/analytical works had been conducted by Bogey and colleagues (Bogey & Gojon Reference Bogey and Gojon2017; Bogey Reference Bogey2021, Reference Bogey2022a ). In the work of Bogey (Reference Bogey2021), the occurrence of the GW peaks over a wide range of jet Mach number (0.6–2.0) was studied; overall, the resultant near-field pressure fluctuation spectra had good agreement with the experimental data of Zaman & Fagan (Reference Zaman and Fagan2019). Upadhyay & Zaman (Reference Upadhyay and Zaman2022) showed the occurrence of the GW peaks with heated jets. Numerical simulation of hot jets by Bogey (Reference Bogey2024a ) covered a wide parameter space; the Strouhal number of the GW peak was found to decrease with increasing temperature, as also seen in the paper by Upadhyay & Zaman (Reference Upadhyay and Zaman2022). Bogey (Reference Bogey2024b ) investigated acoustic receptivity due to varying lip thickness of the jet nozzle. The receptivity was higher for a thicker lip and for a sound source placed inside rather than outside the jet, as well as at higher jet Mach numbers. A sound source inside the jet produced upstream-propagating waves resembling the guided jet waves.
In most of the works described so far, the occurrence of the GW peaks was noted in the vicinity of the nozzle exit. These peaks disappeared within a few diameters downstream of the nozzle. Even on a typical Ffowcs Williams–Hawkings surface, used for prediction of far-field jet noise from near-field experimental data, these peaks were hardly detectable past 1.5D from the nozzle exit, where D is the nozzle diameter (Zaman et al. Reference Zaman, Fagan and Upadhyay2021). However, there has been some evidence that the GW peaks could persist farther away from the nozzle in the sideline direction. In the experiment by Zaman et al. (Reference Zaman, Fagan and Upadhyay2021), a possible footprint of the GW peaks was noted 25D away from the nozzle. An earlier experiment by Jaunet et al. (Reference Jaunet, Jordan, Cavalieri, Towne, Colonius, Schmidt and Brès2016) also reported such evidence. Significant coherence was noticed between a far-field microphone at θ = 80° and one near the jet exit, at the GW peak frequencies. They inferred that ‘this confirms that the so-called trapped waves leave their signature in the far field’.
In the forward arc of the jet noise field, i.e. at shallow polar angles in the upstream direction, there has been clearer evidence of the GW peaks. Bogey (Reference Bogey2022b ) studied far-field jet noise spectra, obtained in an experiment approximately 20 years ago, at θ = 30° polar location. The spectra were marked by certain peaks. At the time of the experiment, the peaks were thought to be spurious, and the set of data remained unpublished. In the cited paper, Bogey analysed the data to determine that they were indeed at the same frequencies as the GW peaks seen near the nozzle exit. The Bogey (Reference Bogey2021) numerical results also demonstrated the persistence of the GW peaks in the acoustic field in the upstream direction. Nevertheless, the possibility that the GW peaks might persist far from the nozzle in the forward arc was intriguing. A brief experiment was conducted by Zaman, Fagan & Upadhyay (Reference Zaman, Fagan and Upadhyay2023), and the GW peaks were also noted up to approximately 36D upstream of the nozzle exit.
There were constraints in the experiment of Zaman et al. (Reference Zaman, Fagan and Upadhyay2023); the test environment was far from anechoic. The experimental data reported by Bogey (Reference Bogey2022b ) were also quite limited. From the perspective of jet noise radiation, there were lingering questions. Is it really possible that jet noise spectra in the far acoustic field could be marked by the GW peaks? Far-field noise spectra have been known and assumed to be smooth; no jet noise code predicts a ‘peaky’ spectrum. Do those peaks radiate acoustically in the upstream direction? Will there be changes in the frequency of the peaks depending on observation angle? Frequency of spectral peaks due to other noise components, e.g. broadband shock associated noise, is known to vary with observation angle. Will those peaks still occur in heated jets as pertinent to practical engine exhausts? For a clear determination of the persistence of the peaks in the forward arc, as well as answering some of these questions, the need for a comprehensive experiment in a high-quality anechoic facility was deemed critical. This led to the current investigation.
Another important factor motivating the present experiment was the lack of jet noise data in the forward arc. This is a region that has been avoided or could not be accessed in most previous jet noise experiments. This is underscored with the help of a schematic of the current experimental arrangement in figure 2. Past jet noise experiments typically covered polar angle range 50°–160° (sideline and downstream directions). It will not be an exaggeration to say that there is practically no jet noise data in the literature in the forward arc, i.e. at polar angles in the approximate range θ < 50° – as marked by the red circle. The reason for this is that in typical jet noise experiments, those locations cannot even be accessed due to the presence of the settling chamber and other facility constraints. This was circumvented in the present experiment by adding a long pipe and placing the nozzle tip at the end of the pipe, as discussed further in the next section.
Schematic of the experimental set-up in the Aeroacoustic Propulsion Laboratory.

Thus while the primary objective of the present investigation was to explore the persistence and characteristics of the GW peaks in the forward arc, another important objective was to document jet noise spectral data in that region that had been missing in the literature. Shortly after the experiment, all data, also in digital format for easy access by others, were documented in a NASA Technical Memorandum (Zaman et al. (Reference Zaman, Bridges, Upadhyay and Brown2024), referred to hereafter as TM2024). While the detailed data from the experiment can be found in TM2024, the purpose of this paper is to analyse, discuss and summarise the key results.
2. Experimental arrangement and procedure
The experiments are conducted in the Small Hot Jet Acoustic Rig (SHJAR) within the Aeroacoustic Propulsion Laboratory (AAPL). The SHJAR is a single-stream hot-jet facility that can provide heated air at temperatures up to 700 °C and at pressures up to approximately 1030 kPa (150 psi). The AAPL, which houses the SHJAR, is a 20 m geodesic dome lined with 61 cm long sound-absorbing wedges that remove sound reflection at frequencies above 200 Hz. A picture of the experimental set-up is shown in figure 3(a), and a schematic is shown in figure 3(b). An interested reader may find descriptions of the AAPL in the papers by Bridges & Brown (Reference Bridges and Brown2005) and Brown & Bridges (Reference Brown and Bridges2006).
Experimental arrangement: (a) a picture of the set-up; (b) a schematic of the set-up.

In order to access small polar angles in the upstream direction, a 15.2 cm diameter and 3.66 m long pipe was attached to the exit of the SHJAR. The flow was smoothly contracted to a 5.72 cm diameter and 30.5 cm long pipe. Finally, adapters at the end were used to attach various nozzle tips. The addition of the smaller 30.5 cm long pipe prior to the nozzle ensured a fully turbulent exit boundary layer for the ensuing jet (Zaman et al. Reference Zaman, Fagan and Upadhyay2021). The nozzles used in the experiment included a 5.08 cm diameter round convergent nozzle (denoted as ‘SMC000’), five convergent–divergent (C–D) nozzles all having 5.08 cm exit diameter but different design Mach numbers (M D ), a 2 : 1 aspect ratio rectangular nozzle, and several chevron nozzles.
Altogether, 24 Brüel & Kjær 4939 microphones (mics) were employed in the experiment. A polar array of 22 mics was positioned on 3.05 m tall stands at radius 3.81 m centred on the nozzle exit; thus the mics were 75D away from the nozzle exit, where D (= 5.08 cm) was the exit diameter of most of the nozzles. The mics were pointed at the nozzle exit. The array covered polar angles from 165° all the way to 10° (see figures 2, 3 b). Note that the polar angle (θ) is measured relative to the jet axis in the upstream direction; x and r denote axial and far-field distances from the nozzle exit centre, while y denotes radial distance from the jet axis. Microphone no. 23 was moveable and usually positioned on the opposite side of the array at 2.54 m upstream on a 15° polar location. Microphone no. 24 was used as reference and typically located at 1.27 cm upstream from the nozzle exit and about 3.81 cm away radially from the nozzle's outer wall, also on the opposite side of the array. Acoustic data repeatability had been determined in prior studies to be within 0.5 dB in one-third octave bands at all frequencies (Khavaran & Bridges Reference Khavaran and Bridges2009).
The mic data were recorded by a Hottinger Brüel & Kjær (HBK) data acquisition system. The plenum pressure and temperature were recorded along with ambient conditions. Real-time calculation of pressure ratio NPR, total temperature ratio NTR and jet Mach number MJ
, along with various other parameters, was performed and recorded with each dataset via a collect observe broadcast record and analyse (COBRA) monitoring system synchronised with the HBK system. The spectral data were corrected for frequency response and atmospheric attenuation. The data presented in the following are power spectral density (PSD) of sound pressure, Pa2Hz
 $^{-1}$
, in dB referenced to 20 µPa, and transformed to 30.5 cm (1 ft) distance assuming spherical spreading. Jet Mach number MJ
is used as an independent variable that is defined based on the nozzle pressure ratio (NPR= p0/pa):
 \begin{equation}M_{{J}}=\left(\left(\left(\frac{p_0}{p_a}\right)^{(\gamma-1)/\gamma}-1\right)\frac{{2}}{{\gamma}-{1}}\right)^{1/2},\end{equation}
where p 0 is the plenum pressure, p a is the ambient pressure, and γ (= 1.4) is the ratio of specific heats for air.
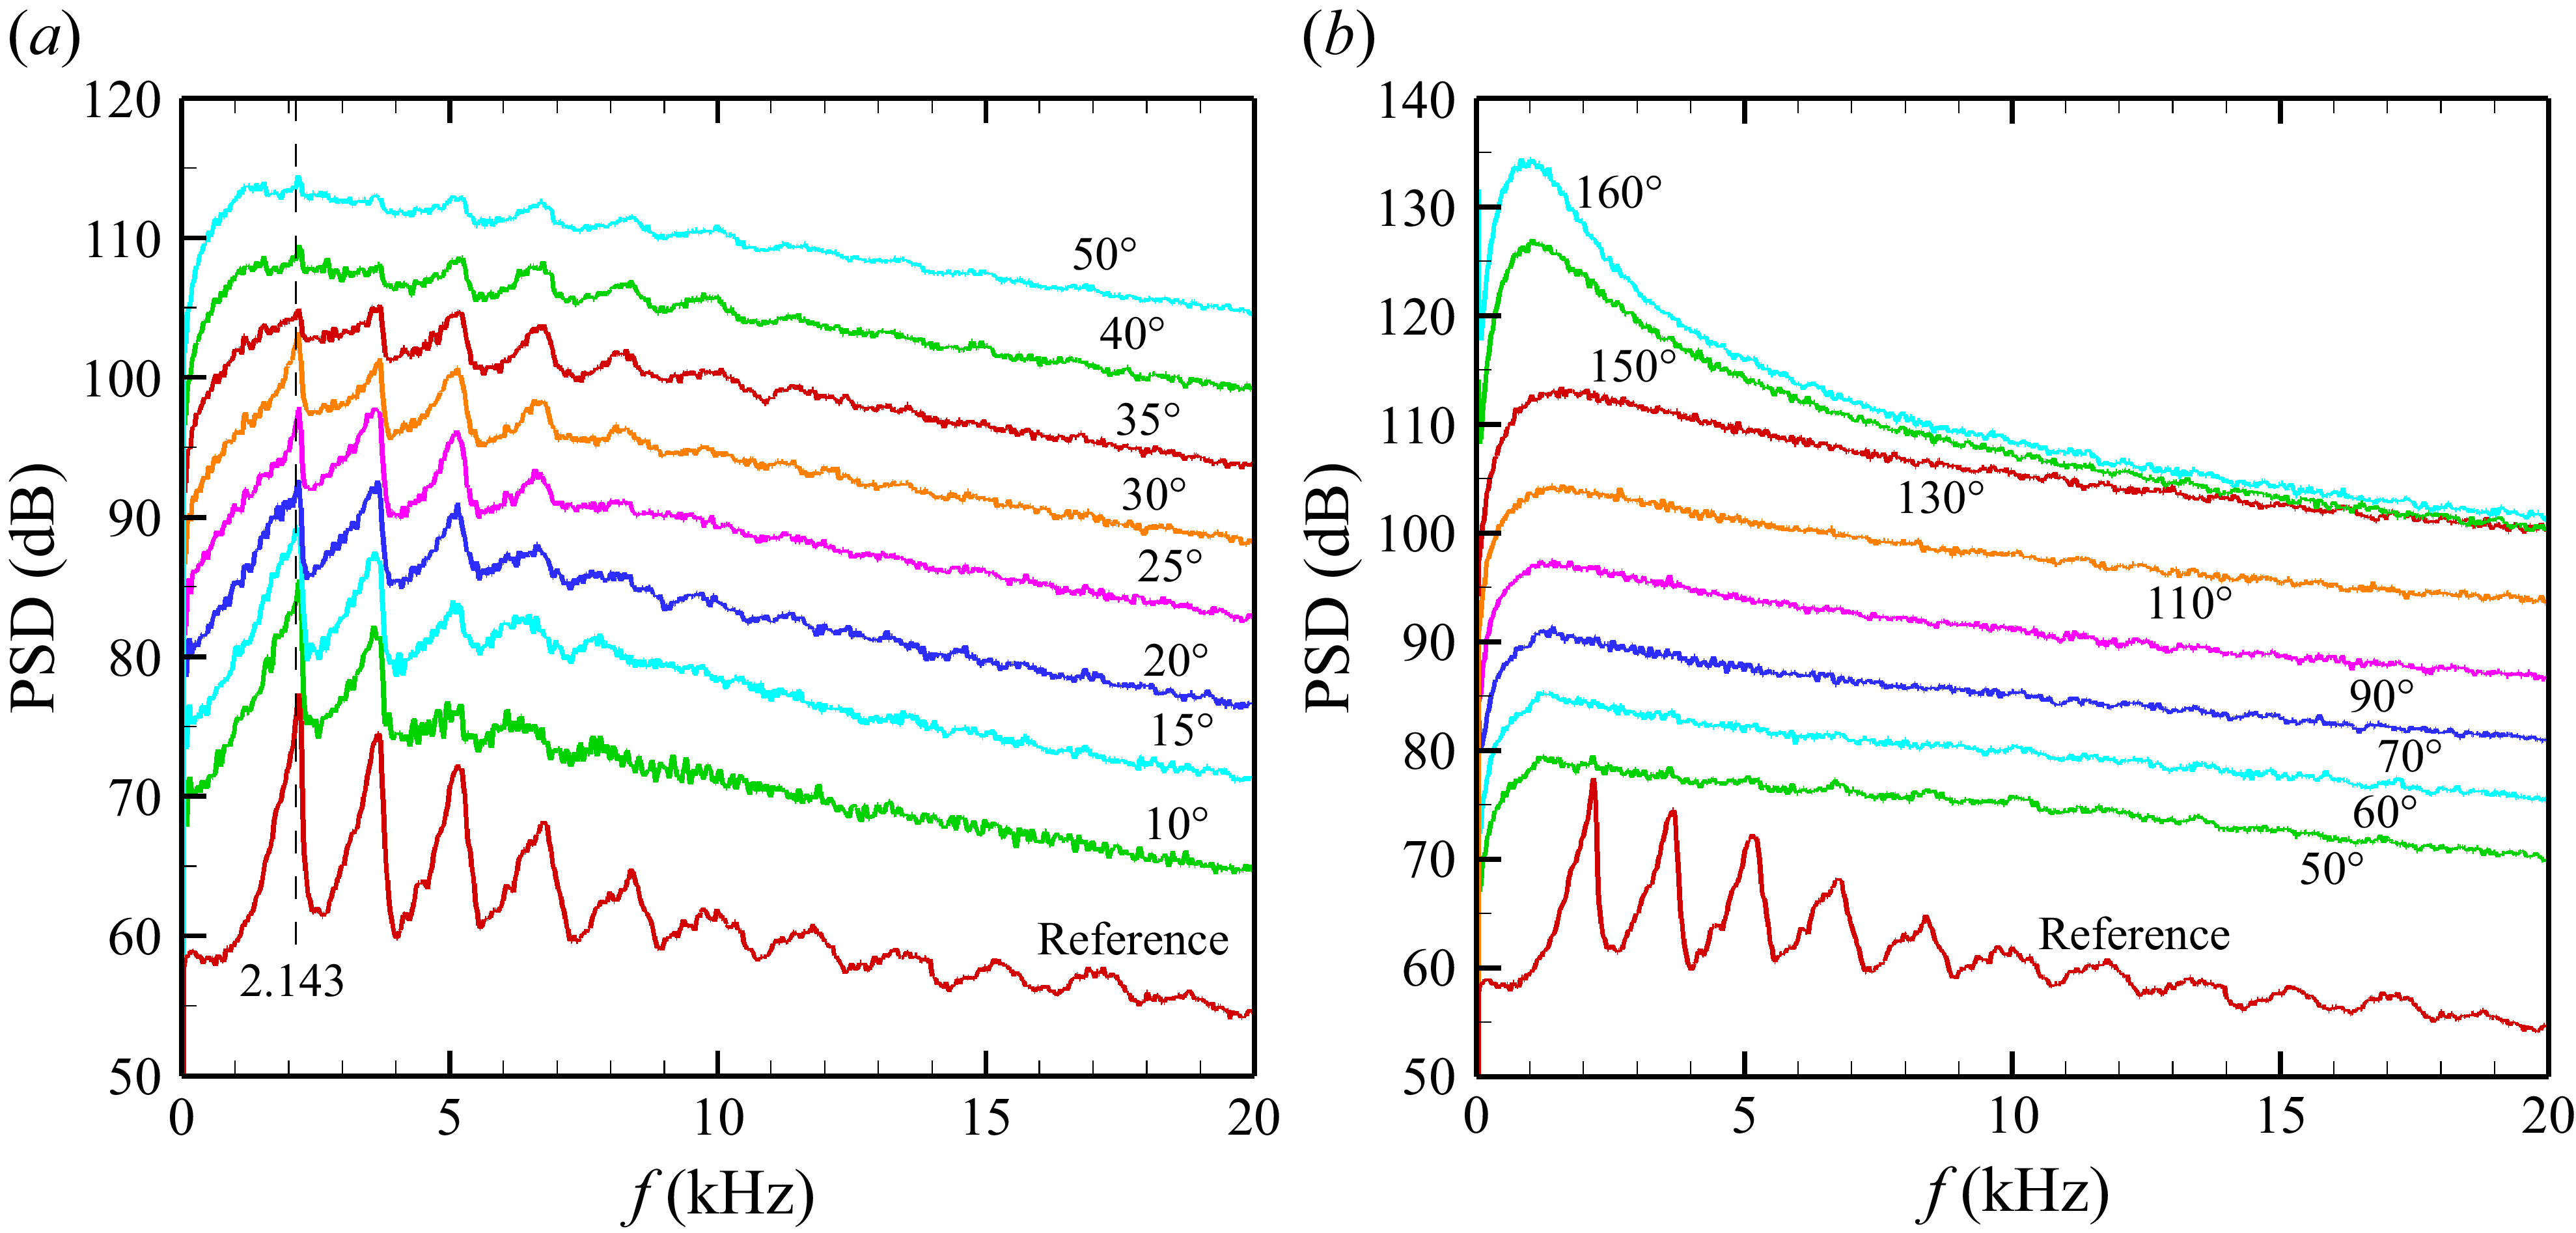
The PSD of sound pressure for the SMC000 case at M J = 0.983, unheated flow (NTR = 1). (a) Data in the forward arc far field with polar location (θ) for each spectral trace indicated; ordinate pertains to the 10° case, and others are staggered by 5 dB. Trace for reference microphone (x = -1.27 cm, y = 5.72 cm) is shifted down by 40 dB. (b) The PSD data at larger θ locations shown similarly as in (a).

3. Results
Figure 4 shows far-field noise PSD data for various θ, for the 5.08 cm diameter convergent nozzle (SMC000). The data are presented in a staggered manner for clarity. The ordinate pertains to the spectral trace at the smallest angle (10° or 50° in figures 4(a,b), respectively), and others are shifted by 5 dB successively. Also shown at the bottom is the spectra from the near-nozzle reference mic in arbitrarily shifted ordinate scale for clear comparison. The GW spectral peaks are readily recognised in the reference signal. The Strouhal numbers of the lowest frequency peak f0 (at 2.14 kHz), as well as those of the higher frequency peaks, agree well with previous observations (Zaman et al. Reference Zaman, Fagan and Upadhyay2021). Importantly, it is seen in figure 4(a) that the same spectral peaks characterise the data from the mics in the far acoustic field clearly up to θ = 35°; the higher-frequency peaks are noticeable even at θ = 50°. The primary question posed in the investigation is thus answered: the GW peaks indeed persist in the far acoustic field in the forward arc. In figure 4(b), corresponding data for larger θ locations are shown where the GW spectral peaks are no longer visible, and the spectra are smooth.
Figure 5 shows another key result. The variation of the amplitudes of the GW peaks with distance from the nozzle are measured with three mics placed in line with the far-field mic at θ = 15°. The schematic in figure 5(b) shows the experimental arrangement. The PSD results from the four mics are shown, with distances of the mics indicated in the legend. Overall, the data are essentially congruent. Recall that the PSD data are referenced to 30.5 cm distance (assuming
 $r^{-2}$
amplitude variation for spherical radiation). Thus the congruence of the spectral traces implies that the amplitudes of the GW peaks follow the
 $r^{-2}$
law. The rapid decay of the peaks in the sideline and aft directions (Zaman et al. Reference Zaman, Fagan and Upadhyay2021) had led to the impression that the GW peaks could be footprints of hydrodynamic fluctuations. The present data clearly show that the spectral peaks are part of acoustic radiation in the forward arc. These results agree with recent analytical/numerical studies that stipulate that the guided waves are simply acoustic waves, and reflection conditions at the shear layer are frequency-dependent (Martini et al. Reference Martini, Cavalieri and Jordan2019; Nogueira et al. Reference Zaman, Bridges, Upadhyay and Brown2024; Bogey Reference Bogey2025). The Nogueira et al. (Reference Zaman, Bridges, Upadhyay and Brown2024) analysis illustrates that upstream-propagating guided waves having close to sonic phase speed yield maximum transmission to the outside, leading to a net-energy flux directed upstream. This reconciles with the highly directional radiation characteristics seen in the experiment (figure 4).
(a) Spectral amplitude variation with distance along θ = 15° polar line for the SMC000 case at M J = 0.983; distances of the four mics are indicated in the legend. (b) Schematic showing the experimental arrangement.

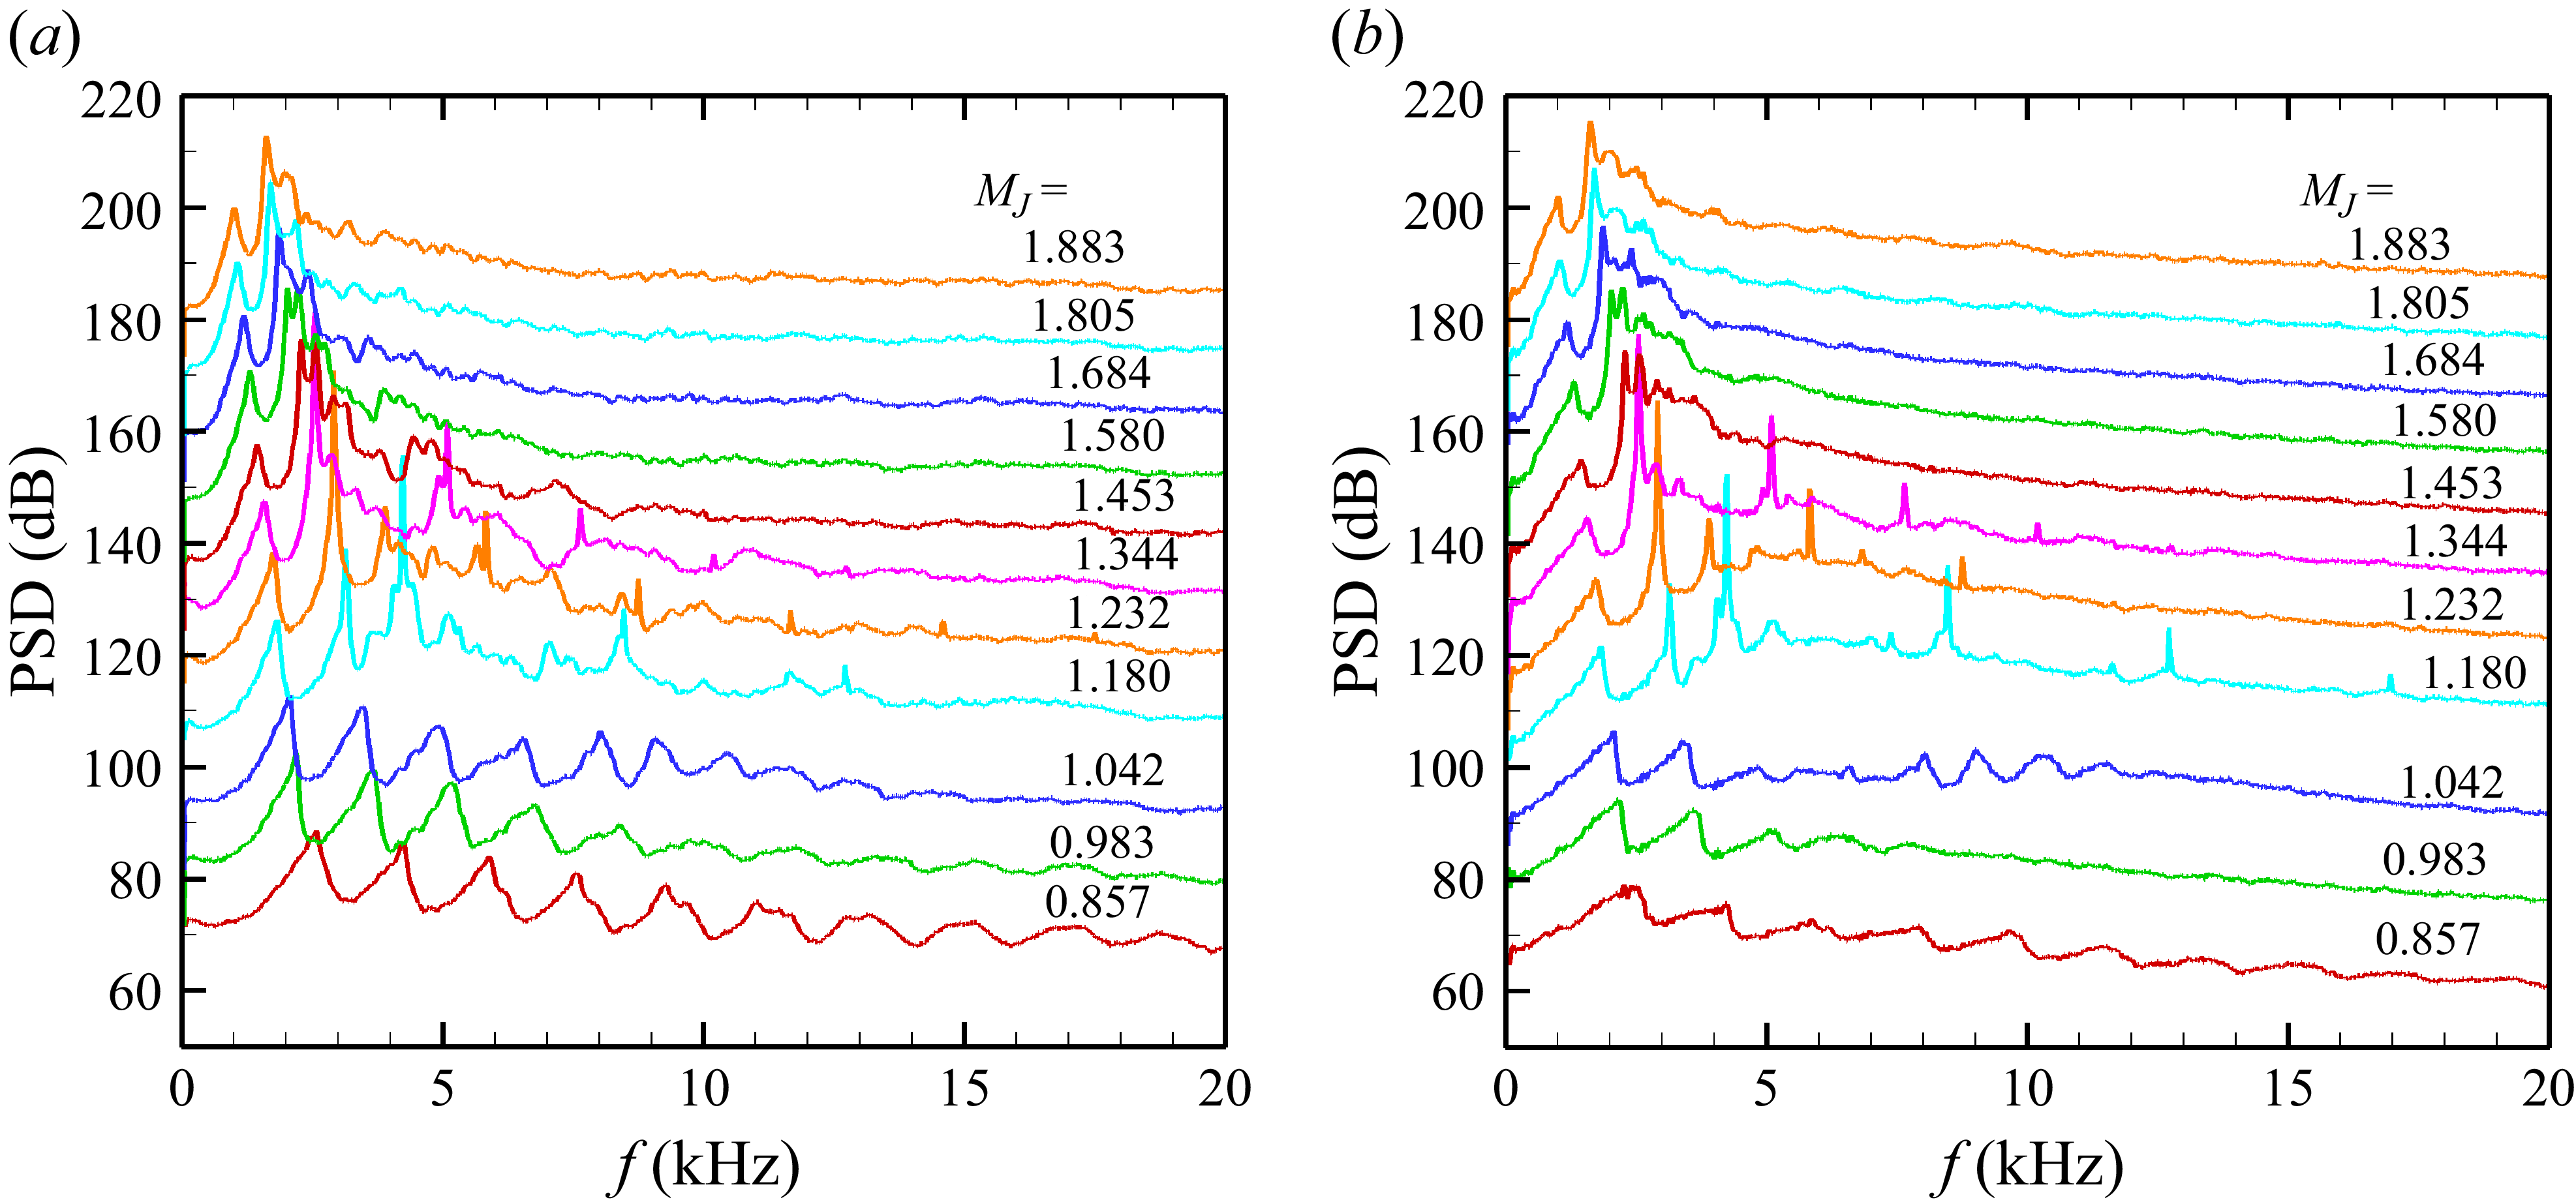
While the data in figures 4 and 5 are for a high subsonic case (M J = 0.983), data for varying M J are shown in figure 6 for the reference and the θ = 15° far-field locations. Consider the reference mic data in figure 6(a). The series of GW peaks is clear at low M J . With increasing M J , screech appears at M J = 1.18, as evident from emergence of an audible tone accompanied by a sharp spike in the spectra. It is as if the third GW peak ( f2) suddenly gets replaced by the screech component. With further increase in M J , screech goes through a stage jump to a lower frequency and coincides with the second GW peak ( f1). The variation of screech frequency vis-à-vis that of the GW peaks and predictions by others are discussed later. Notice that throughout the M J range covered, the GW peak f0 is clearly visible, systematically decreasing in frequency with increasing M J .
The PSD of sound pressure for the SMC000 nozzle at different M J : (a) at the reference location (x = -1.27 cm, y = 5.72 cm); (b) at the 15° polar location in the far field (75D from nozzle exit). Ordinate pertains to the lowest (M J = 0.857) case; other traces are staggered by 10 dB.

From figure 6, it is amply clear that the same trends as seen in the near-field mic in figure 6(a) characterise the θ = 15° far-field mic data shown in figure 6(b). It is essentially a ‘carbon copy’ of the data in figure 6(a). The GW spectral peaks persist in the far-field forward arc at all values of M J into the supersonic regime up to the highest (M J = 1.88) covered in the figure. This is unequivocal experimental evidence that the GW peaks persist over a wide range of Mach number and observation angles. As shown in the following, they also persist with C–D nozzles with various run conditions, as well as with rectangular nozzles.
Data for four C–D nozzles are shown in figure 7, all run at their respective design condition (M J = M D ). As in figure 4, the traces labelled 10°–50° represent far-field mics (r/D = 75), while the trace at the bottom is from the near-exit reference mic. Clearly, the GW peaks persist at the design conditions. A vertical line drawn through f0 shows that its frequency does not change, as was also the case in figure 4(a). Its frequency (noted at bottom left in each plot) remains constant for a given case but decreases with increasing design Mach number M D . Spectra for aft angles, corresponding to the fully expanded cases of figure 7, have been shown in TM2024 (Zaman et al. Reference Zaman, Bridges, Upadhyay and Brown2024). As with the convergent case, the GW peaks are not visible at the aft polar locations. (Also shown in TM2024, and not repeated here for brevity, are several diagnostic results including data showing that the GW peaks remain unchanged with and without acoustic insulation material wrapped on the outside of the long pipe – assuring that the spectral peaks are not due to a reflection from the pipe's outer wall or any structural vibration.)
Another dataset for a C–D nozzle at off-design conditions is shown in figure 8. These data are for the M D = 1.5 case run at two overexpanded conditions (M J < M D in figures 8 a,b) and two underexpanded conditions (M J > M D in figures 8 c,d). The frequency of f0 (noted at bottom left) is seen to continually decrease with increasing M J , across the design condition. Screech occurs also coinciding with the second GW peak ( f1), as with the convergent case (figure 6), at the off-design conditions.
The PSD of sound pressure in the forward arc for four C–D nozzles each run at design conditions: (a) M D = 1.4, (b) M D = 1.5, (c) M D = 1.67, (d) M D = 1.8.

The PSD of sound pressure in the forward arc of the M D = 1.5 C–D nozzle run at four off-design conditions: (a) M J = 1.3, (b) M J = 1.4, (c) M J = 1.6, (d) M J = 1.7.

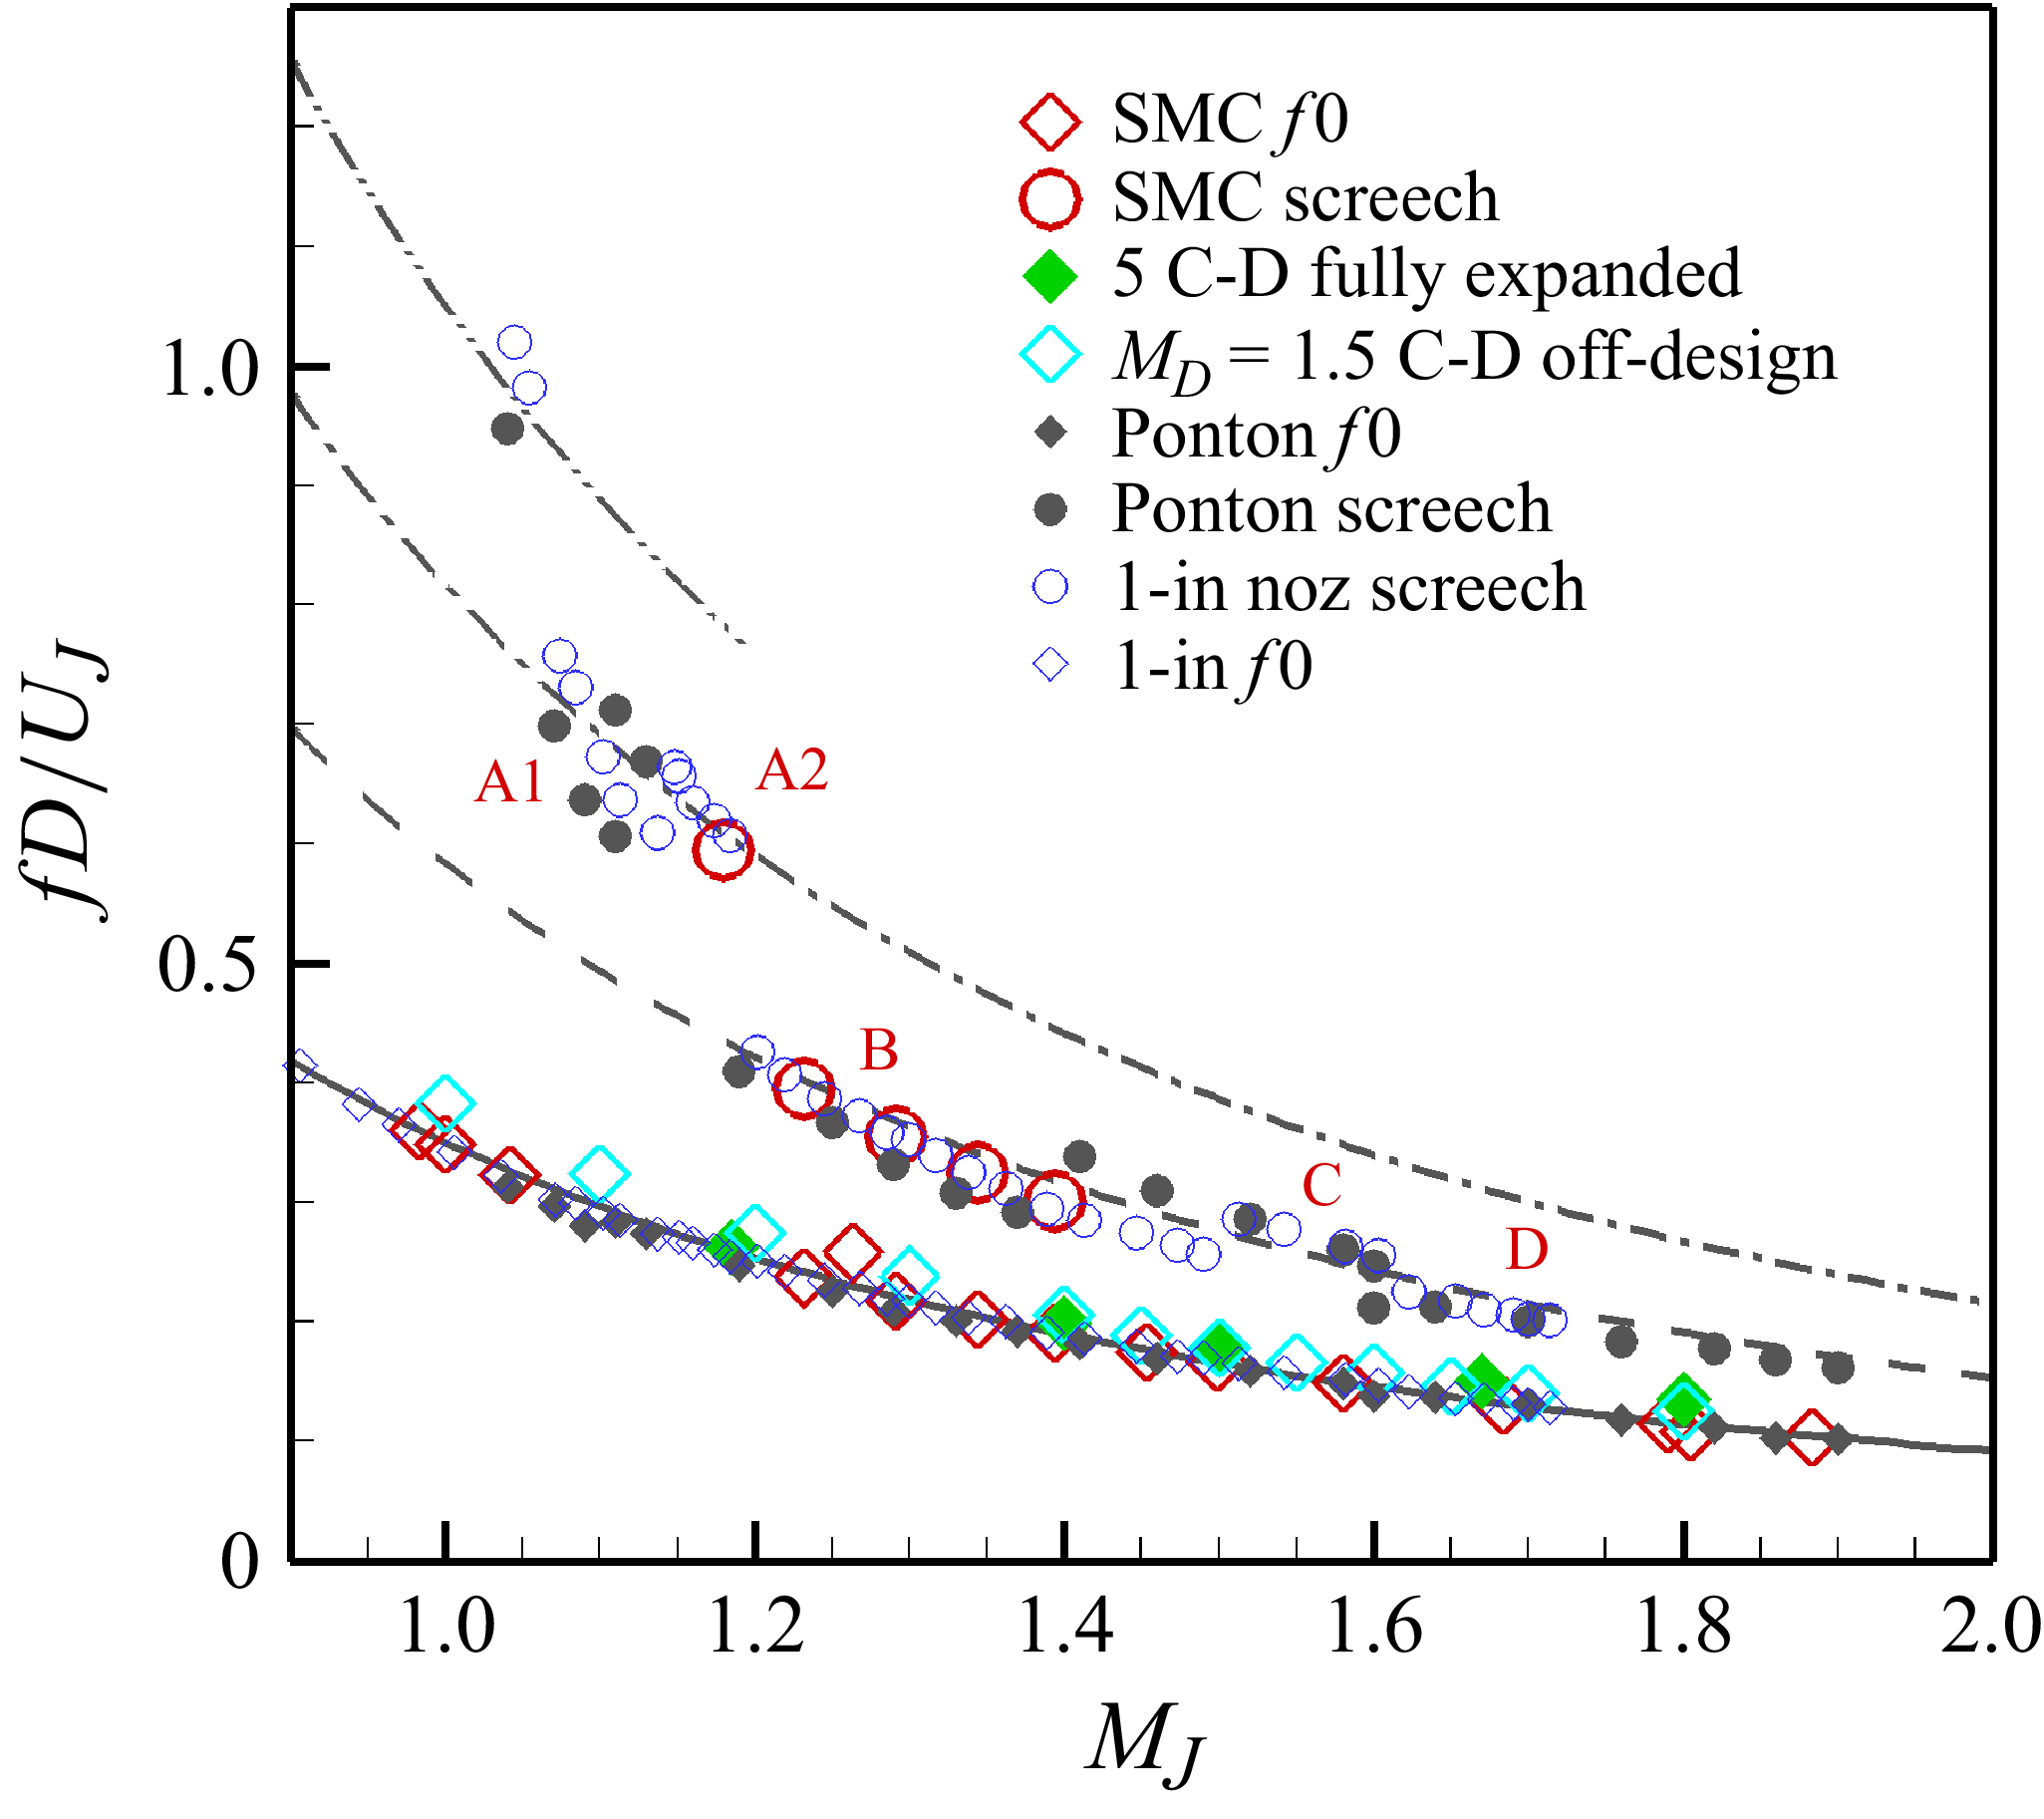
The non-dimensional frequencies of the GW spectral peaks are compared in figure 9 with previous results (Zaman & Fagan Reference Zaman and Fagan2019; Zaman et al. Reference Zaman, Fagan and Upadhyay2021). The Strouhal numbers of f0 and the next three higher frequency peaks ( f1, f2 and f3) are plotted as functions of M J . The lines represent correlation equations based on previous data from round nozzles of different diameters. Note that the original correlation equations (Zaman et al. Reference Zaman, Fagan and Upadhyay2021) are slightly modified here to better fit the data in the supersonic regime (see also Zaman et al. Reference Zaman, Fagan and Upadhyay2023). The correlation for the lowest-frequency peak ( f0) is given by
Spectral peak Strouhal number versus M J from the current experiment compared to previous data and correlation from Zaman et al. (Reference Zaman, Fagan and Upadhyay2021, Reference Zaman, Fagan and Upadhyay2023). Lines correspond to correlation equations. Larger symbols are data from current experiment. Red diamonds indicate GW f0 for SMC000; red circles indicate screech data for SMC000; green solid diamonds indicate f0 for five C–D nozzles run at design conditions (figure 7); cyan diamonds indicate f0 for M D = 1.5 C–D nozzle run off-design (figure 8). Small blue circles indicate screech data from a 2.54 cm diameter nozzle. Solid black circles indicate screech data from Ponton et al. (Reference Ponton, Seiner and Brown1997).

 \begin{align} \textit{St} = \big(1/ M_{\!J}^ 2- 1\big)/13 + \left(1/ M_{\!J} - 1\right)/2 + \left(M_{\!J} -1\right)/20+0.35. \end{align}
Here, the Strouhal number St is based on nozzle exit diameter D and ideally expanded jet velocity at nozzle exit. The correlations for the higher-frequency peaks ( f1, f2 and f3) are simply
 $5/3$
,
 $7/3$
and
 $9/3$
times the value of f0. This rather peculiar ‘fractional harmonic’ relationship is purely an experimental observation.
The mode shapes and origin of the spectral peaks are known from various analyses, e.g. by Tam & Hu (Reference Tam and Hu1989), Suzuki & Colonius (Reference Suzuki and Colonius2006), Towne et al. (Reference Towne, Cavalieri, Jordan, Colonius, Schmidt, Jaunet and Brès2017), Bogey (Reference Bogey2021, Reference Bogey2025) and Nogueira et al. (Reference Zaman, Bridges, Upadhyay and Brown2024). The analyses based on instability of a cylindrical vortex sheet show that the first GW peak f0 corresponds to an axisymmetric mode shape (m = 0) (it has a peak or anti-node on the axis, thus its radial mode number is n = 1). The Bogey (Reference Bogey2021) numerical/analytical study showed that the successive peaks, f1, f2, f3, etc. are largely contributed by the helical modes, m = 1, 2, 3, …, respectively. While the second peak ( f1) is contributed entirely by the first helical mode (m = 1), there are contributions from multiple modes to the higher-frequency peaks. For example, f2 is contributed by m = 2 helical mode but also significantly by the second axisymmetric radial mode (m = 0, n = 2). Even-higher-frequency peaks consist of more complex combinations of different modes.
The Bogey (Reference Bogey2021) analyses with varying Mach number also provide the ‘loci’ of the saddle point ‘Smax’ (‘S2’ in the Towne et al. (Reference Towne, Cavalieri, Jordan, Colonius, Schmidt, Jaunet and Brès2017) analysis) on an St versus M diagram for the various modes. Such a locus for the first axisymmetric mode (m = 0, n = 1; his figure 7 a) should represent the f0 curve in figure 9. The trends agree well; however, differences exist in the St values. For example, at M J = 1 (acoustic Mach number M = 0.913) while St for f0 is 0.35 in figure 9, the corresponding St for Smax from the analysis is 0.41. The experimental St values are consistently lower throughout the Mach number range. It should be noted that the analysis predicts existence of upstream- and downstream-propagating guided jet waves, allowing for resonance, in narrow bands of St bounded on the upper limit by Smax. Thus at each M, it is a small band of St over which resonance is allowed. Bogey's LES results indeed yield GW peaks at somewhat lower St closer to the experimental values. Nonetheless, differences are not unexpected. The analyses assume a cylindrical vortex sheet while a practical jet's shear layer evolves. Also, the predictions in the supersonic regime are based on ideally expanded jets while the shock cell structures in a practical jet likely cause departures in the velocity profiles. These may lead to deviations in the predictions relative to practical jet behaviour, as recognised by Nogueira et al. (Reference Zaman, Bridges, Upadhyay and Brown2024).
Here, we also note that Bogey's analytical dispersion results, for acoustic Mach number M = 0.90 (M
J
= 0.983), yield saddle point Smax locations for four successive azimuthal modes at Strouhal numbers that could be read off as 0.425, 0.715, 0.995, 1.285. These almost exactly follow the
 $5/3$
,
 $7/3$
and
 $9/3$
, … fractional relationship. Thus the latter relationship noted from our experimental data likely follows, or approximates analytical solutions for dispersion characteristics of various mode shapes. Note that it may not be easy to predict the GW frequencies from the complex analyses. The analytical results may also deviate from practical jet behaviour due to simplifying assumptions. Thus even though there is no rigorous analytical basis, the correlations in figure 9, based on data from multiple jets in multiple facilities, appear robust and could be useful for noise prediction and other engineering purposes.
In figure 9, three sets of data from the present experiment are included. The first set is for the convergent SMC000 case. The large red diamond symbols represent the peak f0; a few screech data are shown by the large red circular symbols. The second set of data is for the four C–D nozzles from figure 7 run at full expansion, with additional data for a M D = 1.185 nozzle. The third set is for the M D = 1.5 nozzle run at off-design conditions (figure 8). The Strouhal number is based on the exit diameter and the ideally expanded jet velocity in all cases. It is clear that f0 for all these cases involving a variety of flow conditions is well represented by the correlation curve.
Also shown in figure 9, by the small blue circles, are screech data from our earlier experiment with a 2.54 cm diameter jet (Zaman et al. Reference Zaman, Fagan and Upadhyay2023). With increasing M J , screech is actually first heard at a high frequency that aligns with the fourth GW peak ( f3). It should be noted that this first stage is rather faint and may not be detected easily. As M J is increased further, the frequency drops and aligns with the third GW peak ( f2), then jumps to even lower frequencies to align with the second GW peak f1. The ‘A1’ and ‘A2’ screech stages coincide with the third GW peak ( f2), while ‘B’, ‘C’ and ‘D’ modes coincide with the second peak ( f1). Screech stage jump between A1 and A2 modes causes some departures around the f2 correlation. Similarly, stage jumps among B, C and D modes manifest as some departures around the f1 correlation.
Here, an earlier report by Ponton, Seiner & Brown (Reference Ponton, Seiner and Brown1997) is worth citing. It addressed the effect of nozzle lip thickness on screech frequencies, for a 2.54 cm diameter convergent nozzle. The monitoring mic was located close to the nozzle, and the spectra exhibited the telltale signs of the GW peaks. (The study focused on the screech tones, and no comments were made on the other peaks in the spectra.) The GW f0 frequencies were extracted by digitising the spectral traces, and shown in figure 9 by the solid black diamond symbols. Corresponding screech frequencies are shown by the solid black circular symbols. The overall trends, for both f0 and the screech tones, agree well with the present data. Note also that an additional stage, prior to A1 and A2, could be discerned from the Ponton et al. (Reference Ponton, Seiner and Brown1997) data.
The alignment of the screech frequencies with the GW correlation curves, again, has been an experimental observation, first noted in Zaman et al. (Reference Zaman, Fagan and Upadhyay2021). The phenomena of the GW peaks in high subsonic flow and screech in supersonic conditions appeared to have a common factor in their origin. With the advances made by analytical, numerical and experimental works in recent years, it is clear that the common factor involves the guided waves. The feedback loop in screech is found to be completed by the upstream-propagating guided waves (Gojon et al. Reference Gojon, Bogey and Mihaescu2018; Mancinelli et al. Reference Mancinelli, Jaunet, Jordan and Towne2019; Nogueira et al. Reference Nogueira, Jaunet, Mancinelli, Jordan and Edgington-Mitchell2022; Edgington-Mitchell et al. Reference Edgington-Mitchell, Li, Liu, He, Wong, Mackenzie and Nogueira2022). The guided waves also dictate the high subsonic GW peaks, as observed first by Towne et al. (Reference Towne, Cavalieri, Jordan, Colonius, Schmidt, Jaunet and Brès2017) and elucidated further by the analyses of e.g. Bogey (Reference Bogey2021, Reference Bogey2025) and Nogueira et al. (Reference Zaman, Bridges, Upadhyay and Brown2024).
Let us note here that the mode shapes for various screech stages have been known from past experiments; the A1 and A2 stages are known to be axisymmetric (m = 0), while stage B is a precessing flapping mode (m = ±1), and stage C is a purely helical mode (m = 1); see e.g. Edgington-Mitchell et al. (Reference Edgington-Mitchell, Li, Liu, He, Wong, Mackenzie and Nogueira2022), Zaman (Reference Zaman1996) and Raman (Reference Raman1998). Consider the C stage that aligns with the f1 correlation curve in figure 9. As stated before, the GW peak f1 corresponds to the m = 1 mode. The C stage is also identified as helical in experiments. Thus the agreement between analysis and experimental observation is good. The A1 and A2 stages, known to be of axisymmetric shape from experiments, align with the f2 correlation in figure 9. This is also in agreement with the analyses referenced in the previous paragraph. The A1 and A2 stages have been shown in those references to fall within the predicted frequency range of the second axisymmetric (m = 0, n = 2) guided jet mode. Thus the latter mode, apparently completing the screech feedback loop, also dictates the mode shapes of the A1 and A2 stages. Here, another observation is worth noting in the context of this paper. Bogey (Reference Bogey2022b ) showed progressively lower azimuthal modes becoming more prominent with decreasing polar angle (θ), the axisymmetric mode becoming the most dominant in the upstream direction (at small θ).
In figure 10, carpet plots of PSD amplitudes are shown for the SMC000 case at three values of M J , as examples. These plots provide a perspective of the peaky behaviour of the spectra in the forward arc as well as the relative amplitudes of the GW peaks in the noise field. Clearly, the amplitudes in the aft direction (peak noise radiation direction) are larger. Therefore, the contribution of the GW peaks to an overall noise metric is small. However, the tonal behaviour of the GW peaks might have a greater annoyance factor in the forward arc, perhaps, for example, affecting aircraft cabin noise. Note that in supersonic conditions (figure 10 c), screech tones overwhelm the noise field. However, screech usually does not occur in larger nozzles with turbulent and non-uniform conditions, hence is not a concern from a practical point of view. The GW peaks, on the other hand, are likely to be present in those conditions. They are shown to be independent of exit boundary layer state and thickness; they also persist in nozzles with chevrons that eliminate screech. (Data for the chevron nozzles can also be found in TM2024.)
Distributions of sound pressure PSD amplitudes over the entire measurement domain shown as ‘carpet plots’ for the SMC000 nozzle at three different M J : (a) 0.857, (b) 0.983 and (c) 1.180.

A rectangular nozzle was included in the present experiment since detailed jet noise data for such a geometry have been absent in the literature, and because it exhibits a curious relationship between the number of GW peaks on the major versus the minor axes, as explained below. Figure 11 presents spectral data in the forward arc of the rectangular nozzle. Two reference mics are used, one near the long side of the nozzle (on the minor axis) and the other near the short side (on the major axis), as can be seen in figure 11(c). Two sets of data are shown – one with the far-field mic array on the major axis (figure 11 a) and the other with the nozzle turned 90° so that the far-field array is on the minor axis (figure 11 b). In each plot, the two traces at the bottom represent data from the two reference mics. First, note that the reference mic on the major axis has approximately twice the number of spectral peaks compared to that observed with the mic on the minor axis; the lowest-frequency peak f0 is the same on either side. This behaviour was noted earlier (Zaman & Fagan Reference Zaman and Fagan2019; Zaman et al. Reference Zaman, Fagan and Upadhyay2021). With rectangular nozzles of different aspect ratios (AR), the number of peaks on the major axis was found to be greater than that on the minor axis by a factor approximately equal to AR.
Sound pressure level PSD in the forward arc of the 2 : 1 rectangular nozzle at M J = 0.983 for (a) nozzle with horizontal major axis, (b) nozzle with horizontal minor axis. (c) Picture of the nozzle with reference mics.

It should be clear from the two plots in figure 11 that the same number of peaks seen in the reference mic in the near field persist in the corresponding far-field data. As with the round nozzle, the GW peaks are more pronounced at smaller polar (θ) locations. With increasing θ, the amplitudes diminish, and for approximately θ > 50°, the peaks disappear. (Further data for the rectangular nozzle at all θ and other M J are documented in the report TM2024. Similar conclusions are made regarding the relationships of the GW peak frequencies on the two sides at other Mach numbers. Screech tones also follow the GW peaks as noted with round nozzles; an interested reader may look up the cited report.)
A few sets of heated jet data are now presented. In figure 12, data for the SMC000 nozzle run at M J = 1.0, for three NTR, are shown in the top row. First, note that the GW peaks are seen in the reference mic at all NTR. At NTR = 1.8, small additional peaks appear at low frequencies in the far-field data. These amplify and spread to higher frequencies with further increase in NTR; the spectra become noisy. This noise does not appear to be a natural characteristic of the jet, but the source remains unknown. However, for this condition (around transonic M J ), the GW peaks get buried under the noise even though some of the higher-frequency peaks are still visible. On the other hand, with supersonic flows, the GW peaks are found to be clearly visible in the forward arc. An example is shown with the data in figures 12(d-f). These are for the M D = 1.8 C–D nozzle run at M J = 1.8 (design condition) at the three NTR values. The GW peaks are clear in the far acoustic field at least up to θ = 30° in all cases.
Heated jet data. The PSD of sound pressure in the forward arc for the SMC000 and M D = 1.8 C–D nozzles at three values of NTR: (a,d) 1.0, (b,e) 1.8, (c, f) 2.6. For (a–c), data are for the convergent case (SMC000) run at M J = 1.0. For (d–f), data are for a convergent-divergent nozzle with design Mach number of 1.8 run at design condition (M J = 1.8).

The GW peaks are clear in the reference mic at all temperatures. There is a temperature effect on the lowest frequency peak f0. For example, for the convergent case, its frequency increases from 2.09 to 2.49 kHz as NTR is increased from 1 to 1.8 (figure 12). However, since the exit velocity also increases, the corresponding Strouhal number (St) actually decreases from 0.338 to 0.300; such a temperature effect on the GW peaks was observed earlier by Upadhyay & Zaman (Reference Upadhyay and Zaman2022). A similar temperature effect can also be inferred for the M D = 1.8 C–D nozzle. At design NPR, increasing NTR from 1 to 1.8 increased the frequency of f0 from 1.24 to 1.39 kHz, and the corresponding St is found to decrease from 0.130 to 0.109.
Finally, in figure 13, heated jet data are shown for the M D = 1.8 nozzle at off-design conditions, all for NTR = 2.6. In the overexpanded case in figure 13(a), the first GW peak f0 is somewhat obscured but clear for smaller angles θ < 20°. In the underexpanded conditions in figures 13(b,c), the peak f0 is seen to persist at least up to θ = 35°. Note that the second GW peak f1 is prominent in all three cases. Several more sets of heated jet data, including for the rectangular case, are documented in the report TM2024. A similar conclusion about the persistence of the GW peaks in the supersonic regime is reached from all data.
The PSD of sound pressure in the forward arc of the M D = 1.8 C–D nozzle run at NTR = 2.6, for different off-design conditions: (a) M J = 1.7, (b) M J = 1.9, (c) M J = 2.0.

4. Conclusions
A specially designed experimental set-up within a high-quality anechoic facility allowed measurement of jet noise over practically the entire polar (θ) range from 10° to 165°. The measurements were carried out for convergent round and rectangular nozzles as well as several round C–D nozzles, for unheated and heated flows. Jet Mach numbers up to approximately 1.9, and temperatures up to approximately 670 °C (NTR ≈ 3.2), were covered. The far-field data were acquired at radial distance r/D = 75 from the nozzle exit, while near-field pressure fluctuations were monitored by reference microphones. The focus was on the forward arc, in the approximate range 10° < θ < 45°, where noise data had been missing in the literature. The main objective was to investigate the characteristics of tonal noise components due to the guided wave resonances. Such resonances have been shown in recent studies to generate a series of peaks in the pressure fluctuation spectrum when measured in the vicinity of the nozzle. While those spectral peaks disappear in the far acoustic field in the aft and sideline directions, which is why they went unnoticed in decades of jet noise measurements, the present study clearly demonstrates that they radiate in the forward arc. Limited but similar observation was made in at least one previous experiment as well as one LES study, as discussed in the Introduction. This paper provides the first comprehensive experimental study of the phenomenon in the forward arc. Jet noise spectra there are not smooth but are characterised by the GW peaks even at distances conventionally considered as the far acoustic field.
With increasing M
J
, the GW spectral peaks appear at high subsonic conditions, approximately when M
J
> 0.6, and persist into the supersonic regime up to the highest Mach number covered in the experiment (M
J
≈ 1.9). At a given M
J
, the peaks become increasingly prominent at shallower polar locations. At larger polar angles, they are sometimes visible up to approximately θ = 50°, but vanish thereafter. For a convergent round jet, it is shown that the amplitudes of the spectral peaks follow an
 $r^{-2}$
law, where r is the distance from the nozzle exit. Thus the amplitudes spread spherically, and these peaks are confirmed to be part of the acoustic radiation in the forward arc.
The frequencies of the spectral peaks remain unchanged with distance from the nozzle. The frequencies also remain the same with varying polar angle. The non-dimensional frequencies of the peaks follow the same correlation curves developed previously from near-nozzle pressure spectra. Data from all round C–D nozzles also follow the same curves whether the flow is over, under or fully expanded. The higher-frequency peaks follow a fractional relationship to the lowest-frequency peak f0 that agrees with predictions based on LES studies conducted by others on the phenomenon.
The GW peaks also radiate in the forward arc for a 2 : 1 rectangular nozzle. As shown before from near-nozzle measurements, the number of spectral peaks occurring on the short side is found to be twice that occurring on the long side. The same pattern is maintained in the far field of the forward arc. Thus the spectral shape and number of peaks seen in the far field depends on the orientation of the nozzle relative to the microphone array. In yet another brief experiment, the GW peaks are seen to persist even with a six-chevron nozzle.
Some departures from the observations are noted when the jets are heated. In general, the GW peaks appear to become weaker with increasing temperature (NTR). At high subsonic and transonic conditions, the first GW peak f0 peak gets buried under a background noise when NTR is greater than approximately 1.5; however, some higher-frequency GW peaks remain visible. At supersonic conditions, on the other hand, the first peak ( f0) and especially the second peak ( f1) remain visible in the spectra even at the highest temperature covered in the experiment (NTR ≈ 3.2).
Funding
This work is supported by NASA's Commercial Supersonic Technology (CST) Project under the Advanced Air Vehicles Programme, and NASA's Transformational Tools and Technologies (TTT) Project under the Transformative Aeronautics Concepts Programme.
Declaration of interests
The authors report no conflict of interest.