




Introduction
Early weaning is necessary in pig farming, but it often damages the intestines and slows growth in piglets (Cao et al. Reference Cao, Wang and Wu2018). This problem is closely linked to an imbalance in gut microbiota caused by weaning stress (Cao et al. Reference Cao, Wang and Wu2018). Importantly, such imbalance is not limited to the gut; it can also disturb the body’s overall metabolic balance and redox homeostasis (Huangfu et al. Reference Huangfu, Ma and Zhang2024; Li et al. Reference Li, Guo and Wen2018). Therefore, modulating microbial balance has become a key strategy for addressing postweaning challenges.
Under the current global ban on antibiotics in livestock feed, plant essential oils have shown promise as an effective alternative due to their antibacterial, anti-inflammatory, and digestion-promoting properties, which can support gut health in weaned piglets (Hou et al. Reference Hou, Liu and Hu2006). Among these, methyl salicylate (MS), a principal component of wintergreen oil (Deng et al. Reference Deng, Wang and Yang2017; Greene et al. Reference Greene, Rogers and Franzen2017), and tributyrin, a butyrate-donating structured triglyceride (TG), have attracted considerable interest (Donovan et al. Reference Donovan, Cadwallader and Lee2016). When tributyrin is ingested, it is released directly into the hindgut (Guilloteau et al. Reference Guilloteau, Martin and Eeckhaut2010), where it exerts several biological effects, such as regulating the intestinal microflora, improving intestinal health (Gu et al. Reference Gu, Song and Yin2017), mitigating oxidative stress (Wang et al. Reference Wang, Cao and Zhang2019), and promoting nutrient absorption.
Previous studies have shown that dietary supplementation with MS at doses of 10–40 mg/kg can significantly reduce the feed-to-gain ratio (FGR) in weaned piglets (Bampidis et al. Reference Bampidis, Azimonti and Bastos2019). Several studies showed that MS exhibited antibacterial activity against a wide range of Gram-positive and Gram-negative bacteria (Candelaria-Dueñas et al. Reference Candelaria-Dueñas, Serrano-Parrales and Ávila-Romero2021). Notably, while MS is known for its antibacterial and anti-inflammatory activities, and its derivative salicylic acid (the active metabolite of MS) has been shown to influence gut microbiota composition (Prizment et al. Reference Prizment, Staley and Onyeaghala2020), the direct and specific effects of dietary MS alone on the gut microbiota of weaned piglets remain largely unexplored.
Previously, studies have shown that the combined use of MS and tributyrin improves growth performance and remodels the gut microbiota in weaned piglets (Wei et al. Reference Wei, Mao and Liu2021), concomitantly with improvements in systemic antioxidant capacity and lipid metabolism profiles (Zhang et al. Reference Zhang, Zhang and Zhang2020). Yet, a critical question remains unanswered: does MS itself contribute to these benefits? We therefore hypothesize that MS alone is sufficient to confer similar benefits by reshaping the gut microbiota, leading to improved systemic antioxidant capacity and lipid metabolism.
Accordingly, this study aimed to clarify the specific role of MS within the effective MS-TB combination. We sought to determine whether MS alone could produce the improvements in growth performance, gut microbiota, and systemic antioxidant status. Furthermore, we aimed to identify the key types of gut microbiota that were most closely linked to the effects of MS.
Materials and methods
Animals and experimental diets
On 21 days of age, a total of 144 weaned piglets (Landrace × Yorkshire; half male, half female) with an average initial body weight of 8.12 ± 0.01 kg were randomly assigned to one of three dietary treatments. Each treatment consisted of six replicate pens, with eight piglets per pen, and there was no significant difference in initial body weight among the three treatment groups.
The three treatments were as follows: (1) Control group (CON), fed an antibiotic-free basal diet formulated to meet NRC (2012) nutritional standards (Table 1); (2) MS, fed the basal diet supplemented with 1 g/kg MS; (3) methyl salicylate plus tributyrin group (MSTB), fed the basal diet supplemented with a combination of 0.7 g/kg MS and 0.3 g/kg tributyrin. Both additives were provided by Lucta (Guangzhou) Flavors Co., Ltd.
Basic composition of diet and nutritional level

Table 1 Long description
Ingredients are listed with percentages, and nutritional levels are listed with units. Ingredient percentages are: corn 43.4, puffed corn 16.0, soybean meal 46 percent 10.0, expanded soybean meal 10.0, fermented soybean meal 5.6, fish meal 3.0, whey powder 3.0, glucose 2.0, egg yolk powder 1.0, soybean oil 1.0, and premix 5.0, with total 100.0. Nutritional levels are: metabolic energy 3173 Kcal per kg, calcium 0.79 percent, phosphorus 0.56 percent, lysine 1.36 percent, methionine 0.40 percent, and threonine 0.91 percent. Digestive energy is 3425 Kcal per kg and metabolic energy is 3173 Kcal per kg. Protein is 18.80 percent.
1 Provided per kilogram of diet: Vitamin A, 12,000 IU; Vitamin D3, 2700 IU; Vitamin E, 75 mg; Vitamin K, 1.25 mg; Vitamin B1, 1.5 mg; Vitamin B2, 2.5 mg; Vitamin B6, 2.5 mg; Vitamin B12, 0.04 mg; Niacin, 34.4 mg; Mn, 50 mg; Cu, 100 mg; Fe, 110 mg; Se 0.5 mg.
2 Digestive energy and metabolic energy are calculated values, while the levels of other nutrients are measured.
The experiment lasted for 33 days. Body weight was recorded individually at the beginning and end of the trial, and feed intake (FI) was recorded per pen every 3 days.
Collection of blood, fecal samples, and rectal content
Blood samples were collected using both procoagulant and anticoagulant tubes (n = 8). The samples from the anticoagulant tubes were stored at 4°C, while those from the procoagulant tubes were collected and centrifuged at 3000 × g and 4°C for 15 minutes; thereafter, the serum was stored at −20°C. Rectal contents were collected, immediately frozen in liquid nitrogen, and stored at −80°C.
Serological biochemical analysis, antioxidant capacity, and inflammatory markers
Serum total protein (TP), glucose (Glu), urea, alanine aminotransferase (ALT), aspartate aminotransferase (AST), lactate dehydrogenase (LDH), total cholesterol (Tchol), high-density lipoprotein cholesterol (HDL-C), low-density lipoprotein cholesterol (LDL-C), and TG concentrations were quantified using a fully automated hematology analyzer (XN-2000-A1, SYSMEX, Kobe, Japan). Antioxidant parameters, including blood total antioxidant capacity (T-AOC), malondialdehyde (MDA), total superoxide dismutase (T-SOD), and glutathione peroxidase (GSH-PX), were determined following the manufacturers’ instructions employing commercial kits. T-AOC (no. BC1315) and MDA (no. BC0025) kits were from Beijing Solarbio Science & Technology Co. Ltd, and T-SOD (no. A001-1-1) and GSH-PX (no. A005-1-2) kits were from Nanjing Jiancheng Bioengineering Institute.
Hematological analysis and serum inflammatory parameters
The red blood cell (RBC) count, hematocrit (HCT) level, white blood cell (WBC) count, platelet (PLT) count, thrombocytocrit (PCT) level, neutrophil (NEU) count, monocyte (MONO) count, eosinophil (EOS) count, basophil count, and lymphocyte (LYM) count in the collected blood were determined using the ProCyte Dx hematology analyzer (IDEXX Laboratories, Westbrook, Maine, USA). Tumor necrosis factor-alpha (TNF-a) (RX500888P) and interleukin-6 (IL-6) (RX501064P) were determined following the manufacturers’ instructions employing commercial kits (Beyotime Biotechnology, Shanghai, China).
16S rDNA sequencing analysis
Microbial DNA was extracted from rectal contents using a commercial kit (E.Z.N.A.® DNA Kit, Omega Bio-tek) following the manufacturer’s instructions. The V4–V5 region of the 16S rDNA gene was amplified and sequenced on an Illumina MiSeq platform (2 × 250 bp) at Shanghai BIOZERON Co., Ltd.
Linear discriminant analysis effect size (LEfSe) was used to identify differential bacterial taxa (Segata et al. Reference Segata, Izard and Waldron2011). Briefly, the Kruskal–Wallis test was applied to detect significant differences among groups, followed by LDA to estimate the effect size of each differentially abundant taxon (Ijaz et al. Reference Ijaz, Ahmed and Zou2018). Functional predictions of the gut microbiota were performed using PICRUSt based on the KEGG database. Operational Taxonomic Unit (OTU) abundance data were processed with Mothur and used as input for PICRUSt v1.1.0.
Correlation analyses were performed using the psych package, with P-values adjusted by false discovery rate. Redundancy analysis, co-occurrence pattern analysis, and modular network mapping were carried out using the openxlsx, spiecEasi, and NetCoMi packages, respectively.
Experimental unit and sample size calculation
A total of 144 weaned piglets were housed in 18 pens (6 pens per dietary treatment, with 8 piglets per pen). Since the dietary treatments were applied at the pen level, the pen was considered the independent experimental unit for all growth performance analyses (n = 18). Individual body weight measurements from the eight piglets within each pen were used to calculate a single, representative value for that pen at each time point.
The sample size for this study was determined a priori using G*Power software (version 3.1.9.7). A power analysis was conducted for a one-way ANOVA design to compare the three treatment groups, with the pen as the experimental unit. Based on previous studies investigating the effects of plant essential oils and their active components(Wei et al. Reference Wei, Mao and Liu2021; Y. Zhang et al. Reference Zhang, Deng and He2021), we anticipated a large effect size (f) of 0.4. With a significance level (α) of 0.05 and a desired statistical power of 80%, the analysis indicated that a minimum of five pens per treatment group was required. To ensure robust results and account for potential variability, the study ultimately assigned six pens per treatment group.
Statistical analysis
For growth performance data measured over time, the average value for each pen was calculated at each time point. These pen-level averages were then analyzed using a repeated-measures ANOVA, with treatment as the between-subjects factor and time as the within-subjects factor.
For other data obtained at a single time point, a one-way ANOVA was performed on the pen-level averages. Tukey’s multiple comparison test was used for post hoc analysis of normally distributed data with homogeneous variances. The Kruskal–Wallis test with Dunn’s multiple comparison test was utilized for nonnormal or heterogeneous data. The analysis was performed using GraphPad Prism (GraphPad Software 9.5.1).
All analyses regarding gut microbiota (16S rDNA sequencing) were conducted using R 4.4.2. Heatmaps and network diagrams were created with pheatmap and Cytoscape. The data are presented as the mean ± standard error of the mean. Statistical significance was defined at P < 0.05, while P-values ranging from 0.05 to 0.1 were considered a trend.
Results
Growth performance
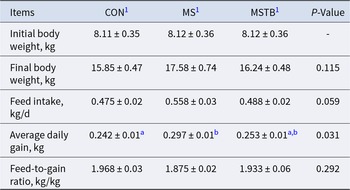
The average daily gain (ADG) was significantly greater in the MS group than in the CON group (P < 0.05), and the FI tended to increase in the MS group compared with that in the CON group (P = 0.08), but the MSTB group showed no significant change in FI relative to CON. No significant differences were observed in the FGR among the three groups (Table 2).
Growth performance of piglets in different groups

Table 2 Long description
Growth measures are listed for three groups labeled CON, MS, and MSTB, with a P Value column for each item. Initial body weight in kilograms was 8.11 plus or minus 0.35 for CON, 8.12 plus or minus 0.36 for MS, and 8.12 plus or minus 0.36 for MSTB, with the P Value shown as a dash. Final body weight in kilograms was 15.85 plus or minus 0.47 for CON, 17.58 plus or minus 0.74 for MS, and 16.24 plus or minus 0.48 for MSTB, P Value 0.115. Feed intake in kilograms per day was 0.475 plus or minus 0.02 for CON, 0.558 plus or minus 0.03 for MS, and 0.488 plus or minus 0.02 for MSTB, P Value 0.059. Average daily gain in kilograms was 0.242 plus or minus 0.01 with superscript a for CON, 0.297 plus or minus 0.01 with superscript b for MS, and 0.253 plus or minus 0.01 with superscripts a and b for MSTB, P Value 0.031. Feed to gain ratio in kilograms per kilogram was 1.968 plus or minus 0.03 for CON, 1.875 plus or minus 0.02 for MS, and 1.933 plus or minus 0.06 for MSTB, P Value 0.292. Superscript letters appear only in the average daily gain row.
1 CON = basal diet; MS = basal diet + 1 g/kg methyl salicylate; MSTB = basal diet + methyl salicylate plus tributyrin (0.7 and 0.3 g/kg diet).
a-b Values in rows with different superscript letters differ significantly (P < 0.05).
Serum biochemical indices
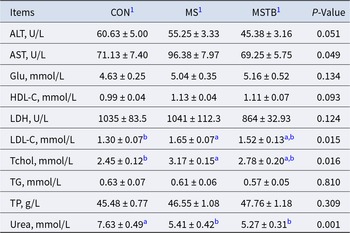
No significant differences were found among the three groups for serum LDH, Glu, or HDL-C (all P > 0.05). For ALT and AST, overall group differences did not reach statistical significance; nevertheless, the MSTB group tended to have lower levels of both enzymes compared with the CON and MS groups (P < 0.1). However, LDL-C levels were higher in the MS group than in the CON group (P < 0.05). Tchol level was notably elevated in the MS groups (P < 0.05) compared to those in the CON group. There was no significant difference in TG and TP among different treatments. Urea level was lower in both the MSTB group and MS group (P < 0.05) compared to the CON group (Table 3).
The influence of different treatment regimens on basic serum biochemical indices in piglets

Table 3 Long description
Serum biochemical indices are listed for three groups labeled CON1), MS1), and MSTB1), with a P-Value column. ALT in units per liter was 60.63 plus or minus 5.00 for CON1), 55.25 plus or minus 3.33 for MS1), and 45.38 plus or minus 3.16 for MSTB1), P value 0.051. AST in units per liter was 71.13 plus or minus 7.40, 96.38 plus or minus 7.97, and 69.25 plus or minus 5.75, P value 0.049. Glu in millimoles per liter was 4.63 plus or minus 0.25, 5.04 plus or minus 0.35, and 5.16 plus or minus 0.52, P value 0.134; HDL-C was 0.99 plus or minus 0.04, 1.13 plus or minus 0.04, and 1.11 plus or minus 0.07, P value 0.093. LDH in units per liter was 1035 plus or minus 83.5, 1041 plus or minus 112.3, and 864 plus or minus 32.93, P value 0.124. LDL-C in millimoles per liter was 1.30 plus or minus 0.07 with superscript b for CON1), 1.65 plus or minus 0.07 with superscript a for MS1), and 1.52 plus or minus 0.13 with superscripts a,b for MSTB1), P value 0.015; Tchol was 2.45 plus or minus 0.12 with superscript b, 3.17 plus or minus 0.15 with superscript a, and 2.78 plus or minus 0.20 with superscripts a,b, P value 0.016. TG in millimoles per liter was 0.63 plus or minus 0.07, 0.61 plus or minus 0.06, and 0.57 plus or minus 0.05, P value 0.810; TP in grams per liter was 45.48 plus or minus 0.77, 46.55 plus or minus 1.08, and 47.76 plus or minus 1.18, P value 0.309. Urea in millimoles per liter includes superscripts, with 7.63 plus or minus 0.49 marked a for CON1), 5.41 plus or minus 0.42 marked b for MS1), and 5.27 plus or minus 0.31 marked b for MSTB1), P value 0.001.
1 CON = basal diet; MS = basal diet + 1 g/kg methyl salicylate; MSTB = basal diet + methyl salicylate plus tributyrin (0.7 and 0.3 g/kg diet).
a-b Values in rows with different superscript letters differ significantly (P < 0.05, n = 8).
Antioxidant capacity and inflammatory markers
T-AOC levels were significantly higher in both the MSTB group (P < 0.05) and MS group (P < 0.001) than in the CON group. There was no significant difference in GSH-PX, MDA, and T-SOD among different treatments (P > 0.05). There was no significant difference in TNF-α and IL-6 among different treatments (P > 0.05) (Table 4).
Serum antioxidant parameters and cytokines in different treatment groups

Table 4 Long description
Serum measures are listed for TNF-alpha, IL minus 6, GSH-PX, T-SOD, MDA, and T-AOC across three groups labeled CON1), MS1), and MSTB1), with a P-Value column. TNF-alpha in pg per mL is 54.61 plus or minus 2.15 for CON1), 56.76 plus or minus 3.14 for MS1), and 58.74 plus or minus 1.47 for MSTB1), P-value 0.475. IL minus 6 in pg per mL is 229 plus or minus 5.87 for CON1), 221 plus or minus 6.97 for MS1), and 246 plus or minus 10.00 for MSTB1), P-value 0.1009. GSH-PX in U per mL is 693 plus or minus 56.31 for CON1), 742 plus or minus 58.17 for MS1), and 822 plus or minus 99.65 for MSTB1), P-value 0.4797. T-SOD in U per mL is 220 plus or minus 21.72 for CON1), 218 plus or minus 21.00 for MS1), and 223 plus or minus 14.22 for MSTB1), P-value 0.9837. MDA in mmol per mL is 2.03 plus or minus 0.19 for CON1), 2.22 plus or minus 0.22 for MS1), and 1.90 plus or minus 0.25 for MSTB1), P-value 0.5976. T-AOC in mmol per mL is 0.21 plus or minus 0.15 with superscript b for CON1), 0.95 plus or minus 0.23 with superscript a for MS1), and 0.57 plus or minus 0.08 with superscript a for MSTB1), P-value 0.0058.
1 CON = basal diet; MS = basal diet + 1 g/kg methyl salicylate; MSTB = basal diet + methyl salicylate plus tributyrin (0.7 and 0.3 g/kg diet).
a-b Values in rows with different superscript letters differ significantly (P < 0.05, n = 8).
Blood routine indicators
There were no significant alterations in the RBC count, PLT, or Reticulocyte (RETIC) across any of the three groups (P > 0.05). WBC counts in the MS and MSTB groups were notably lower than those in the CON group (P < 0.05). NEU decreased in both the MSTB group and MS group (P < 0.05) compared with that in the CON group. Additionally, the EOS was significantly lower in the MS group than in the MSTB group (P < 0.05) (Table 5).
Impact of various treatment group additions on standard blood indices in piglets

Table 5 Long description
Blood indices are reported for three groups labeled CON1), MS1), and MSTB1), with a p value column. HCT percent was 37.69 plus or minus 0.55 in CON1), 35.39 plus or minus 1.59 in MS1), and 34.66 plus or minus 1.50 in MSTB1), p value 0.254. RBC in M per microliter was 6.84 plus or minus 0.14, 6.43 plus or minus 0.29, and 6.57 plus or minus 0.33, p value 0.554; RETIC in K per microliter was 132.00 plus or minus 35.63, 166.60 plus or minus 16.83, and 195.20 plus or minus 27.25, p value 0.326. WBC in K per microliter was 23.22 plus or minus 1.04 with superscript a in CON1), 17.77 plus or minus 0.96 with superscript b in MS1), and 17.66 plus or minus 1.17 with superscript b in MSTB1), p value 0.002. NEU in K per microliter was 9.93 plus or minus 0.93 with superscript a, 7.01 plus or minus 0.68 with superscript b, and 6.84 plus or minus 0.67 with superscript b, p value 0.019. PLT in K per microliter was 540.30 plus or minus 60.07, 462.30 plus or minus 67.80, and 592.40 plus or minus 44.78, p value 0.307; EOS in K per microliter was 0.31 plus or minus 0.05 with superscripts a and b, 0.21 plus or minus 0.02 with superscript b, and 0.37 plus or minus 0.03 with superscript a, p value 0.040. LYM in K per microliter was 11.29 plus or minus 1.14, 9.89 plus or minus 0.64, and 11.09 plus or minus 0.73, p value 0.476; PCT percent was 0.55 plus or minus 0.06, 0.60 plus or minus 0.04, and 0.54 plus or minus 0.11, p value 0.812; MONO in K per microliter was 1.73 plus or minus 0.30, 1.23 plus or minus 0.20, and 1.40 plus or minus 0.14, p value 0.306. Superscript letters appear on WBC, NEU, and EOS values.
1 CON = basal diet; MS = basal diet + 1 g/kg methyl salicylate; MSTB = basal diet + methyl salicylate plus tributyrin (0.7 and 0.3 g/kg diet).
a-b Values in rows with different superscript letters differ significantly (P < 0.05, n = 8).
Compositional profiles of the intestinal microbiota
The Venn diagram displays the unique Amplicon Sequence Variant (ASVs) for each of the three groups (Fig. 1A). The alpha diversity analysis indicated that the Chao1 index and Pd_faith index of the MS group were significantly higher than those of the CON group (Fig. 1B, C). In contrast, no significant differences in these indices were observed between the MSTB and CON groups. Beta diversity analysis revealed an increase gradually in unweighted UniFrac distance across groups. Specifically, the MSTB group showed a significantly greater distance than the CON group (P < 0.05), and the MS group exhibited a significantly greater distance than both the CON and MSTB groups (P < 0.05) (Fig. 1D). The relative abundances of bacterial taxa are shown at the phylum level (Fig. 1E) and genus level (Fig. 1F). A cladogram of the three groups of bacterial taxa analyzed by LEfSe revealed biomarkers of high-dimensional bacteria in different groups (Fig. 1G). The biomarker in the MS group was Prevotella (Fig. 1H). Dominant species network analysis indicates that Firmicutes_A was the keystone species (Supplementary Fig. 2A, B). A total of 488 KEGG Orthology identifiers (KOs) showed significant differential abundance among the three groups. Specifically, the abundance of KOs involved in fatty acid metabolism, including K0570 and K0666, was highest in the MS group, followed by the MSTB group, and lowest in the CON group. Similarly, other fatty acid metabolism-related KOs such as K0249 and K0507 also showed increased abundance in the MS group (Fig. 1I). The MS group also resulted in significantly higher activity in amino acid metabolism and metabolism of cofactors and vitamins compared with the CON group (Supplementary Fig. 1A, B).
High-throughput sequencing of 16S rRNA in piglet rectal contents. (A) Venn analysis of the bacterial ASVs composition among the three groups. (B) Chao1 index. (C) Pd_faith index. (D) Group distance expressed as the unweighted UniFrac index. (E) Proportional taxonomic assignments at the phylum level from the three groups. (F) Proportional taxonomic assignments at the genus level from the three groups. (G) Bacterial taxon cladogram. (H) LDA score (top 20). (I) Differences in KOs. Data are presented as mean ± SEM, n = 6. Stars (a-b) indicate significant differences (P < 0.05) between groups. CON, basal diet; MS, basal diet plus an additive containing methyl salicylate; MSTB, basal diet plus additives containing methyl salicylate and tributyrin.

Figure 1 Long description
The infographic consists of multiple panels: (A) A Venn diagram showing unique and shared bacterial ASVs among CON, MS and MSTB groups. (B) Box plot of the Chao1 index for the three groups, with significant differences indicated by letters. (C) Box plot of the Pd_faith index, also showing significant differences. (D) PCoA plot of microbial communities with group ellipses. (E) Bar chart of relative abundance at the phylum level for each group. (F) Bar chart of relative abundance at the genus level. (G) Cladogram depicting bacterial taxa among the groups. (H) LDA score chart for top 20 bacterial taxa, highlighting differences between MS and CON. (I) Heatmap of differences in KEGG Orthology identifiers among the groups, with a color gradient indicating abundance levels.
At the phylum level, the MS group had a significantly lower relative abundance of Spirochaetota (P < 0.05) and Firmicutes_D (P < 0.05) (Fig. 2A, B). The relative abundance of Lactobacillaceae, Muribaculaceae, and Sodaliphilus was significantly higher in the MS group than in the CON group (P < 0.05) (Fig. 2D, E, H). The relative abundance of Clostridium_T was significantly lower in the MS group than in other groups (P < 0.05) (Fig. 2G).
The relative abundance of the microbial community in piglet rectal contents. (A) Phylum: Spirochaetota. (B) Phylum: Firmicutes_D. (C) Phylum: Bacteroidota. (D) Family: Lactobacillaceae. (E) Family: Muribaculaceae. (F) Genus: Treponema_D. (G) Genus: Clostridium_T. (H) Genus: Sodaliphilus. (I) Genus: Prevotella. Data are presented as mean ± SEM, n = 6. Stars (*) indicate significant differences (P < 0.05) between groups, and stars (**) indicate very significant differences (P < 0.001) between groups. CON, basal diet; MS, basal diet plus an additive containing methyl salicylate; MSTB, basal diet plus additives containing methyl salicylate and tributyrin.

Figure 2 Long description
A bar graph with the title text, p: Spirochaetota. The x axis shows CON, MS, MSTB. The y axis label is Relative abundance percent, with tick labels 0, 2, 4, 6, 8. A bracket above CON and MS is labeled, asterisk. The bar heights are approximately CON 5, MS 1, MSTB 2. The image B showing a bar graph with the title text, p: Firmicutes underscore D. The x axis shows CON, MS, MSTB. The y axis label is Relative abundance percent, with tick labels 0, 5, 10, 15. A bracket above CON and MS is labeled, asterisk. The bar heights are approximately CON 12, MS 7, MSTB 8. The image C showing a bar graph with the title text, p: Bacteroidota. The x axis shows CON, MS, MSTB. The y axis label is Relative abundance percent, with tick labels 0, 10, 20, 30. A bracket above CON and MS is labeled, 0.0602. The bar heights are approximately CON 12, MS 25, MSTB 15. The image D showing a bar graph with the title text, f: Lactobacillaceae. The x axis shows CON, MS, MSTB. The y axis label is Relative abundance percent, with tick labels 0, 2, 4, 6, 8. A bracket above CON and MS is labeled, asterisk. A bracket above CON and MSTB is labeled, asterisk. The bar heights are approximately CON 5, MS 1, MSTB 1. The image E showing a bar graph with the title text, f: Muribaculaceae. The x axis shows CON, MS, MSTB. The y axis label is Relative abundance percent, with tick labels 0, 5, 10, 15, 20, 25. A bracket above CON and MS is labeled, asterisk. The bar heights are approximately CON 5, MS 16, MSTB 10. The image F showing a bar graph with the title text, g: Treponema underscore D. The x axis shows CON, MS, MSTB. The y axis label is Relative abundance percent, with tick labels 0, 1, 2, 3, 4, 5. A bracket above CON and MS is labeled, 0.0520. The bar heights are approximately CON 3.5, MS 1, MSTB 1.5. The image G showing a bar graph with the title text, g: Clostridium underscore T. The x axis shows CON, MS, MSTB. The y axis label is Relative abundance percent, with tick labels 0, 5, 10, 15, 20, 25. A bracket above CON and MS is labeled, asterisk. A bracket above MS and MSTB is labeled, asterisk. The bar heights are approximately CON 20, MS 7, MSTB 18. The image H showing a bar graph with the title text, g: Sodaliphilus. The x axis shows CON, MS, MSTB. The y axis label is Relative abundance percent, with tick labels 0, 5, 10, 15. A bracket above CON and MS is labeled, asterisk. The bar heights are approximately CON 3, MS 10, MSTB 8. The image I showing a bar graph with the title text, g: Prevotella. The x axis shows CON, MS, MSTB. The y axis label is Relative abundance percent, with tick labels 0, 1, 2, 3, 4, 5. A bracket above CON and MS is labeled, 0.0799. The bar heights are approximately CON 2, MS 4, MSTB 3.
Sodaliphilus was negatively correlated with serum lipid metabolism indicators, including HDL-C, LDL-C, and Tchol (P < 0.05) (Fig. 3). RDA showed similar results (Supplementary Fig. 3A, B).
Correlation analysis of microbial community. Analysis of the correlation between serum hepatic markers and the top 20 intestinal flora. The red color indicates a positive correlation, while blue indicates a negative correlation. The size of squares represents the strength of correlation. Data are presented as mean ± SEM, n = 6. Stars (*) indicate significant differences (P < 0.05) between groups. CON, basal diet; MS, basal diet plus an additive containing methyl salicylate; MSTB, basal diet plus additives containing methyl salicylate and tributyrin.

Figure 3 Long description
The heatmap illustrates correlations between microbial taxa and serum hepatic markers. The vertical axis lists taxa: ClostridiumT, Terrisporobacter, Sodaliphilus, TreponemaD, GemmigerA73129, Prevotella, Faecousia, Vescominas, BlautiaA141781, RomboutsiaB, Collinsella, Catenibacterium, Limvicinus, Escherichia710834, Lactobacillus, CAG.269, Turicibacter, Unclassified, Treponema_F and Cryptobacteroides. The horizontal axis lists markers: ALT, AST, HDL-C, LDL-C, TC, TG and Urea. The color scale ranges from negative one to one, with red indicating positive correlation and blue indicating negative correlation. The size of squares represents the strength of correlation. Asterisks mark significant correlations. Notable patterns include strong positive correlations for Sodaliphilus with HDL-C and LDL-C and Escherichia710834 with TG. Significant correlations are highlighted with asterisks, providing insights into microbial and marker relationships.
Discussion
After weaning, piglets experience intestinal microbiota imbalance, which aggravates intestinal damage through various mechanisms. Supplementing with MS and butyrate derivatives has been shown to inhibit the expression of pro-inflammatory factors, reduce the colonization of potential pathogens, and protect intestinal health (Sotira et al. Reference Sotira, Dell’Anno and Caprarulo2020). Therefore, identifying effective bioactive substances to alleviate weaning stress is particularly important for the swine industry.
MS, a major active component of Gaultheria plants, possesses anti-inflammatory, antioxidant, and analgesic properties (Zhang et al. Reference Zhang, Li and Zhang2007). Consistent with our previous findings, a 7:3 ratio of MS to tributyrin did not significantly improve growth performance, whereas a 3:7 ratio did (Wei et al. Reference Wei, Mao and Liu2021; Zhang et al. Reference Zhang, Zhang and Zhang2020). In the present study, the MSTB group (7:3 ratio) also failed to enhance growth, likely due to the lower MS dose (0.7 g/kg) compared with the MS group (1 g/kg), suggesting a dose threshold of approximately 1 g/kg for growth promotion. The 3:7 ratio, which contains a higher proportion of tributyrin, may exert its growth-promoting effect through butyrate-mediated intestinal barrier function. Nevertheless, the independent contribution of MS to these effects, particularly its impact on gut microbiota and metabolism, has not been systematically characterized.
Previous studies have shown that dietary supplementation with 0.2 g/kg tributyrin improves ADG and FGR in weaned piglets (Ficagna et al. Reference Ficagna, Galli and Zatti2024). Our results indicate that MS supplementation alone also significantly increases ADG and FI. However, in the present study, the tributyrin dose in the MSTB group was substantially lower than that effective dose, which likely explains the limited growth improvement. The efficacy of plant essential oil additives is dose-dependent, and suboptimal concentrations (either too low or too high) may lead to poor or even negative outcomes when combined with other compounds (Shao et al. Reference Shao, Peng and Wu2023). Because the MS dosage differs between the two groups, this study cannot evaluate the interaction (synergy or antagonism) between MS and tributyrin. Therefore, further investigation is needed to determine the optimal dosage for such combinations.
Serum levels of LDL-C and Tchol are recognized as key biomarkers of hepatic lipid metabolic homeostasis (Klop et al. Reference Klop, Elte and Cabezas2013). MS supplementation significantly increased Tchol and LDL-C, suggesting enhanced lipid mobilization or synthesis. In chronic inflammation models, salicylate derivatives have been shown to ameliorate hepatic lipid accumulation through their anti-inflammatory effects (Karam et al. Reference Karam, Ma and Liu2016). However, high doses of aspirin have been reported to indirectly promote hepatic lipid accumulation and inflammation (Kagawa et al. Reference Kagawa, Azuma and Akaike1999). Although MS is structurally related to aspirin, its lower systemic bioavailability and distinct metabolic fate may alter the risk–benefit balance. In the present study, the increased AST coincided with elevated blood lipids, raising the possibility that high-dose MS stimulates hepatic lipid metabolism but also imposes a metabolic burden. Notably, co-administration with tributyrin reduced AST levels. This protective effect may be mediated by butyrate, which strengthens intestinal barrier integrity, reduces endotoxin translocation, and thereby alleviates secondary liver inflammation (Wang et al. Reference Wang, Cao and Zhang2019). Thus, combining MS with tributyrin could preserve the metabolic benefits of MS while mitigating its hepatic stress.
We found that serum urea levels significantly decreased in both experimental groups following MS supplementation. A decrease in serum urea levels suggests reduced amino acid catabolism and enhanced utilization of amino acids for protein synthesis (Cappelaere et al. Reference Cappelaere, Le Cour Grandmaison and Martin2021). This shift may help alleviate metabolic stress in weaned piglets by preserving nitrogen and energy resources (Qi et al. Reference Qi, Wang and Tan2020).
Significant elevations in T-AOC were observed in both the MS and MSTB groups compared to those in the CON group, while GSH-PX levels remained unchanged. These findings align with previous reports on MS supplementation (Wei et al. Reference Wei, Mao and Liu2021). This indicates that MS supplementation significantly enhances antioxidant capacity in a dose-dependent manner. The underlying mechanism may involve activation of the Nrf2 signaling pathway, a master regulator of antioxidant responses in mammals, but this requires further investigation (Jiang et al. Reference Jiang, Lu and You2019).
The results of the present study showed that the addition of MS reduced the number of inflammatory cells, such as decreasing the number of WBCs, NEUs, and EOSs, while there was no significant change in the inflammatory parameters IL-6 and TNF-α. Administration of plant extracts mitigates diarrhea and modulates immune responses in both healthy and pathogen-challenged weaned piglets, accompanied by reduced WBC counts (Kick et al. Reference Kick, Tompkins and Flowers2012; Liu et al. Reference Liu, Song and Che2013). This effect may be attributed to MS’s direct antimicrobial activity against gut pathogens, indirectly alleviating immune activation.
Essential oils exert antimicrobial effects through membrane disruption and interference with microbial respiration (Simitzis et al. Reference Simitzis, Symeon and Charismiadou2010). Notably, Gaultherin, a natural salicylate derivative from Gaultheria yunnanensis, requires gut microbial conversion to MS for absorption and bioactivation (Zhang et al. Reference Zhang, He and Ding2006). Venn diagram analysis showed that the relative abundance of ASVs in piglets was increased in both the MS and MSTB groups compared with the CON group. The diversity index is an important indicator for assessing gut microbial homeostasis (Li et al. Reference Li, Wang and Kulyar2023). In terms of α diversity, the Chao1 index and PD index of the experimental group were significantly higher than those of the CON group, indicating enhanced microbial diversity within the gut of the experimental group. Notably, beta diversity analysis revealed a significant difference in the intergroup distances between the MS and MSTB groups, corroborating the substantial alterations in microbial composition structure following MS supplementation.
Firmicutes and Bacteroidetes are the two most important bacterial phyla in the gastrointestinal tract (Magne et al. Reference Magne, Gotteland and Gauthier2020), and the Firmicutes/Bacteroidetes (F/B) ratio is widely recognized as having an important influence on the maintenance of normal intestinal homeostasis (Stojanov et al. Reference Stojanov, Berlec and Štrukelj2020). Increases in the F/B ratio are commonly associated with inflammatory gut disease (In Reference In2020). The F/B ratio was significantly reduced by MS addition, and we suspect that MS addition may influence intestinal inflammation. The relative abundance of Spirochaetota was significantly lower, and the relative abundance of Bacteroidota was higher in healthy pigs compared to those during the diarrhea period (Wang et al. Reference Wang, Zheng and Wang2023), which may indicate that MS contributes to the reduction in piglet diarrhea.
We observed a significant positive correlation between the increase in Sodaliphilus abundance and lipid metabolism-related indicators. This finding is consistent with single-cell studies by Jia et al., which also demonstrated a close relationship between Sodaliphilus and lipid metabolism (Jia et al. Reference Jia, Zhu and Xue2024). Currently, research on Sodaliphilus remains limited, and its specific functions are still largely unexplored. Nevertheless, our results suggest that this genus may be a potential biomarker for lipid metabolic status in piglets.
MS supplementation enriched Muribaculaceae, a family negatively correlated with intestinal inflammation in colitis models (Mo et al. Reference Mo, Ni and Zhang2022), consistent with the reduced systemic inflammatory markers observed in MS-treated piglets. Conversely, MS alone decreased the abundance of Clostridium and Treponema (Louis and Flint Reference Louis and Flint2009), genera involved in carbohydrate fermentation but also linked to intestinal inflammation and disease (Gao et al. Reference Gao, Yang and Zhang2022). This selective inhibition of potentially pathogenic Clostridium_T may contribute to the modulation of systemic inflammatory status, as evidenced by the significantly reduced circulating WBC, NEU, and EOS counts. Although serum TNF-α and IL-6 levels were not significantly altered, these hematological changes suggest that MS may affect leukocyte mobilization or turnover rather than directly suppressing classical pro-inflammatory cytokine production. Interestingly, reductions in Clostridium_T and Treponema_D were attenuated when MS was combined with tributyrin, hinting that tributyrin might modify the antimicrobial spectrum of MS.
MS supplementation also increased beneficial taxa such as Prevotellaceae and Prevotella, which play key roles in fiber fermentation and carbohydrate utilization (Wang et al. Reference Wang, Zheng and Wang2023). Notably, Prevotella copri has been positively associated with fat deposition in pigs (Chen et al. Reference Chen, Fang and Wei2021), offering a potential microbial link to the elevated serum lipids and improved weight gain observed in MS-treated piglets. Together, these microbial shifts – enrichment of anti-inflammatory and metabolic beneficial taxa, alongside suppression of potential pathobionts – may underlie the improved growth performance and health outcomes associated with MS supplementation.
MS supplementation at 1 g/kg enhanced growth performance and gut microbiota richness but also induced mild hepatic stress indicators. These results indicate that 1 g/kg MS improved growth and did not cause relevant adverse effects. Future dose–response studies are needed to find a dose that works well without causing liver stress. This study did not include direct phenotypic indicators such as intestinal morphology or tight junction proteins; future research should incorporate these parameters to validate the observed effects.
Conclusion
MS supplementation improved growth performance and antioxidant capacity, reduced circulating immune cell counts (WBC, NEU, EOS), and remodeled the gut microbiota composition in weaned piglets. The concurrent elevation of serum lipid parameters and enrichment of lipid-metabolizing bacteria (e.g., Prevotella, Sodaliphilus) suggests that MS may enhance hepatic lipid turnover to support growth during postweaning stress. These findings position MS as a promising feed additive for improving health and performance in weaned piglets.
Supplementary Material
The supplementary material for this article can be found at https://doi.org/10.1017/anr.2026.10066.
Data Availability Statement
All sequencing data have been uploaded to the SRA under BioProject PRJNA1233004. Metadata for this study can be viewed on the SRA Run Selector at https://www.ncbi.nlm.nih.gov/Traces/study/?acc=PRJNA1233004.
Acknowledgements
We thank the Institute of Animal Husbandry and Veterinary Medicine, Zhejiang Academy of Agricultural Sciences, for providing the experimental facility and animals used in this study.
Author Contributions
The authors’ responsibilities were as follows – J.L., Y.M., and H.W. conceived and designed the study and method and revised the manuscript; J.L. performed the trial, analyzed the data, and drafted the manuscript; W.T., J.M., and Z.N. provided help with animal feeding and laboratory analysis; Y.M. and G.T. revised the article. All authors have read and approved the final manuscript.
Funding Statement
This study was supported by the Key R&D Projects of Zhejiang Province (2023C02026) and the Innovation Research Fund from Lucta Group.
Conflicts of Interest
The authors declare that they have no conflicts of interest.
Ethical Standards
All animal manipulations were conducted following the Measures for the Administration of Experimental Animal Use in Zhejiang Province, and this experiment was specifically approved by the Animal Care and Use Committee of Zhejiang University (ethics code permit no. ZJU20250213).



 Open access

