INTRODUCTION
Agriculture is the major economic activity of Ethiopia supporting about 85% of the country's population, which was estimated to be 75.1 million in 2006 (MoFED, 2007). It accounts for 53% of the GDP and 90% of the export earnings (Bekele, Reference Bekele2001). Despite its long history, agriculture still relies on traditional methods in Ethiopia (Shiferaw and Holden, Reference Shiferaw and Holden1999). Hence, its potential to support the increasing human population, growing annually by 2.62% (MoFED, 2007) is minimal (Tadesse, Reference Tadesse2001), eventually leading to food insecurity (Adenew, Reference Adenew2004). USAID (2004) states that 44% of the Ethiopian population is food insecure. Besides its traditionality, factors such as intensive cultivation of the farms without fallowing, the perpetual dominance of annual crops in the fields (absence of perennials), removal of crop residues for energy and construction materials, and poor soil conservation practices account for the poor performance of agriculture at household level.
Despite the low productivity (Adenew, Reference Adenew2004) – estimated to be around 1.2 t ha−1 (Dercon and Christiaensen, 2005) – cereal farming is still the most dominant farming practice in the highlands of Ethiopia with small numbers of farmers practising livestock rearing as a subsidiary income source. In an attempt to replenish the declining farmland productivity, the use of inputs such as inorganic fertilizers (e.g. urea and DAP [di-ammonium phosphate]) (Wild, Reference Wild2003), herbicides and pesticides became mandatory, and has increased the costs associated with cereal farming. Together with declining productivity, these costs reduce the net return from cereal farming.
Farmland productivity can be influenced by climate (Yesuf et al., Reference Yesuf, Falco, Deressa, Ringler and Kohlin2008), soil quality (Reeves, Reference Reeves1997) and management style. However, the impact of the former factor declines when productivity assessment is done at a specific locality as the variability in climate is minimal and hence, its impact on small-scale research is assumed to be uniform. Thus, in such cases, soil quality and management style remain responsible for variability in farmland productivity. Soil quality is a good indicator for land productivity assessment (Vance, Reference Vance2000). Hence, when assessing productivity variations, it is crucial to consider whether there are variations in soil properties among the groups being compared. Management style includes the application of appropriate inputs and the implementation of appropriate practices, such as ploughing, weeding and harvesting during the production process. In most cases, it can be affected by the availability of labour and capital. Therefore, we have given special attention to the above two major factors (soil quality and management style) during the assessment of the productivity and net returns of cereal farming in this study.
Soil degradation is one of the challenges for cropland productivity in the highlands of Ethiopia (Dubale, Reference Dubale2001). FAO (1986) estimated that around half the land area in the Ethiopian highlands is ‘significantly eroded’ and about 25% is ‘seriously eroded’. Various studies, e.g. Bojö and Cassells (Reference Bojö and Cassells1994), FAO (1986), have tried to account for the effects of soil erosion on farmland productivity and thereby estimate the losses due to it. All have indicated that there is substantial decline in crop productivity due to soil erosion. For example, FAO (1986) estimated that crop productivity declines 1–3% annually compared to the 1985 base year due to soil degradation.
In Ethiopia, various studies, such as Demeke et al. (Reference Demeke, Kelly, Jayne, Said, Le Vallée and Chen1998) and Holden et al. (Reference Holden, Shiferaw and Pender2001), have been conducted to assess agricultural productivity. But, little is known about the net returns of the agricultural activities practised by smallholder farmers, because the focus is often on productivity, rather than on the net returns from the practices. Assessing the net returns of the practices helps us to know whether the declining productivity of crop cultivation is in the net gain or loss region and has two major implications. First, if the productivity is in the loss region and farmers are still continuing with their practices, there could be four major underlying reasons. These are: i) lack of alternative livelihood options, ii) lack of experience of alternative livelihood activities, iii) unaffordability of the factors of production for the alternative practices, iv) impacts of subsistence needs (when the outputs of the unprofitable practice are critically important for the survival of the farm households, e.g. cereals in the central highlands of Ethiopia). Second, if the productivity is in the net gain region, farmers already know that it is worthwhile to continue with it. Hence, it is vital to know the net returns for the farmers and the productivity of cereal farming at farm level so that the problems and potentials associated with this dominant land use practice could be addressed. Moreover, knowledge of net return of the practice is critically important to improve the livelihood of the majority of the country's population who depend on cereal farming. This study tries to analyse the net returns of cereal farming in the central highlands of Ethiopia and determine the inputs and outputs variability based on wealth strata of the farm households. It also assesses land and labour productivity and return to scale under farm conditions of central highlands of Ethiopia.
MATERIALS AND METHODS
The study area
The study was conducted in Suba area, Welmera and Alemgana districts, Oromia regional state, Ethiopia, in 2008. Suba is situated in the central highlands of Ethiopia between 8°56′ and 9°00′N and 38°31′ and 38°35′E, and has an average altitude of 2330 m asl. The mean annual rainfall is 1056 mm, and the mean minimum and maximum monthly temperatures are 6 and 22 °C respectively, based on weather data from a nearby station. The area has a bimodal rainfall pattern with the main rainy season from mid-June to the end of September and a short rainy season between mid-April and mid-May.
Agriculture is totally rain-fed and still follows traditional methods in Suba area. Crop production is the dominant agricultural activity followed by small-scale livestock rearing. For example, 62% and 84% of the farmland is used for cereal farming in Welmera and Alemgana districts respectively (CSA, 2007). Wheat (Triticum aestivum) and teff (Eragrostis tef) are the major crops grown. As in most parts of Ethiopia, land degradation is the major problem. Soil conservation practices are rare. The topsoil is perpetually eroded, decreasing the production potential of the farms. Hence, farmers have confirmed that the long-term productivity of their farms is declining. It is this decline that makes the use of inorganic fertilizers necessary to produce crops in the area, but, at present, the availability and affordability of the inorganic fertilizers is a major challenge as the farmers explained. Whenever there is a shortage of inorganic fertilizers nationally, farmers get less, and if fertilizers are not applied to the soil at the appropriate rate, the yield will be low. Regarding the affordability, farmers confirmed that the price at the farm gates has increased so much that it has become unaffordable for them. As a solution to this, the government has developed a credit system, whereby farmers are made to pay some proportion of the fertilizer cost after the production season. But, as this credit system does not take into account the risks associated with crop production (e.g. erratic rainfall, cereal price fall on the market, etc.), some farmers are made to repay the fertilizer cost by selling their livestock or other assets they have if the crop yield fails. Such lack of risk consideration discourages farmers from using inorganic fertilizers.
Data collection
The selection of the farm households was done by the help of the local administrative bodies. They prepared a list of farmers living in the study area and categorized them in to poor, medium and rich by using criteria such as land holding (depending on the official documents from the local authorities), livestock ownership, and number and type of houses. From the list, farmers were randomly selected for each wealth class and those selected were asked for their willingness to participate in the study. Seventy-five farm households (rich [n = 25], medium [n = 28], and poor [n = 22]) actively took part in the study.
A data sheetFootnote 1 containing relevant inputs and outputs from the cereal farms was prepared and pretested (with nine randomly selected farmers from the area) to check whether the data sheet comprised all the items familiar to the farmers engaged in cereal farming activity. The pretesting also helped to check the farmers’ ease of understanding of the data sheets. The data sheets were filled by face-to-face interview with the selected farm households during appointments outside their working hours. Lastly, a group discussion was held with 15 farm household heads from the three wealth classes to ascertain the production status of the year under consideration, i.e. whether the yield was good, optimal or poor for the major cereals. In the financial analysis, the inputs and outputs were converted to local currency (ETB = Ethiopian Birr; 1 ETB = 0.09 $ USD on 25 January 2009) at farm gate values (cost and prices), which were obtained through interviews. All the input and output items have a known market value (i.e. at the farm gate) in the area except green feed, which is estimated by its equivalent livestock feed value. Labour cost was estimated by using opportunity cost method, i.e. the daily wage paid if someone works for another employer in the area, such as in nearby towns or on flower farms. In computing the draught power cost we used only the rental cost for the pair of oxen because the oxen are still assets for the households even if they do not serve for ploughing. The overall analysis was done for the production year 2007/2008, which was described by the farmers as having optimal rainfall condition and average crop yield. Productivity in this paper follows the concept of yield.
To check the variability in soil properties, soil samples were collected from ten randomly selected cereal farms across two depth levels (0–15 cm and 15–30 cm) from the three wealth classes. In each farm, soil samples were collected from five points (centre of the farm, north, south, east and west directions from the centre point) for each depth level. Then the soil samples from the five points were carefully mixed with hand according to the depth categories. These soil samples were air dried and packed in a plastic bag. From each of the composite samples, around 200 g of dry soil were brought to the soil laboratory of the Institute of Forest Ecology, University of Natural Resources and Applied Life Sciences, Vienna. The samples were then analysed for organic carbon, total nitrogen, total phosphorus, sulphur, and exchangeable bases (calcium, magnesium, potassium, and sodium).
Data organization and statistical analysis
Benefit:cost ratio (BCR) was the dominant indicator of the worth of cereal farming in this study. The term ‘benefit’ expresses the value of output attained from cereal farming activity and ‘cost’ represents all the value of inputs used within the production process. The annual net gain from cereal farming was also computed.
To check the return to scale of cereal farming in Suba area, we used the Cobb–Douglas production function (Saini, Reference Saini1974; Solomon, Reference Solomon1971; Thapa, Reference Thapa2007). This production function indicates whether there is a possibility to increase the output by increasing the production factors. This knowledge is important as it indicates the future chances of the practice being evaluated, i.e. to improve its productivity by increasing the factors of production if there is an indication of increasing return to scale from the production function. In general, the basic expression of the Cobb–Douglas production function is given as:

which can be rewritten as:

where Y is the output value in ETB, F is the farm size (ha), L is the total labour used in labour hours, C is the cash input in ETB, D is the draught power use (in number of days), α, β, σ, δ are the elasticity coefficients of the dependent variables with respect to the independent variables, A0 is the constant term and μ is the error term. Then the regression coefficients of the input variables are summed and, if the summation equals unity the return to scale is constant, if it is greater than unity the return to scale is increasing, and if the summation is less than unity the return to scale is decreasing (Saini, Reference Saini1974; Solomon, Reference Solomon1971).
The marginal value productivity (MVP) was calculated based on the elasticity coefficients for the dependent variable from the Cobb–Douglas production function. It indicates the change in the dependent variable (yield) with a unit increment of a given input item and thus, enables us to show which factors of production are critically important to increase the output from a given practice. The MVP is given by:
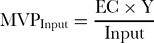
where MVPInput is the marginal value productivity of a given input variable, EC is the elasticity coefficient (regression coefficient) of the input variable and Y stands for the yield (the dependent variable) (Solomon, Reference Solomon1971). Hence, in an attempt to increase the productivity of cereal farming in central highlands of Ethiopia, we should be able to show which factors of production can be increased in order to increase the productivity and thereby improve the livelihood of the community.
The collected data was analysed using descriptive statistics, ANOVA (analysis of variance), and simple regression with Statistical Package for Social Sciences for Windows version 15.0.0 (SPSS Inc., 2006). Graphical representation was done using SigmaPlot for Windows version 10.0.0.54 (Systat Software Inc., 2006). Statistical significances were given at 5% probability unless specified.
RESULTS
Major characteristics of the local wealth classes
The three wealth categories in Suba area differ significantly as anticipated (Table 1). Table 1 illustrates the major attributes differentiating the local wealth classes based on field data. With increasing wealth level, the total land holding (ha), the cereal farm size (ha), livestock holding, number of oxen owned, family size and active labour increased. Thus, the rich group have the highest values for all the attributes shown while the poor group have the lowest for all. The observed differences in all the attributes are also statistically significant, except for the number of dependents in the farm households.
Major socioeconomic descriptors of the local wealth classes in Suba area, central highlands of Ethiopia.

Values followed by the same letter across a column are not significantly different at 5% probability.
† TLU stands for tropical livestock unit equivalent to 250 kg live animal weight.
Chemical properties of the cereal farm soils in Suba area
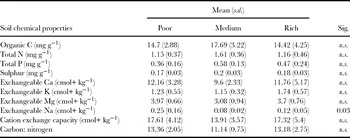
Farm soil chemical properties are shown in Table 2. It was found that the soil chemical properties did not vary among the wealth categories except for exchangeable sodium. Hence, the potential for the inherent soil properties to influence the cereal farm productivity is minimal. From the survey assessment, we found that only 9.2% of the farmers graded their cereal farms as fertile. The remaining 34.1% and 56.7% graded their land as of medium and poor fertility respectively. Nevertheless, 99.2% of the farmers confirmed that their land was suitable for crop production. Eighty-eight percent of the farmers opted to manage the poor fertility by using inorganic fertilizers and animal wastes (manure), while 9.7% of them suggested the use of household waste and cattle dung. The rest of the farmers indicated that they will change the land use to either grazing land or fallow land.
Selected cereal farm soil chemical properties across wealth classes in Suba area, central highlands of Ethiopia.

Farm input analysis
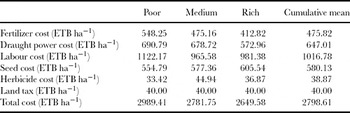
Five major cost categories were identified in cereal farming in Suba area (Table 3). These are: 1) fertilizer and herbicide costs – cover expenditures associated with the purchase of urea, DAP and herbicides applied to the farm. This cost category covers about 18% of the total costs applied to cereal farming practice. The inorganic fertilizers usage rate by the farmers in Suba area for the production year 2007/2008 was 103.2, 118.79, 137.06 kg ha−1 for the rich, medium and poor households respectively, which is in line with the average usage rate in Oromia regional state (121 and 123 kg ha−1 for wheat and teff respectively) (Demeke et al., Reference Demeke, Kelly, Jayne, Said, Le Vallée and Chen1998). It is worth noting that fertilizers are provided on quota basis, i.e. there is a limited amount of fertilizer that a farmer can get irrespective of their farm size. Hence, those farmers who own a large farm should make use of the proportionally small amount of fertilizer they get for their whole farmland. Such farmers were observed to distribute a considerable amount of animal waste on the farms during the dry season to balance the low inorganic fertilizer input. 2) Labour cost, covering 35% of the total cost, includes any form of labour input (except draught power) during the production process. It includes land-clearing costs, ploughing, sowing costs, fencing, weeding, regular attendance (protecting the cereals from wild animals and livestock), harvesting and transporting products. 3) Draught power cost is the labour of the ploughing oxen converted into monetary value and covers 24% of total cost. 4) Seed cost is the monetary value of the seeds (either improved or local seeds) which are sown and covers 21% of the total expenditure made on cereal farming. 5) Land tax includes both the tax for the land and the income tax, which is paid from the production of the cereal farm, and accounts for 3% of the total cost for cereal production. It is the only fixed cost and rarely varies from year to year.
Farm input analysis for cereal farms in Suba area, central highlands of Ethiopia, in 2007/2008 production year.

None of the results show significant differences.
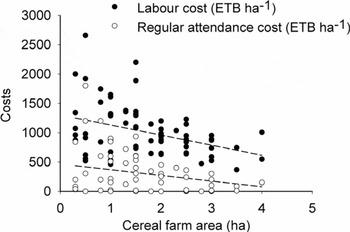
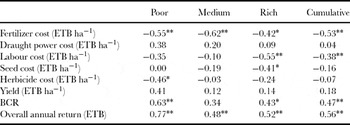
The poor households spend 3102.41 ± 1939.33 ETB annually on cereal farming, and the corresponding values are 4230.74 ± 1892.83 and 5685.40 ± 2177.49 ETB for the medium and rich households respectively. The low expenditure of the poor households could be due to the small cereal farm size they have. In general, the annual total expenditures follow the wealth categories, with the rich spending more than the medium and poor. However, expenditure per unit land follows the reverse trend of the annual total expenditure with mean (± s.d.) values of 2989.41 ± 551.18, 2781.75 ± 489.48, and 2649.58 ± 879.73 ETB ha−1 for poor, medium and rich households respectively. The high expenditure per hectare by the poor households is due to: 1) the invariable regular attendance cost across the wealth classes, because farmers stated that only one person is enough to take care of the farm whether it is small or large. This, therefore, reduces the overall cost for those having large farm size (rich households) while it increases the per unit area cost for the poor and medium group. The findings also show that farm size and regular attendance cost (ETB ha−1) are negatively correlated (r = −0.27, p = 0.02) significantly differing across the farm sizes. 2) The poor and medium households often employ their family labour on their own relatively small farms, and hence, when converted into monetary value per ha basis, the values become pronounced. The labour cost (ETB ha−1) also decreased with increasing farm size (r = −0.39, p = 0.001) (Figure 1). This finding also agrees with the results obtained by Reardon et al. (Reference Reardon, Kelly, Crawford, Jayne, Savadogo and Clay1996) in Rwanda where smaller farms used more labour. Thus, rich households are more advantaged than the other two groups.
Scatter plot of labour and regular attendance costs across cereal farm size in Suba area.

Farm output analysis
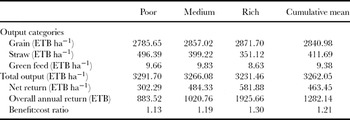
Grain, straw and green feed are the major outputs obtained from cereal farming in Suba area. The grain yield (kg ha−1) increased with increasing wealth status of the households but with no statistically significant difference among them. The average grain yield production was 610.89, 626.54 and 629.76 kg ha−1 for the poor, medium and rich households respectively. These results are consistent with the lack of difference in soil properties among the farms of the three groups. Green feed is a feed for livestock obtained when weeding or thinning the dense crops growing together. Its contribution to the overall output is very small, because in some cases such output does not exist if herbicides are applied to the farms as it could harm the livestock. Like the grain yield, there is no significant difference in the straw and green feed output from cereal farming among the farmer groups (Table 4). Generally, cereal farming yields 3262.05 ETB ha−1, and this value has shown a slight decline with increasing wealth status.
Farm output analysis and indicators for worthiness of cereal farming in Suba area, central highlands of Ethiopia.

None of the results show significant differences.
Indicators of the worthiness of cereal farming activity
Financial returns. The net return per hectare and the overall annual return from cereal farming increased with household's wealth status. The mean net return attained by the farmers is 463.45 ETB ha−1 (Table 4). Though there exists no statistically significant difference among the farmer groups in the mean net return obtained per unit area, the medium and rich farm households gain 60 and 93% more net return respectively than the poor ones. On an overall annual return basis, the rich households are 118% more profitable than the poor ones. Generally, the overall annual return increased with increasing wealth status of the households, which is a reflection of the farm size possessed by the households.
Benefit:cost ratio. The BCR was calculated as the ratio of the total output to the total input. We observed a clear pattern of increase of the ratio following household's wealth status. It also followed a similar pattern with cereal farm size (r = 0.47, p < 0.001). Thus, the rich households, because they own large farm size, have a higher BCR – indicating their greater benefit from cereal farming than the other two farmer groups. Of all the sampled households, 32% (n = 24) have a BCR less than unity, showing that they are not gaining profit from the practice. The poor households are the great losers (45.5%) with relatively fewer farmers from medium and rich households (28.6 and 32% respectively) also lie in the same category. However, as a whole, the analysis shows that the practice of cereal farming is profitable with BCR values of 1.13, 1.19 and 1.30 for the poor, medium and rich households respectively.
Land and labour productivity in cereal farming
Farmland productivity (ETB ha−1), the same as the total output per ha shown in Table 4, did not differ statistically among the wealth classes, although it decreased with increasing wealth status. The association between land productivity and farm size was observed to be weak showing slight disparity among the wealth classes. The two had relatively strong association among the poor households (r = 0.41) while the association was very weak for the medium and rich wealth classes with r = 0.12 and 0.14 respectively.
Labour productivity (ETB labour hour−1) did not differ statistically among the three wealth classes, although it increased with increasing wealth status. The labour productivities for the poor, medium and rich households were 5.78 ± 3.40, 6.15 ± 2.69 and 6.67 ± 3.69 ETB per labour hour respectively. This productivity was significantly influenced by the farm size (p = 0.037) with strong correlation of r = 0.35 (p = 0.002), which also agrees with the works of Byiringiro and Reardon (Reference Byiringiro and Reardon1996), who observed a positive relationship between farm size and labour productivity. This implies that the efficiency of labour is higher on larger farm sizes than on smaller ones indicating the advantages associated with working on larger farms.
Effect of farm size on cereal farming financial returns
The ANOVA analysis has also shown that significant differences exist in BCR (p = 0.01) and overall annual return (p < 0.001) due to variability in cereal farm size. Overall annual return (ETB), BCR and net return (ETB ha−1) had a highly significant strong positive correlation with cereal farm size (r = 0.56, 0.47 and 0.44 respectively and p < 0.001 for all) (Table 5). Thus, the rich households who own large farms are more advantaged than the others.
The correlation between farm size and various attributes of cereal farming across wealth classes.

** Significantly different at 1%.
* Significantly different at 5%.
The cost per unit area (ETB ha−1) decreased significantly with cereal farm size (r = −0.52, p < 0.001). It differed significantly across farm sizes (p < 0.005). Hence, it is an advantage for farmers with more land as the cost per unit added hectare of cereal farm decreases following the increase in cereal farm size. This could be because of the labour cost per unit area which significantly decreased with increasing farm size (r = −0.38, p = 0.001).
Effects of different scenarios on the net returns of cereal farming
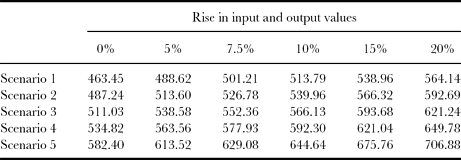
Different scenarios were developed based on: 1) the effect of administrative and technical inefficiency in the fertilizer marketing costs and 2) input and output value fluctuation assumptions. Jayne et al. (Reference Jayne, Govereh, Wanzala and Demeke2003) states that almost half of the fertilizer costs at the farm gates are imposed within the country, i.e. the cost of fertilizer at ports is nearly half its cost at farm gates. Considering this, if appropriate managerial, administrative and technical measures are taken, fertilizer costs at farm gates can be reduced by 11–18% (Jayne et al., Reference Jayne, Govereh, Wanzala and Demeke2003). Based on this report, the following scenarios were developed. Scenario 1 is the current situation, i.e. no intervention in fertilizer marketing takes place (0% reduction in fertilizer costs). Scenarios 2, 3, 4 and 5 take into account a reduction in inorganic fertilizer costs by 5%, 10%, 15% and 25% respectively at the farm gates due to the hypothesized implementation of appropriate administrative and technical measures on fertilizer marketing. The results reveal that the scenarios have a vital effect on the net return from cereal farming (Table 6). It was found that at the current farm gate values of inputs and outputs, a reduction in fertilizer costs by 5%, 10%, 15% and 25% results in 5.1%, 10.3%, 15.4% and 25.7% rise in net return per hectare from cereal farming respectively.
Change in net return (ETB ha−1) from cereal farming under different scenarios of fertilizer marketing cost regulation and input and output value rises at farm gate.
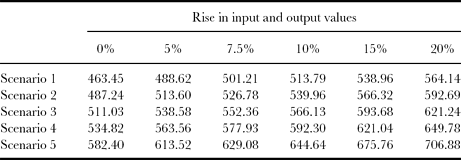
In addition to the fertilizer cost reduction, we have also tried to account for the effect of a simultaneous input and output value fluctuation on the net returns from cereal farming activity. For the ease of computation and understanding, we assumed an equivalent increase in input (except land tax) and output values at the farm gates by 0%, 5%, 7.5%, 10%, 15% and 20%. The effects of input and output value fluctuations have shown a considerable effect on the net return per hectare from cereal farming. With increasing input and output values at the farm gates, the net return per hectare has increased (Table 6). Thus, a proportional rise in input and output values is very beneficial for the farmers’ as it increases the net return.
If a strong commitment is made by the government to reduce the fertilizer marketing cost at the farm gate (i.e. reducing its cost by 25% – scenario 5), and if the input and output values increase as high as 20%, the net return from cereal farming increases by 52.5% compared to the current return (463.45 ETB ha−1).
Return to scale
Return to scale examines whether the output changes or remains constant in response to changes in input factors. When there is an increase in the output as a result of increment in the inputs, there is an increase in return to scale, and when there is no change observed, even though there is an increase in the input, the return to scale is constant. Moreover, if increasing the inputs by a certain level decreases the level of output, there is a decrease in return to scale. In this study, we check whether the change in the input categories has a vital impact on the cereal farming output to be attained.
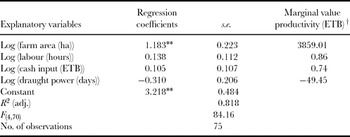
The Cobb–Douglas production function used was able to explain 82% of the variation in cereal yield attained. The remaining 18% of the unexplained variations could be due to various socio-economic differences in the community and the climatic factors that we did not consider in the model.
The coefficients (Table 7) indicate that cereal farm size has a very significant and strong effect in explaining the cereal farming output. This could be mainly due to lack of variation in soil properties, input per hectare and yield per hectare in the study area. Thus, land area remains the single most important factor to influence the total yield attained by the farm households. Draught power had a moderate negative effect on the total yield, and labour and cash input had very weak effect.
Regression results for the Cobb–Douglas production function of cereal farming in Suba area, central highlands of Ethiopia.

† Does not take the log function into consideration.
** Significant at 1%.
The regression coefficients of the explanatory variables indicate that there is an increase in return to scale as the summation of the coefficients for land, labour, cash input and draught labour sum up to 1.116, which is larger than unity. Hence, increasing the inputs can have an overall effect of increasing the output under cereal farming condition in Suba area. However, under the severe land shortage in Ethiopia, particularly in the highly populated highland areas, farmland size is a critical element to consider. As seen before, increasing output is mainly attributed to increasing farm size, which is highly constrained by land shortage. Thus, the practical possibility of improving yield by increasing the inputs is less likely as the other explanatory variables (labour, cash input and draught labour) have a very small effect on the yield increment compared to the scarce explanatory variable – farmland size (Table 7). It is, therefore, possible to envisage only a small chance of increasing the cereal yield under current conditions in Suba area.
DISCUSSION
The lack of significant difference in soil properties among the three wealth classes in Suba area can be explained by the long period of intensive cultivation, which has affected all the farms similarly. This implies that, at present, soil properties in the study area do not have any implicit effect on differences (if any) in yield or net return. There existed no statistically significant difference in the yield attained from cereal farming per unit area, which may be due to the uniform management of the farming activities and the similar farm soil properties. Hence, the observed difference in net return among the three farmer groups could be due to variability in the farm size they own (the farm size owned increased with wealth status (Table 1).
With more cereal farmland owned, the associated cost of production per unit area decreased. This could be due to the effect of labour cost, especially the regular attendance cost. Our findings show that the rich households who own an average 2.31 ha farmland spend around 415 ETB annually for regular attendance, and the poor households with a hectare of land spend 369 ETB, with no statistically significant difference. Thus, the cost associated with regular attendance is similar despite the farm size variations. Fencing, which would have compensated for this cost, does not exist for such farms due to scarcity of fencing wood.
The BCR analysis showed that every expenditure made on cereal farming has a 13, 19 and 30% net benefit for the poor, medium and rich households respectively under the production behaviour in Suba area and hence, the practice is profitable. The variability among the three groups is mainly due to land holding difference, which has direct effects on the farming cost. The major elements of the costs are labour and fertilizer cost, together covering 53% of the total costs associated with the practice. They were also the only two cost categories which showed strong significant relationship with farm size (r = −0.38, p = 0.001 and r = −0.53, p < 0.001 respectively). Our result revealed that small farms are more labour intensive and have low labour productivity than large ones. Hence, the small farms are expected to have lower BCR which is in agreement with Benjamin (Reference Benjamin1995). Therefore, the more farmland ploughed, the higher will be the BCR indicating the better advantage of the rich households than the rest.
The rise in input cost (especially inorganic fertilizers) occurring in Ethiopia is a major risk for farmers. Demeke et al. (Reference Demeke, Kelly, Jayne, Said, Le Vallée and Chen1998) and Wudineh (Reference Wudineh2009) reported rising costs of inorganic fertilizers, which they attributed mainly to the devaluation of currency, removal of subsidies and imperfectly competitive fertilizer markets. Since the fertilizer cost increment has an equal probability of occurrence for all the three wealth classes, the poor households will be more susceptible to low net return/loss as they have to cope with the rise of the input cost similar to the other groups. Even though it appears to be a risk for the farmers, our findings show that a rise in input values accompanied by an equivalent rise in output values is more rewarding in cereal farming.
Jayne et al. (Reference Jayne, Govereh, Wanzala and Demeke2003) states that domestic marketing costs account for nearly 50% of the farm gate fertilizer costs in Ethiopia and Kenya. Our findings show that if fertilizer cost is decreased by 25% at the farm gates as a result of implementation of appropriate administrative and technical measures, the net return per hectare increases by 25.67% at the current farm gate values of inputs and outputs, which of course is a huge amount of money for the farmers. Hence, we recommend that the Ethiopian government should take into account increasing the supply efficiency of the inorganic fertilizers at the farm gates to minimize the additional expenses imposed on the farmers. On the other hand, the intensification of compost and manure use can lessen the dependence on the inorganic fertilizers. To do so, there is a need for a thorough extension service for the farmers on preparation and application rates of compost, as this local fertilizer is not well known, and farmers do not usually put it on their fields but may use it on small plots close to their dwellings. Manure production is also low in the area due to animal feed shortage (Duguma and Hager, Reference Duguma and Hager2009). Growing fodder trees and shrubs on lands not used for cereal production could help to increase the feed availability for livestock and thereby promote the production of this local fertilizer. For households with few livestock, attention should be given to the utilization of compost, as they could not be able to produce a substantial amount of manure.
Farmland size was the most important determinant for the increasing return to scale potential. However, it is less likely for farmers to have more land than they own at present because of the existing land shortage problem in the country caused by the sharply increasing human population (Amsalu et al., Reference Amsalu, Stroosnijder and Graaff2007; MoFED, 2000; Woldu, Reference Woldu2008). Hence, applying the existing potential of increasing return to scale is unlikely. This implies that under similar farming practices, the potential benefit attained from cereal farms remains unchanged. Even, if soil conservation practices are applied and if appropriate soil amendment activities are implemented, the fertility of the soil declines with time in cereal-based farming systems (Denboba, Reference Denboba2005) indicating a decline in productivity. For example, Holden et al. (Reference Holden, Lofgren and Shiferaw2005) indicated that for farming practices using inorganic fertilizers, the productivity decline is estimated to be 0.55% per annum and for nonusers it is 1.1% in the central highlands of Ethiopia. Thus, the yield is expected to decline with time and hence, the BCR of cereal farming for all the farmers could decrease because the decline in fertility could mean a cost, as there is a need to compensate the fertility decline by inorganic fertilizer use. This may lead to a general decline in net return, i.e. livelihood deterioration of farmers who depend on cereal-based agriculture. To counteract this effect, there is an intense need for suitable land management options. For example, the introduction of nitrogen-fixing tree and shrub species into the farmlands through agro-forestry practices can be very helpful. Rotational fallowing can also be beneficial for the farms to retrieve their production potential. And, appropriate soil conservation practices are also mandatory to minimize the washing away of the relatively fertile top soil and offset the predicted yield decline with time.
The variability among the three wealth classes has a major implication for financial feasibility assessment studies. As shown above, the three local wealth classes differ widely by the net returns and overall annual returns they get from the practice. Thus, it is safe and wise to consider the local wealth strata in similar studies if there is an intention to better understand the net returns of a given agricultural activity. This is mainly because in the rural agrarian communities, land is the basic resource, which determines the livelihood of the household and it is generally true that rich households have more land.
The findings of this study have important implications towards promoting the livelihood of the poor sections of the community, especially in areas where there are unallocated lands owned by the state. Since farm size is the single most important factor observed to influence the net return attained from cereal farming, it is possible to balance the existing social differences due to wealth strata by land redistribution. However, since the land issue has strong political and policy implications in Ethiopia, the applicability depends on the decision-makers. If land redistribution may be applicable, factors like management ability, financial capability (possession of capital to buy external inputs) and even availability of sufficient labour need to be thoroughly investigated.
CONCLUSIONS AND RECOMMENDATIONS
Cereal farming in Suba area has a positive net return, even if the production system is still traditional. Nevertheless, if appropriate measures are not taken to abate the gradual degradation of the farmlands (leading to declining productivity) the net return from cereal farming may decline in the future. The net return attained varied with wealth status; the wealthier the household is, the higher the net return is. Farmland size is the most important variable that governs the level of net return obtained from this practice. Households with large farm size get higher net returns than others can. This is, of course, due to some of the production costs like regular attendance cost (which does not vary with farm size) and labour costs per ha (which even decreases with increasing farm size). The high net return associated with large farm size has an important theoretical implication to improve the livelihood of the poor households – increasing the farm size to increase the net return. However, land shortage is the major constraint in the country as a whole, especially in the highlands, due to high population pressure. Thus, the role of cereal farming in improving the livelihood of the community could be minimal in the future.
Therefore, to maximize the net return attained from cereal farming, attention should be given to minimizing costs of production, e.g. reducing the domestic marketing costs of inorganic fertilizers, which account nearly half the cost of this input (Jayne et al., Reference Jayne, Govereh, Wanzala and Demeke2003) at farm gates. This requires policy interventions to ease the availability of fertilizers with affordable costs at farm gates. The utilization of compost and manure is also another option to reduce the intense reliance on the costly inorganic fertilizers. Increasing labour productivity especially among poor and medium households is also important to increase the output from cereal farming.
Acknowledgements
The authors would like to thank farmers in Menagesha Suba area for their kind co-operation in providing the necessary information during the fieldwork in 2007/2008. We are also very grateful to the Austrian Exchange Service for financially supporting the first author during his stay in Austria. We thank Alemayehu Negassa, Ayantu Taddesse and Getachew Negesse for their great assistance during data collection. We also thank the two anonymous reviewers and the editorial office for the valuable inputs and comments provided.