Introduction
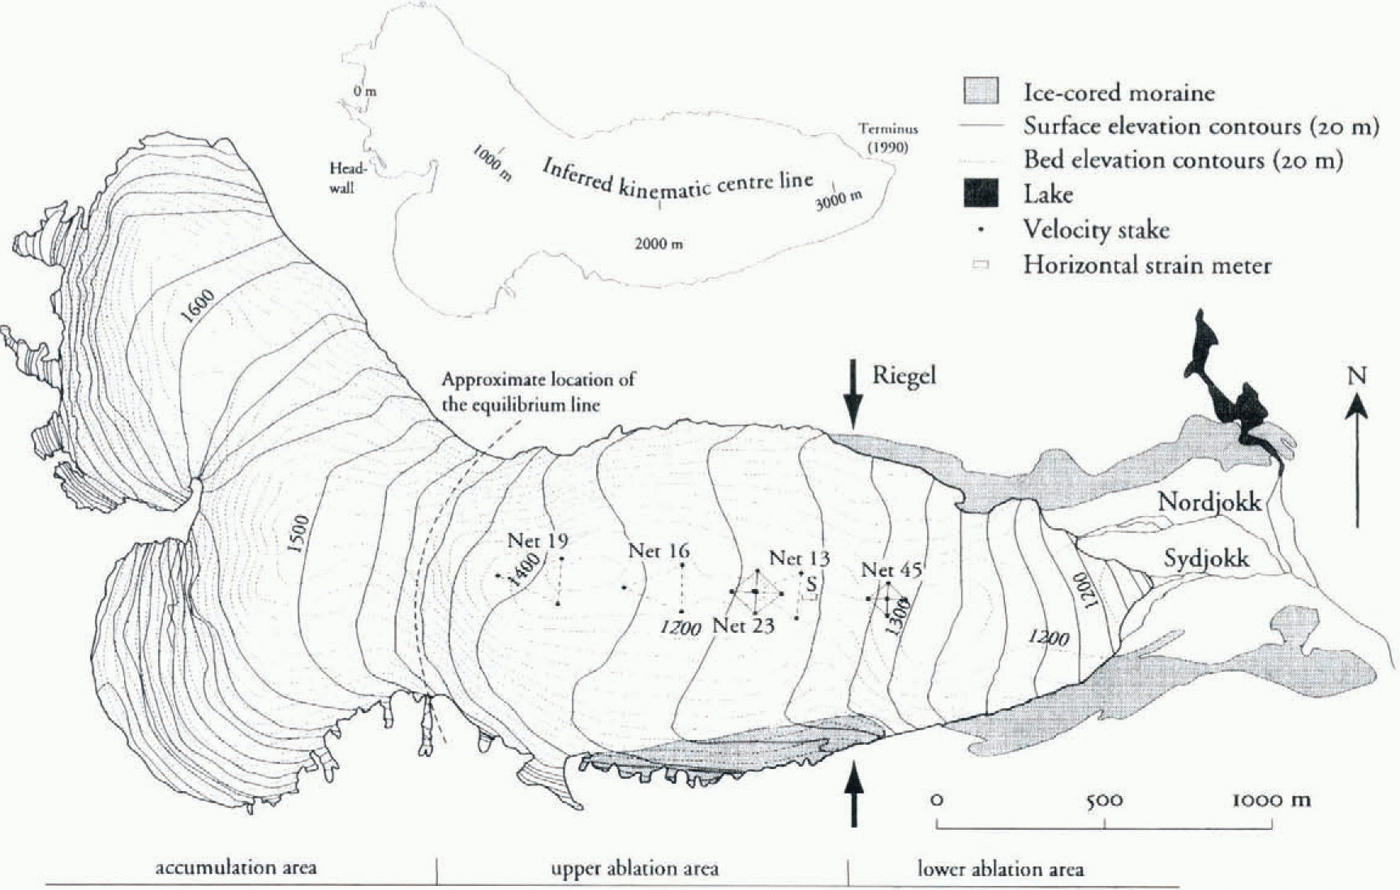
Storglaciären (Fig. 1) is a polythermal valley glacier in northern Sweden. The glacier has an average thickness of 95 m with a maximum thickness of 250 m in the upper part of the ablation area. There are four overdeepened areas in the bed, of which two are beneath the accumulation area (Herzfeld and others, 1993). The largest of these (50 m deep) is located beneath the upper part of the ablation area (Fig. 1). Hydrological and dynamical studies on the glacier indicate that the transverse bedrock ridge, or riegel, in the bed topography of Storglaciären significantly alters the hydrological system of the glacier and, hence, also the dynamics of the glacier. This justifies a division of the ablation area into two parts, henceforth referred to as the upper and lower part of the ablation area. A detailed discussion on the hydrology and dynamics of Storglaciären is given by Jansson (1996). Below, I provide a brief summary of this discussion in conjunction with a discussion of Other field observations. The present study was designed to focus on the riegel area in an attempt to provide a framework for interpreting the existing field data and investigating the effect of riegels in glacier flow.
Summary Of Field Observations
Surface velocity and glacier hydrology
Map of the ablation area of Storglaciären, northern Sweden, showing generalised surface and bed topography, the inferred kinematic centre line (on inset map), the location of the riegel, the approximate location of the equilibrium line, locations of velocity stakes, and the longitudinal strain meter.
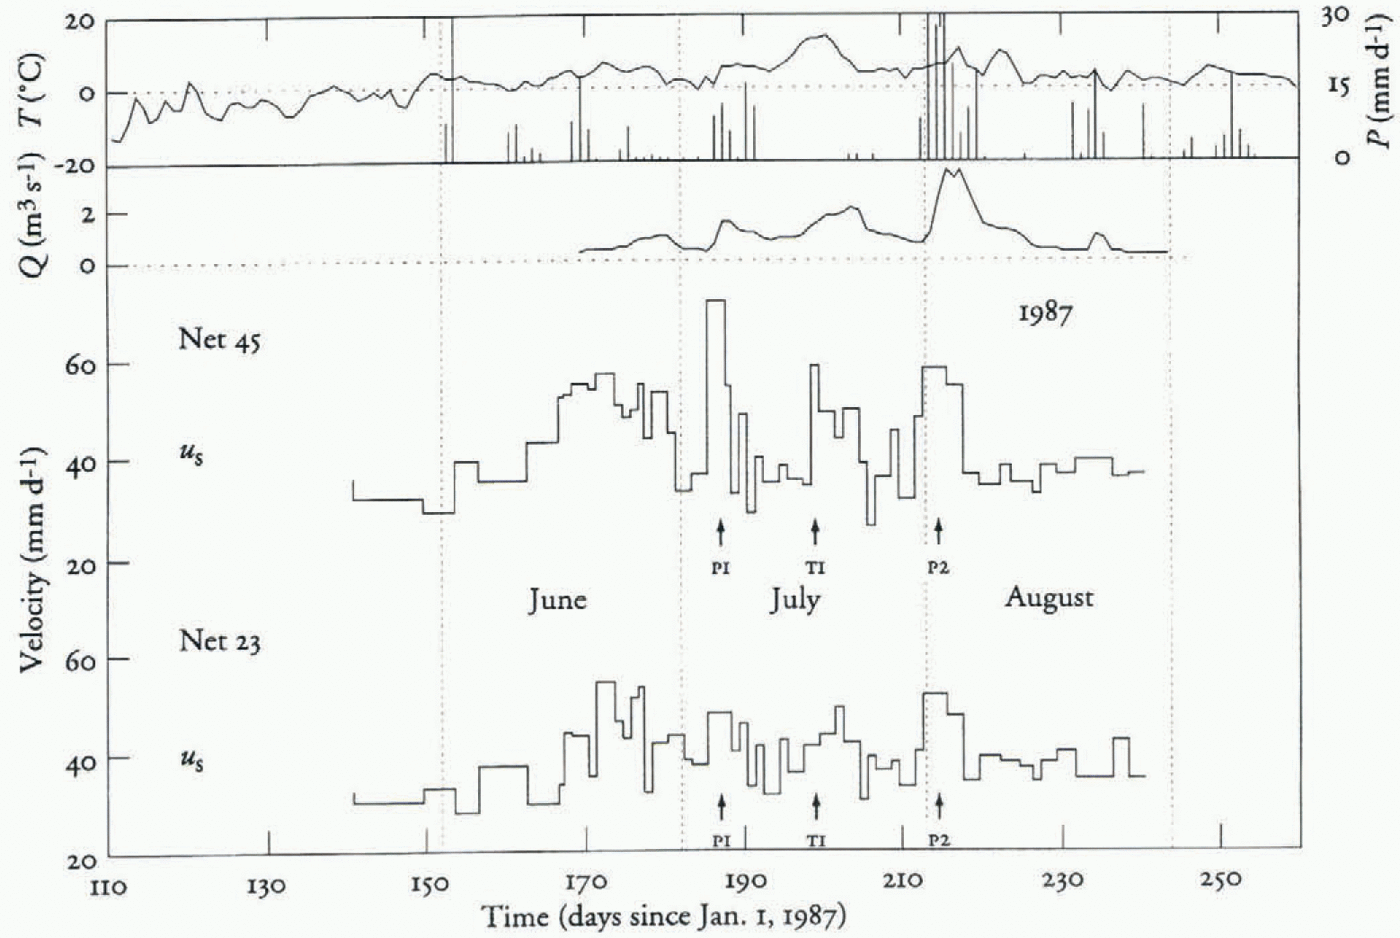
Horizontal surface velocity of stake neis 45 and 23. Daily total precipitation and daily average temperature from Tarfala Research Station, total discharge from the proglacial streams. (Precipitation on days 153 and 213 was 35.7 and 33.5 mm, respectively.)
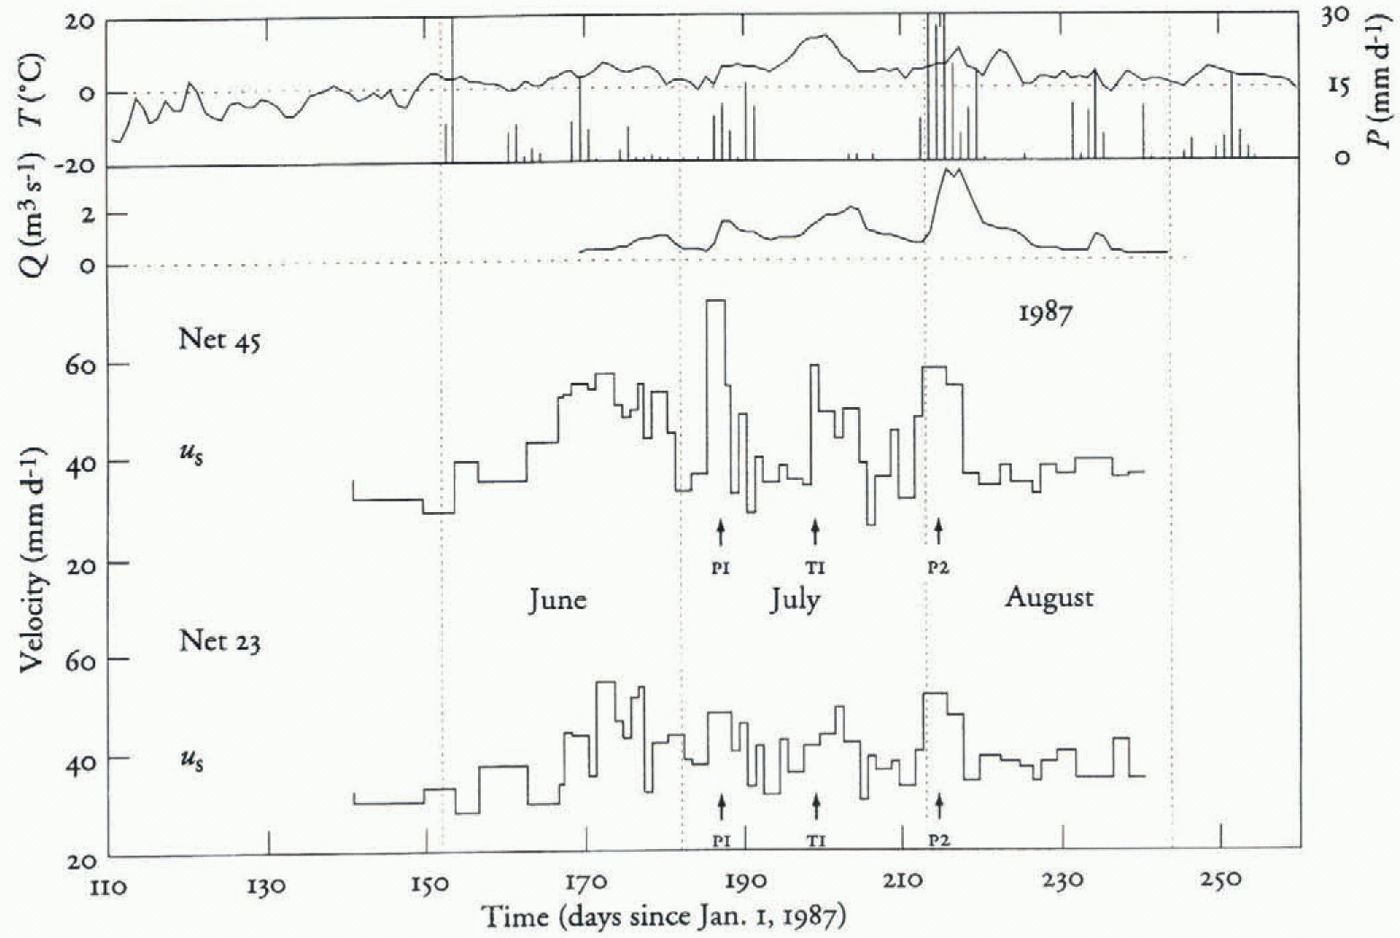
The surface velocity of Storglaciären was measured daily during the period 1985–87 in two stake nets located on either side of the riegel (Fig. 1; Jansson, 1995). The down-glacier stake net, net 45, experiences larger amplitude variations with higher peak velocities than does the up-glacier net, net 23 (Fig. 2). The variations in surface velocity seen in net 45 are a direct result of variations in basal water pressure, induced by variations in water influx (Jansson, 1995). Water-pressure recordings upstream of the riegel do not show any large fluctuations (Hooke, 1991; Hooke and Pohjola, 1994; Jansson, 1996). Hence, velocity variations in net 23 do not result from local variations in water pressure. However, because water pressure is close to flotation, even small fluctuations can lead to large variations in velocity. It is also possible that variations in velocity in the upper part of the ablation area can be induced at the up-glacier end of the major overdeepening in an area where, presumably, water enters the drainage system from the firn aquifer. If this is the case, these pressure variations are not distinguishable closer to the riegel. It should be pointed out that, because the ablation area of Storglaciären is covered by a cold surface layer, water can only enter the glacier through crevasses or moulins, found in discrete regions around the ricgel and around the equilibrium line. The velocity of net 23 can thus be a result of either push from up-glacier or pull from down-glacier but not of local conditions.
Measurements in 1988 on three velocity stake nets (13, 16 and 19 in Figure 1) on the upper part of the ablation area indicate that this part of the glacier seems to behave as a unit, at least on a daily scale (Jansson, 1993). Velocity variations are similar in all three stake nets, but the amplitude increases in the down-glacier direction. This may be due to focusing effects of the riegel or to coupling across the riegel. As with net 23, the inference regarding the origin of the variations musi be that the velocity is due either to coupling across the riegel or to accelerations initiated at the equilibrium line through variations in water influx.
The initiation of a water-influx pulse in the firn area, and especially the way in which it is transmitted through the firn aquifer, is still largely unknown. Schneider (1994) has calculated an average water percolation velocity of 0.05 m h–1 from measurements of variations in the Storglaciären firn-water table in response to precipitation events. This indicates that a typical influx peak from rainfall will be smoothed considerably before reaching the firn water storage and drainage system. It is possible that the drainage system in the firn aquifer changes through the season, increasing the effect of transient variations on the output signal as the season progresses. Schneider also found that water may be routed through buried crevasses draining to an englacial or subglacial drainage system. However, the influx to this system will also be affected by filtering effects of water percolation through porous firn. Output from firn storage should therefore exhibit low amplitude variations reflecting, say, daily average meteorological conditions. The volume of water that enters crevasses directly may superimpose a diurnal signal on the water output signal. The importance of these small variations, in terms of their effect on subglacial water pressure and hence sliding speed, is difficult to assess without direct measurements. Hooke (1991) suggests that such a mechanism is responsible for varying velocity near crevassed zones and, hence, excavation of overdeepenings through resulting temporal cyclic stress variations on the bed. Hanson and Hooke (1994) also observed diurnal velocity fluctuations near a bergschrund, and attributed these to diurnal water-influx variations. However, no direct measurements of water pressure have been made in the area around the equilibrium line nor in the area investigated by Hanson and Hooke. Schneider (1994) measured water-level fluctuations in the firn aquifer 400 m up-glacier of the equilibrium line. Here water level does not fluctuate on a diurnal basis but changes in phase with, mainly, precipitation events and, to a lesser degree, longer-term temperature variations. Thus, large-amplitude water-pressure variations are not very likely in the region near the equilibrium line, which implies that velocity variations seen on the upper part of the ablation area are not likely induced in that area.
The drainage through the upper part of the ablation area is inferred to be largely englacial (Hooke and others, 1988; Hooke and Pohjola, 1994). Hooke and others (1988) also show that a basal drainage system acts parallel to the englacial system. However, the basal system does not transmit large volumes of water. The most direct connection between influx into the glacier, through crevasses around the approximate location of the equilibrium line, and the discharge out from the glacier goes through the englacial drainage system in the major overdeepening (Hooke and Pohjola, 1994). Thus water-pressure variations must be transmitted through the englacial system. Salt tracer studies in boreholes (Hooke and others, 1988) revealed water flowing vertically from the base of the glacier towards an englacial conduit in boreholes. This flow was relatively slow, implying that the pressure difference was small. It is possible that the vertical flow was induced by pressure gradients set up by more rapidly flowing water in the englacial conduit system. The implication is that the basal and englacial drainage systems are under similar pressure. Thus, any pressure fluctuation entering the glacier in the crevassed area around the equilibrium line should be felt in both systems.
Obviously, more investigations of the sub- and englacial drainage system and ice dynamics near the equilibrium line are necessary to clarify this problem.
Continuous surface-velocity recordings
During the 1992 and 1993 seasons, continuous velocity records were obtained from two stakes, separated by 300 m and located on the inferred kinematic centre line downstream of the riegel (Iverson and others, 1995). The data show a direct correlation between velocity peaks and subglacial water pressure peaks. Water pressures recorded in 1993 in three holes on a transect along the inferred kinematic centre line all showed simultaneous variations, although sometimes varying in magnitude. Water pressure is therefore inferred to have varied synchronously throughout large parts of the lowermost part of the glacier. The recorded velocity and water pressure do not exhibit any lag. This indicates that velocity in the lower part of the ablation area is governed by local water-pressure variations there, as described by Jansson (1995). The continuous velocity data, although obtained more recently than the data discussed above, support the idea that a direct relationship exists between the surface velocity and the basal water pressures in the lower part of the ablation area.
Horizontal surface strain
Surface strain was measured in 1983 at a site between nets 45 and 23 (Jansson and Hooke, 1989; Fig. 1). Unfortunately this study was not contemporaneous with any of the daily velocity measurements. However, long-term velocity measurements in the riegel area indicate that the glacier behaved similarly in 1983 and during the 1985–88 period (Jansson, 1993). Thus, results from the strain measurements can be compared, at least qualitatively, with the velocity data.
During fair weather, horizontal strains, and hence strain rates, exhibit a diurnal cycle. Extension begins in early morning, and extensional strain rates are highest during early stages of the water-pressure rise around noon each day. Strain rates turn negative approximately when peak pressures are reached, which depends on the timing of the water-pressure cycle. This is consistent with an acceleration of the lower part of the ablation area out of phase with a similar acceleration of the upper part. Whether the upper part accelerates less or not at all is impossible to say from the strain measurements alone. The acceleration of the lower part is counteracted by an acceleration of the upper part when the water pressure reaches its peak value. The amplitude of the changes in strain is also correlated with the amplitude in the water-pressure record. Since the daily average velocity of the lower part of the ablation area is well correlated to water pressure (Jansson, 1995), the extensional strains must mean that the lower part accelerates faster than the upper part.
Glacier surface tilt
Results from sensitive tiltmeters employed on Storglaciären have been discussed by Jansson and Hooke (1989) and Jansson (1993). During days with average weather conditions, there was a diurnal “breathing” pattern suggesting uplift of the centre of the glacier in an area located just upstream of the riegel, approximately at the location of net 23. The signal can also be described as a decrease in longitudinal slope and increase in transverse slope relative to the tiltmeter site during the diurnal tilting events. The uplift has a maximum around noon, generally preceding the temperature peak, and thereby a possible water-pressure peak, by 1–2 h.
A simple interpretation of the diurnal signal would be that ice is being pushed from up-glacier and forced into vertical extension either by the constriction imposed by the riegel (transverse compression) or by encountering the ice down-glacier of the riegel (longitudinal compression) or both. Based on a cross-correlation analysis, Jansson and Hooke (1989) originally introduced an idea of a 22 h lag between the temperature peaks and tilt peaks. They further assumed that water entering the glacier around the equilibrium line was responsible for accelerations of the upper part of the ablation area. They rejected the negative 1–2 h lag, as they suggested a direct relationship between temperature and tilt. In view of short-term velocity data (Iverson and others, 1995) showing that velocity peaks in the lower part of the ablation area are well correlated with water-pressure peaks, and the horizontal strain data (Jansson and Hooke, 1989) showing that extending strain-rate peaks precede water-pressure peaks, a small negative lag between temperature and tilt is not unreasonable. Hence, an alternative explanation must also be sought.
The diurnal “breathing” pattern is very persistent through time and only replaced by a different pattern during extreme rainstorms (Jansson and Hooke, 1989). This pattern is of interest since rainstorms that produce aberrant tilt patterns are also responsible for significant changes in surface velocity. The tiltmeters indicate that both longitudinal slope and transverse slope towards the centre of the glacier are steepened in response to rainfall. This is interpreted as a drastic lowering of the centre of the glacier in the riegel area. The response of the tiltmeters to the rainfall is immediate. Because the velocity of the lower part of the glacier is strongly correlated with water-pressure variation peaks (Iverson and others, 1995; Jansson, 1995), lowering of the ice surface in the riegel area can occur by vertical compression due to longitudinal extension, if ice down-glacier of the riegel accelerates more vigorously than ice up-glacier.
One way to achieve this is if high-frequency water-input variations into the firn are filtered out so that only lowfrequency variations reach the drainage system and, hence, affect the sliding of the upper part of the ablation area, as discussed above.
Synthesis of the observations
The field data suggest that different parts of the glacier exhibit different flow mechanisms. The velocity of the lower part of the ablation area is well correlated with water-pressure variations there. The problem is the velocity measured in the upper part of the ablation area. Here velocity variations, similar to those on the lower part of the glacier, occur without corresponding basal water-pressure variations that could drive such velocity variations. The two possible processes responsible for the observed velocity distribution are (1) pulling from down-glacier or (2) pushing from up-glacier. The first process involves the lower part of the ablation area accelerating and pulling the upper part through longitudinal coupling. The second process involves the existence of water-pressure variations around the equilibrium line, not seen farther down-glacier, causing accelerations pushing the upper part of the ablation area down-glacier. The latter has the disadvantage that no water pressures showing diurnal variations have been observed in the critical areas around the equilibrium line, or anywhere else in the upper part of the ablation area (Hooke, 1991; Jansson, 1996). Water pressures are generally high in this part of the glacier that produces a situation where the glacier could accelerate in response to much smaller changes in water pressure than are needed in the lower part of the ablation area. The field data are clearly insufficient to rule out this process, although no observation has been made that clearly lends it any support.
The longitudinal coupling process is, at least partially, supported by the field data. To investigate the effects of such a mechanism and whether the mechanism is consistent with the field data, a numerical model of the glacier flow can be used. Such a model is described below.
The Finite-Element Model
A two-dimensional finite-element method (FEM) model was used to investigate the effects of different basal velocity-boundary conditions on the surface velocity distribution. The model simulates a flowline along the inferred kinematic centre line of Storglaciären (Fig. 1), and has been described by Hanson (1990). Hanson and Hooke (1994) used the model in a study of ice flow in the accumulation area of Storglaciären. The model described here uses 917 nodes and 830 quadrilateral linear elements (Fig. 3).
The model is tuned by adjusting three parameters — the shape factor (Nye, 1965), transverse strain rates and the basal velocity distribution — until a reasonable match with observed surface velocities is obtained. The shape factor seeks to account for different cross-sectional shapes of a glacier and their contribution to the resisting drag in the calculation of velocity distributions along the longitudinal centre line. Transverse strain alters the mass flux in the longitudinal direction. The effect of basal variations is obvious.
A sensitivity analysis was performed by first setting all tuning parameters to zero and running the model to obtain a reference run, after which several runs were made changing
Bed topography, surface topography, and ice thickness (dashed line) along the kinematic centre line of Storglaciären. Finite-element mesh used in calculating velocity distributions along the kinematic centre line on Storglaciären.

one, two or all the parameters to values obtained by Hanson and Hooke (1994) in their tuning of the model. The three tuning parameters were used as follows:
The sensitivity analysis revealed that varying the shape factor from the values used by Hanson and Hooke had a small effect on the model. Their distribution was therefore adopted.
The transverse strain is a parameter that allows the two-dimensional model to become pseudo-three-dimensional. Ideally, measured values of transverse strain would be entered into the model to accommodate changes in cross-sectional area along the kinematic centre line. R. LeB. Hooke (personal communication) found that use of measured transverse strains yielded calculated velocities that did not agree well with the measured velocity record. The reason for this is that strains may change in magnitude, and possibly also sign, with depth, as has been demonstrated in several borehole studies (e.g. Raymond, 1971; Hooke and others, 1992). Hanson and Hooke (1994) therefore chose to use this parameter as a pure tuning parameter but restricting variations to realistic values and realistic distributions. The same approach is adopted here.
The basal velocity distribution is the principal factor influencing temporal variations in surface velocity. The surface velocity distribution is relatively insensitive to spatially small variations in basal velocity, because of damping effects on the signal as it is transmitted through the glacier ice (Balise and Raymond, 1985). The distributions applied can therefore be described by a smooth function such as a cubic spline interpolation of a few key values. There is no reason to invoke dramatic spatial changes in basal velocity, since this boundary condition, apart from a few borehole measurements (Hooke and others, 1987, 1992; Pohjola, 1993), is largely unknown but indicates sliding speeds during summer of up to 80% of the surface speed.
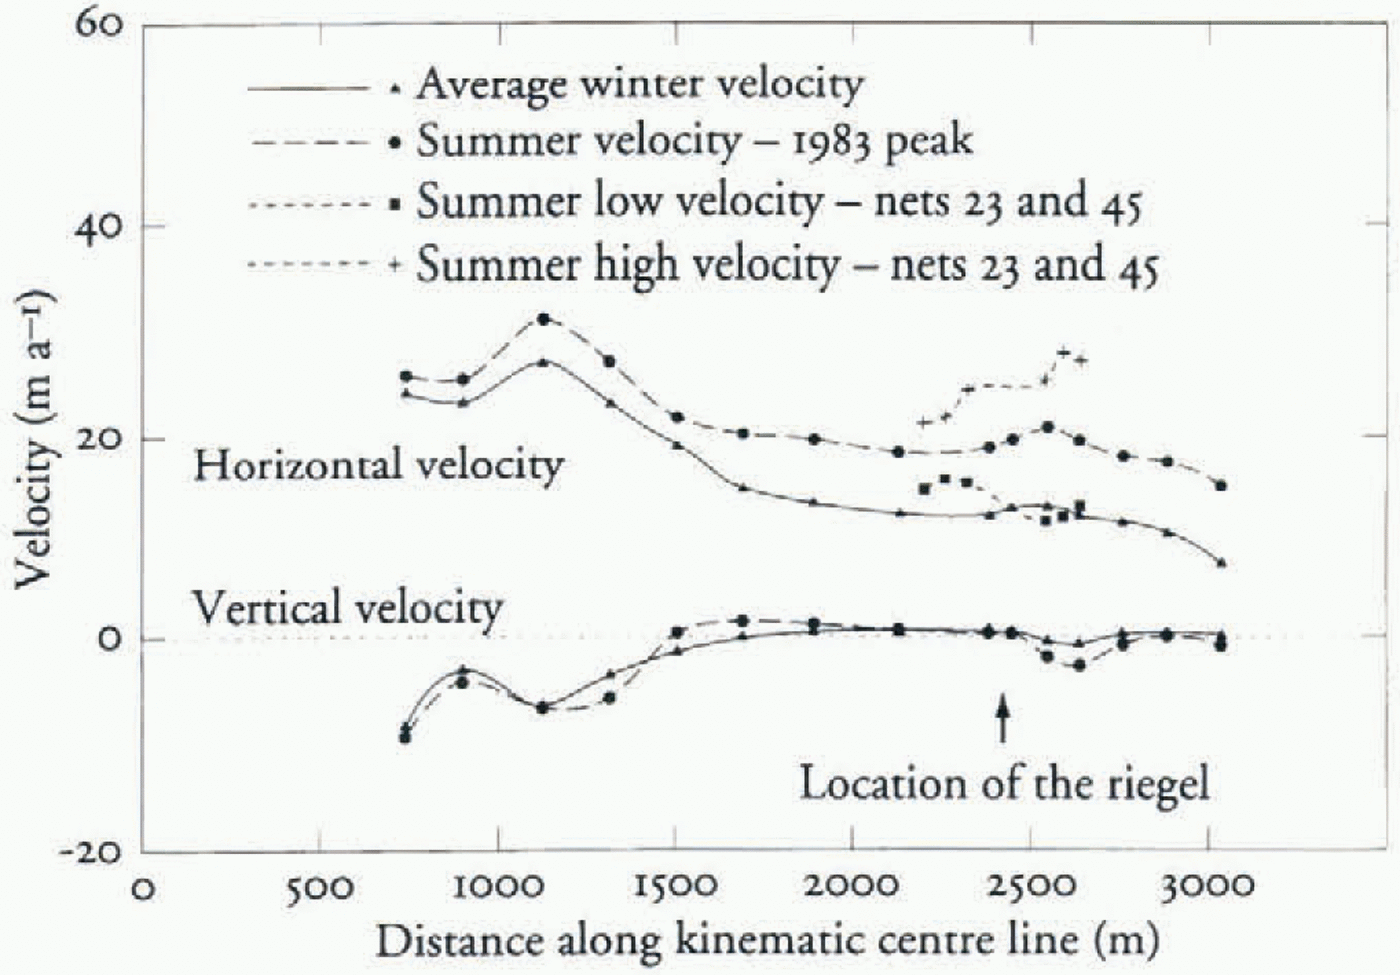
The model was first tuned using observed fall and early winter velocities (minimum sliding conditions) from Stora Staknätel (Fig. 4; Hooke and others, 1989). The tuning was achieved by first applying a basal velocity boundary condition, and modifying this until a general match with observed surface velocities was reached. A closer match was then obtained by changing transverse strains that were initially held to zero during the tuning of basal velocity.
Velocity distributions from Stora Staknätet (Hooke und others, 1989). Also shown are high and low velocity distributions from the small stake nets (limited to the riegel area). Lines represent cubic spline interpolation through the data points.

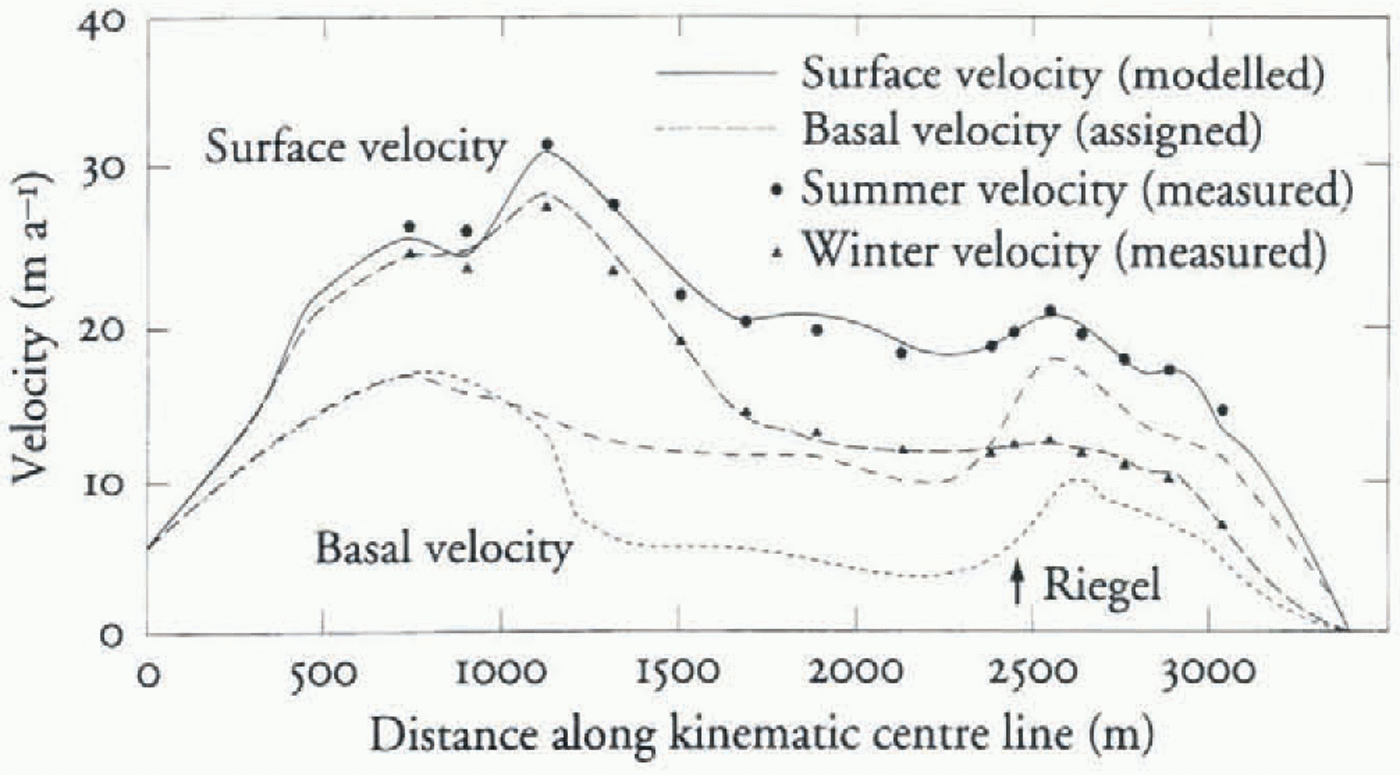
Once the tuning to winter values was done (Fig. 5), a retuning of the model to summer values was performed similarly, using winter tuning parameter values as a starting-point. The velocity distribution chosen to represent high summer values covers a 13 d period in 1983 during which a large velocity peak occurred (Hooke and others, 1989, Fig. 3a, p. 238). This period was chosen to model the glacier in high-velocity mode, in contrast to the winter low-velocity mode.
The results of the two tuning exercises indicate that sliding velocities increase seasonally mainly in the ablation area. Sliding velocities in the accumulation area could be held at a constant value for both the summer and the winter models (Fig. 5). The small discrepancy, at 750–1000 m, between winter and summer basal velocity is an effect of the interpolation scheme used. The difference is not significant for the conclusions drawn here.
Longitudinal Coupling Across The Riegel
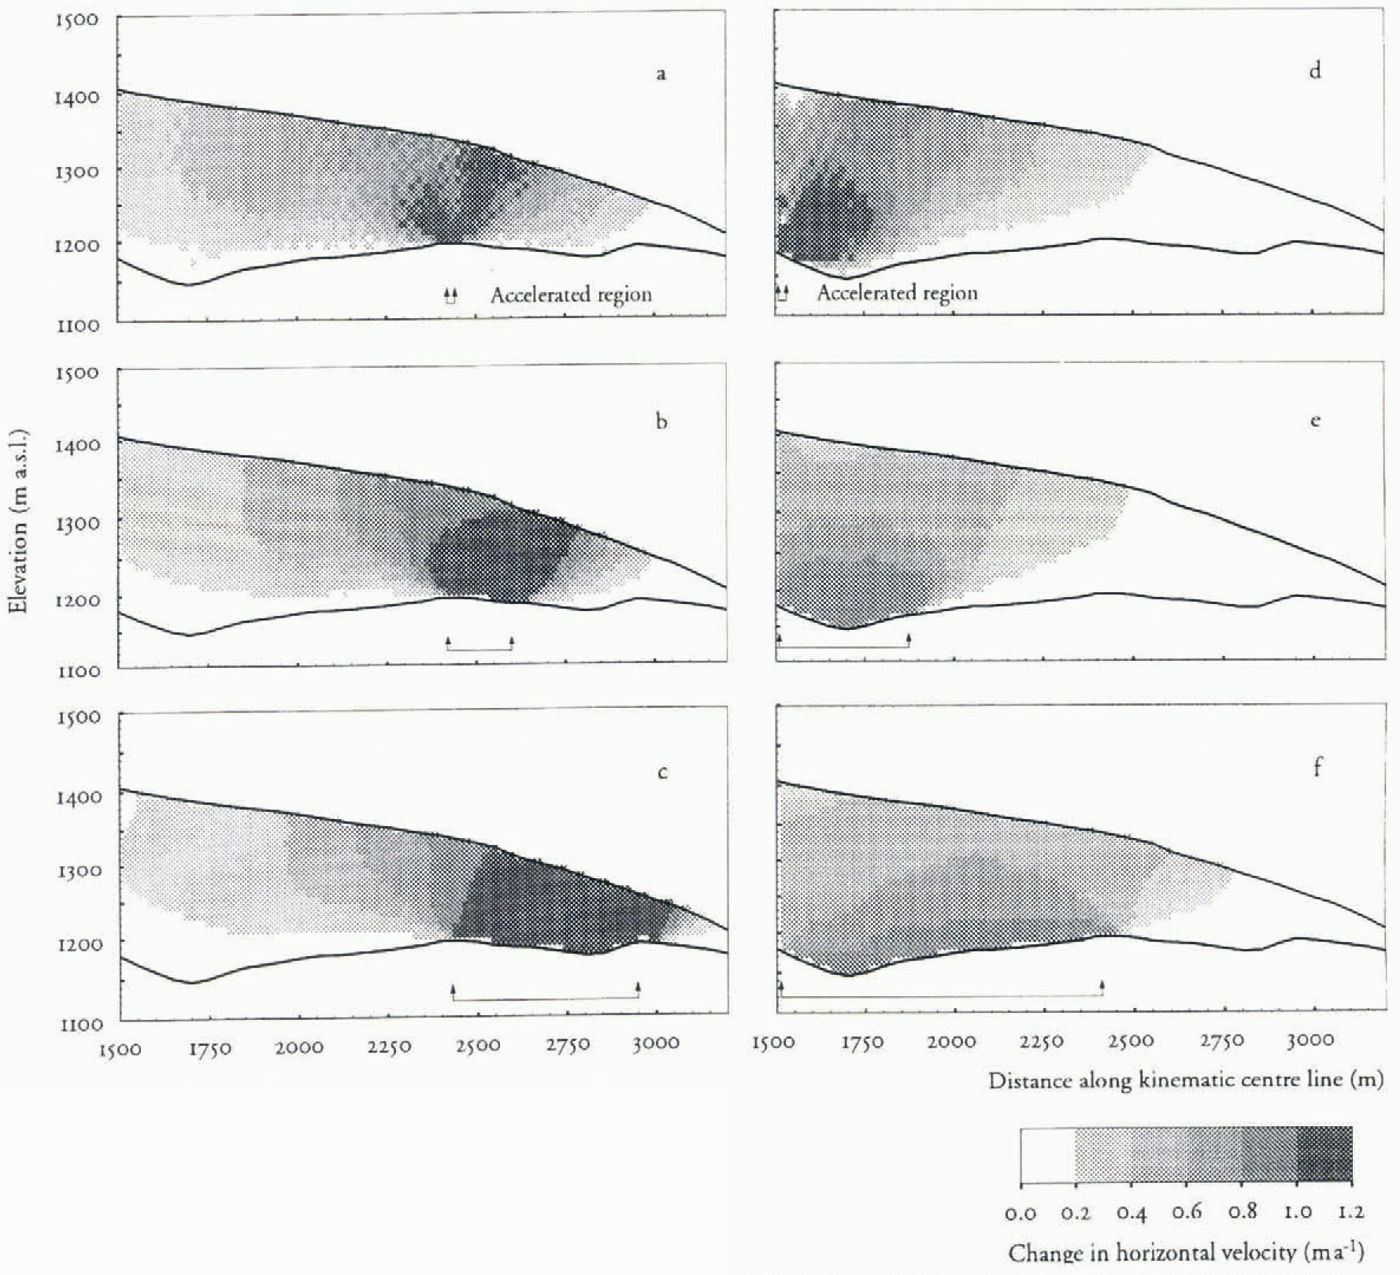
Longitudinal coupling effects across the riegel can be studied with the FEM model. figure 6a–f shows details of velocity changes throughout the thickness of the glacier. These figures illustrate how the surface velocity of the glacier is affected as the length of a perturbation is increased.
Basal and surface velocity distributions along the kinematic centre line of Storglaciären from the tuned finite-element model.
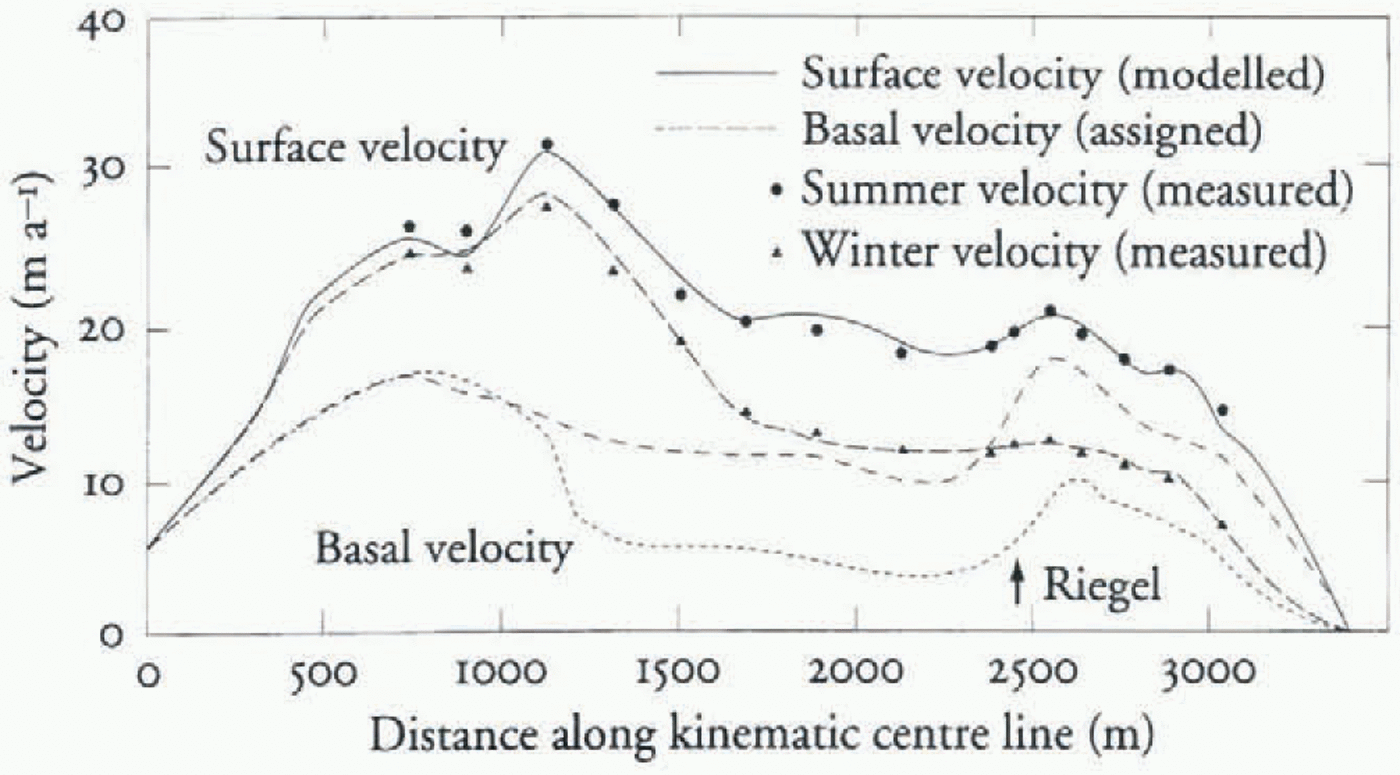
Fig. 6. Velocity change in response to a basal velocity perturbation along a flowline corresponding to the kinematic centre line. The velocity contours are in 0.2 ma–1
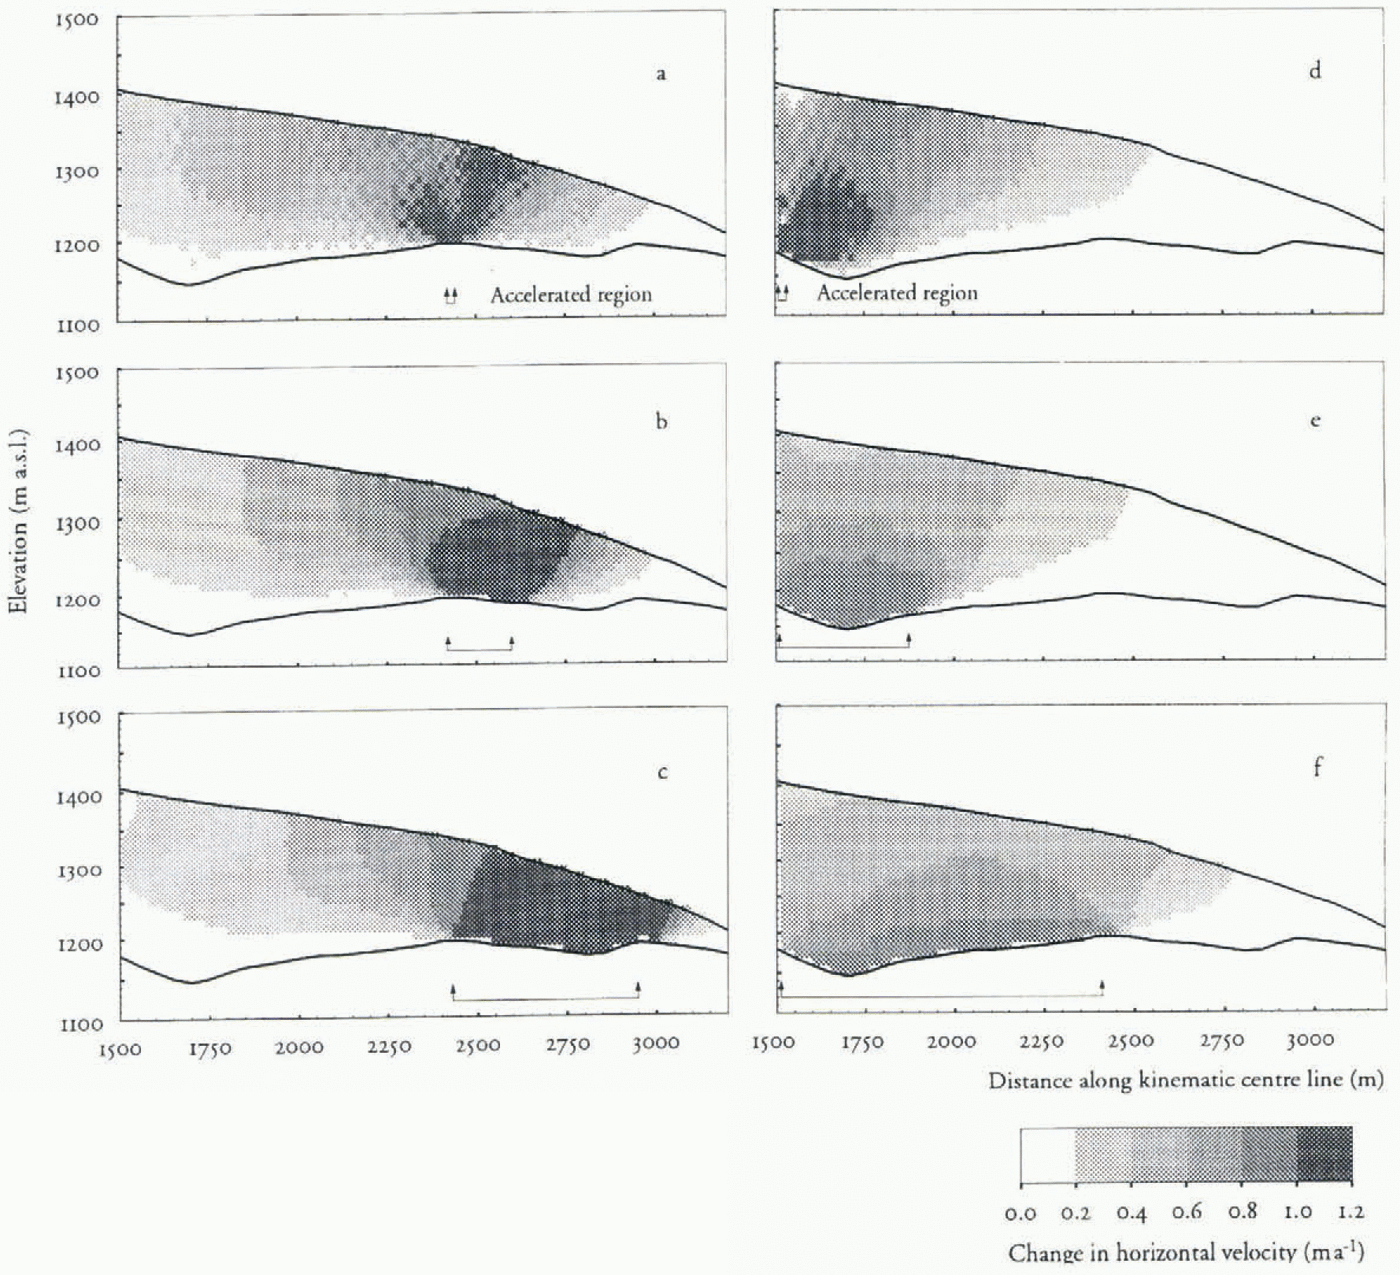
In figure 6a–c, a region down-glacier from the riegel is perturbed. It is noteworthy that large velocity-change gradients develop down-glacier from the perturbation, in contrast to the area up-glacier. This implies that strong gradients in strain rate may exist in this area. If so, large stress gradients should also be present. These will affect the driving Stress of the glacier and make calculations of the internal component of ice flow more difficult. The area where these gradients develop coincides with the riegel area and may thus help to explain the large difference in flow regime observed up- and down-glacier from the riegel.
figure 6d–f shows a perturbation starting approximately at the equilibrium line and extending down-glacier to cover the upper overdeepening. As the perturbation is increased, effects on the surface are more pronounced and propagated down-glacier. The perturbation has relatively little influence at the surface downstream of the riegel, even when the whole overdeepening is accelerated.
These results show that many of the variations in velocity may be due to pulling by longitudinal coupling across the riegel. It is particularly clear that velocity perturbations in the lower part of the ablation area may be of great importance for surface velocities observed further up-glacier.
Conclusions
The flow of the upper part of the ablation area can be explained by one of two processes. The first involves a push from up-glacier, possibly through meltwater-induced water-pressure peaks at the equilibrium line. Such water-pressure variations have not been observed but cannot be ruled out. Investigations of percolation of water in firn suggest that these variations should have long wavelength and small amplitude. This may be sufficient to produce accelerations in the area, since water pressures are generally high in the whole upper part of the ablation area.
The second process involves a pulling effect, by the lowermost part of the glacier, by means of longitudinal coupling across the riegel. Such a model is supported directly by most of the field data. Sensitive biaxial tilimeters indicate a lowering of the riegel area, indicative of longitudinal stretching. Longitudinal strain measurements show extensional strain rates during times of rising water pressures. The surface velocity is also well correlated with such water-pressure variations. This means that accelerations of the lower part of the ablation area can produce extensional strains across the riegel. The upper part of the ablation area is thus unable to accelerate as readily as the lower part. This may also be partly due to the restriction imposed on flow by the riegel.
Results from finite-element modelling show that any acceleration downstream of the riegel may affect a large area upstream of the riegel through longitudinal coupling. Longitudinal coupling may thus be a strong component of the variations in surface velocity seen in the ablation area. The effect of pushing from up-glacier cannot be discarded, because of lack of data, and remains a possible contributing factor.
Acknowledgements
Prof. R. LeB. Hooke has provided invaluable guidance and support throughout this project. Numerous people at the Tarfala Research Station have helped in collecting the data through the years; sincere thanks are due to them for their combined efforts without which this project would not have been possible. I also gratefully acknowledge two anonymous reviewers for carefully pointing out problems with the final manuscript. Financial support has been graciously given by The Swedish Society for Anthropology and Geography, The Carl Mannerfelt Fund, The Lillemor and Hans W:son Ahlmann Fund, The Swedish Touring Club fund for Scientific Research, the Helge Ax:son Johnson Foundation, The Gertrude and Ivar Philipson Foundation, The Royal Swedish Academy of Sciences, The Lagrelius fund, the Ograduerades fund, Swedish Natural Science Research Council, and the U.S. National Science Foundation (grants DPP-8414190 and DPP-8619086).