I. INTRODUCTION
In the past decade, II-VI semiconductor nanoparticles attracted much attention because of their size-dependent properties and promising applications in optoelectronics. The intensive investigations were stimulated by several application areas being envisaged for this new class of materials.Reference Nath, Chakdar, Gope and Avasthi1–Reference Alvarez, Khoury, Schaaff, Shafigullin, Vezmar and Whetten4 CdS has been widely applied in varistors, transparent conductors, transparent ultraviolet (UV)-protection films, and chemical sensors.Reference Tang and Cameron5, Reference Prevenslik6 The II-VI semiconductors such as CdSe and CdS studied for their novel size-dependent optical and electrical properties, can be prepared with very low dispersity and precise size control for particle sizes <5 nm. In the field of semiconductor nanoparticles, work focused on somewhat larger particles and the effort has been geared toward production of larger quantities of material and development of new synthetic routes.Reference Levy, Hochepied and Pileni7 The knowledge regarding particle synthesis and surface chemistry is not mature with II-VI sulfides and selenides. Size dependent optical absorption is a valuable tool to study CdS synthesized by the sol-gel preparation method. Furthermore, CdS is a technologically important material among the II-IV semiconductors and offers considerable potential for applications such as transparent UV-protection films and chemical sensors.
Spanhel and Anderson reported a simple route to achieve quantum size CdS particles.Reference Spanhel and Anderson8 Some research groups have synthesized core-shell CdS nanoparticles via different routes.Reference Lakowicz, Gryczynski, Gryczynski and Murphy9–Reference Murray, Noms and Bawendi11 Extensive research work has been undertaken on the doped nanocrystalline semiconductors like ZnS:Mn and CdS:Mn to improve their emission activity. Photoluminescence (PL) emission covering the whole visible region of Mn2+-doped CdS nanoparticles were reported.Reference Bhargava, Gallagher, Hong and Nurmikko12–Reference Dhas and Gedanken14 Tiwary et al.Reference Tiwary, Sarkar, Kumbhakar and Mitra15 recently reported visible light emission from Mn2+-doped CdS nanoparticles prepared by chemical coprecipitation. They used polyvinyl pyrolidone as a capping agent and the reaction mixture was heated at high temperature. CdS doped with transition metal ions and rare-earth ions have been studied extensively because of their excellent luminescence properties. The optical properties of doped nanomaterials differ from the corresponding host nanomaterials as the dopants form deep trap levels and act as luminescence centers.Reference Singh and Chauhan16 There have been only a few reports on Cu2+-doped ZnS and CdS nanoparticles.Reference Yang, Lu, Xu, Yuan and Zhou17–Reference Hasanzadeh and Shayesteh21 In this work, we report the effect of Cu2+doping on the PL and electron spin resonance (ESR) of CdS:Cu nanoparticles capped with thiophenol for the first time.
II. EXPERIMENTAL PROCEDURE
The samples were prepared by chemical coprecipitation using cadmium acetate and copper acetate solutions of x = 0.0, 0.05, 0.10, and 0.15 Cu2+ dissolved in methanol to make 0.1 M concentration metal ions. The stoichiometric solution was added dropwise with continuous stirring to a mixture of Na2S (0.1 M) + 50 mL of H2O +2 mL of thiophenol + 100 mL of methanol until fine precipitates of CdS:Cu2+ were formed. After complete precipitation, the suspension was stirred for about 15 h. The precipitate was filtered and washed thoroughly with deionized water and then calcined at 300 °C/2 h in vacuum. The x-ray diffraction (XRD) patterns were obtained using X’PERT PRO x-ray diffractometer (The Netherlands) with Cu Kα = 1.5406 Å. Transmission electron microscopy (TEM) was recorded (JEOL TEM 2010, Tokyo, Japan) with an accelerating voltage of 200 kV. The optical absorption measurements were made in a JASCO-V-670 spectrophotometer (Japan). The room temperature PL spectra were recorded on a PTI (Photon Technology International, USA) fluorimeter with a Xe-arc lamp of power 60 W. The ESR spectra of powder samples were recorded at room temperature using X-band JEOL JES TE 100 spectrometer in the frequency range of 8.8–9.6 GHz, with microwave power of 1.00 mW, having a 100 kHz field modulation to obtain the first derivative ESR spectrum.
III. RESULTS AND DISCUSSION
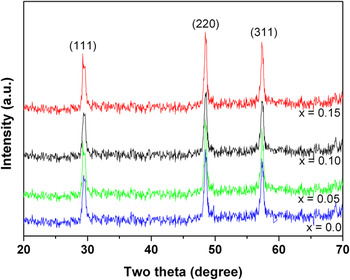
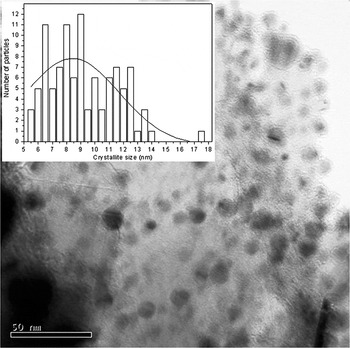
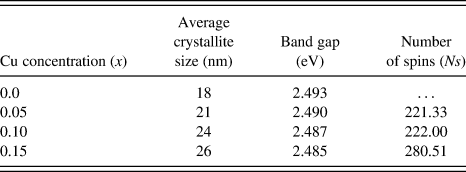
The as-prepared CdS powders were amorphous. The powders crystallized on annealing in vacuum at 300 °C/2 h. The XRD patterns of annealed (300 °C/2 h) Cd1–xCuxS samples (x = 0.0, 0.05, 0.10, 0.15) are shown in Fig. 1. The line broadening of the XRD pattern indicates the nanocrystalline nature of the samples. All lines were indexed to the cubic zinc blende structure of CdS (JCPDS Card No. 80-0020) indicating the samples are single phase. The crystallite size was calculated from the width of the XRD line broadening using the Debye-Scherrer formula (Table I). It is evident that the crystallite size increases with Cu doping. The typical TEM image of Cd1–xCuxS (x = 0.05) nanoparticles is shown in Fig. 2. The particles are nearly spherical and have an average size of 8.5 nm.
XRD spectra of cubic zinc blende Cd1–xCuxS (x = 0.0, 0.05, 0.10, and 0.15) nanoparticles.

Representative TEM micrograph of Cd1–xCuxS (x = 0.05) nanoparticles. Inset shows the size distribution plot and estimation of average crystallite size.

Crystallite size, band gap, and number of spins of Cd1–xCuxS nanoparticles.
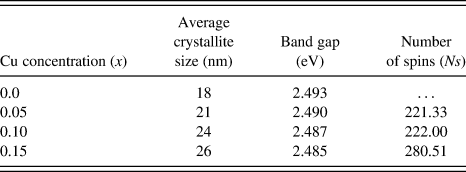
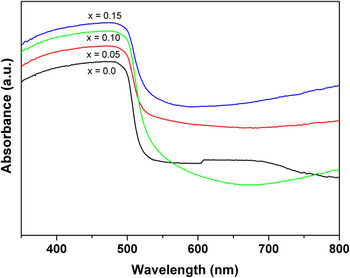
The optical absorption spectra of CdS and CdS:Cu nanoparticles are shown in Fig. 3. It is well known that bulk CdS possesses a band gap of 2.38 eV corresponding to the absorption peak at 520 nm.Reference Singh and Chauhan22 In this study, nanoparticles of CdS show the absorption peak around 497.45 nm corresponding to an energy gap of ≅2.49 eV, characterizing the nanocrystalline nature, showing a small red shift in band gap with increasing Cu content (Table I). The trend of band gap variation observed in this study is similar to that reported by Prabhu et al.,Reference Prabhu and Abdul Khadar23 in CdS nanoparticles with an average grain size of 4.2 and 2.6 nm prepared using starch as capping agents. In this work, the band gap of Cu-doped CdS nanoparticles with an average grain size of ≅20 nm is ≅2.4 eV. The absorbance decreases with wavelength beyond the absorption maximum as reported by Wei et al,.Reference Wei, Zhao and Mu24 The decrease in absorbance between 500 and 650 nm is assigned to d–d transitions of Cu2+.
Optical absorption spectra of Cd1–xCuxS (x = 0.0, 0.05, 0.10, and 0.15) nanoparticles.

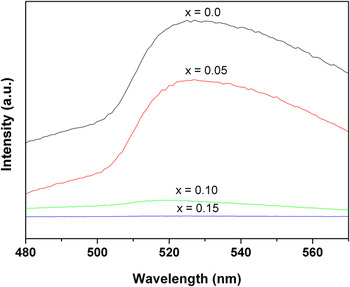
Figure 4 shows the PL emission spectrum of the Cu-doped CdS nanoparticles excited by a wavelength of 300 nm. It can be seen that the maximum of the emission is located around 520 nm (green emission) of pure CdS and copper-doped nanoparticles, which is attributed to the transition between the conduction band of the CdS host and the acceptor-like t2 (d9) state of Cu.Reference Li, Su, Ma, Ding, Xu and Chen25 The intensity decrease with increasing copper concentration results from the transition of electrons from shallow states near the conduction band to sulfur vacancies near the valence band. The small shift (higher wavelength) of the PL peak may be due to the indirect recombination of free electrons moving from trap level formed by Cu atoms to the holes in the valence band. These trap levels are in the energy gap and shift toward the valence band on doping. In other words, because the localized energy level of exciton states of Cu2+ is different from that of Cd2+, a small shift of the PL peak is observed. Recent work on Cu-doped CdS nanoparticles has also reported that the green emission band and the intensity are completely quenched with increasing copper content.Reference Unni, Philip, Smitha, Nissamudeen and Gopchandran19
PL emission spectra of Cd1–xCuxS (x = 0.0, 0.05, 0.10, and 0.15) nanoparticles.

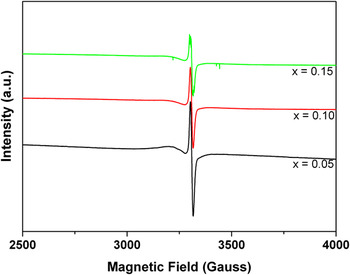
Figure 5 shows a sharp ESR signal for Cu-doped CdS nanoparticles. No resonance signal is observed for pure CdS. Generally, ESR powder spectrum of copper gives four lines corresponding to the parallel hyperfine splitting of the copper nucleus (I = 3/2), but it gives a single sharp ESR signal due to exchange interaction. The Lande factor of the samples with sharp resonance is calculated and the values are 2.24, 2.21, and 2.18 for Cd0.95Cu0.05S, Cd0.90Cu0.10S, and Cd0.85Cu0.15S, respectively. The samples with an effective g value around two show paramagnetic behaviors, which is in good agreement with results obtained from theoretical magnetic moments. The g tensor indicates an axial symmetry with elongated tetragonal octahedral due to broadening of the line width, which is due to exchange interactions. Sima et al.Reference Sima, Enculescu, Nicoleta, Secu, Matei and Vasile26 reported g ≅ 2.2 for ZnO nanowires codoped with Cu and Mn. The intensity of the ESR signal decreases with increasing Cu content, this is due to the spin exchange interaction between Cu2+ sites. The number of spins (Ns) of Cd1–xCuxS nanoparticles calculated from the ESR spectra increase with increasing Cu content (Table I), which may be due to inhomogeneity in the internal field arising due to random distribution of Cu2+ ions in the host lattice. The ESR confirms that the Cu (II) ions are doped substitutionally into CdS.
ESR spectra of Cd1–xCuxS (x = 0.05, 0.10, and 0.15) nanoparticles.

IV. CONCLUSIONS
Cu-doped CdS semiconductor nanoparticles were synthesized by chemical coprecipitation in the presence of the thiophenol capping agent. XRD confirms the particles have the zinc blende structure upon heating at 300 °C. The crystallite size increases with copper content. A red shift in band gap is observed with increasing copper content. PL spectra show a decrease in luminescence intensity with increasing copper concentration, i.e., Cu2+ ions quench the luminescence. The ESR analysis confirms the Cu ion substitution into Cd sites.
ACKNOWLEDGMENTS
This work is supported by Priority Research Centers Program through the National Research Foundation of Korea (NRF) funded by the Ministry of Education, Science and Technology (2009-0094064), and supported by Mid-career Researcher Program through NRF grant funded by the MEST (No. R01-2008-000-21056-0).