1 Introduction
The instantaneous formation of a detonation after the decay of a blast wave generated by a high energy source release is called direct initiation of detonations. Experimental studies (see, for instance, Radulescu et al.
Reference Radulescu, Higgins, Murray and Lee2003) have identified three typical regimes in a direct initiation of detonation: subcritical, critical and supercritical. The subcritical regime occurs when the source energy,
 $E_{s}$
, is relatively low. In this case, the shock speed constantly decreases, the reaction front decouples from the shock, which slowly becomes an acoustic wave, and the initiation of the detonation fails. When
 $E_{s}$
reaches a critical range (i.e. the critical regime), the blast wave first decays to a sub-Chapman–Jouget (CJ) state and the shock front then decouples from the flame front. However, at the end of a quasi-steady period, a gradually growing and accelerated compression wave generated by the chemical reactions catches up with the shock front and eventually leads to a successful self-sustained detonation. When
 $E_{s}$
is sufficiently high (i.e. the supercritical regime), a self-sustained detonation forms immediately after the blast wave decays to approximately the CJ state.
To understand the complex underlying mechanism of direct initiation of detonations, Zel’dovich, Kogarko & Simonov (Reference Zel’dovich, Kogarko and Simonov1956) proposed a theoretical model to estimate the critical energy. In their original theory, the critical energy of spherical detonations was deemed proportional to the cube of the reaction zone thickness. Their theoretical results, however, did not match experimental observations. Since that pioneering work, numerous semi-empirical models have been proposed to estimate the critical initiation energy. Some early correlations can be found in Lee’s (Reference Lee1977; Reference Lee1984) reviews. He & Clavin (Reference He and Clavin1994) developed a quasi-steady-state model to take nonlinear curvature effects into account and defined another criterion to estimate the critical energy. Eckett, Quirk & Shepherd (Reference Eckett, Quirk and Shepherd2000) reviewed some of the quasi-steady-state models. They performed one-dimensional (1D) numerical simulations and found that the unsteadiness of the decelerating leading shock wave rather than the geometric curvature is the dominant mechanism causing direct initiation of detonation to fail. Meanwhile, they proposed a critical decay rate (CDR) model that takes the unsteadiness effects into account. Nevertheless, their model cannot interpret the second critical energy identified in Mazaheri’s (Reference Mazaheri1997) and their numerical simulations of unstable detonations. Ng & Lee (Reference Ng and Lee2003) investigated direct initiation of detonation by using a multistep reaction scheme in 1D computations. They argued that ‘these theories are satisfactory only for stable detonation waves and start to break down for highly unstable detonations because they are based on simple blast wave theory and do not include a parameter to model the detonation instability’ (Ng & Lee Reference Ng and Lee2003, p. 179). They suggested that chemistry that describes the detonation dynamics should be more complex and realistic. Recently, Qi & Chen (Reference Qi and Chen2016) performed 1D simulations based on a detailed chemistry to explore the effects of temperature perturbation on the direct initiation of stable detonations. They found that a cold spot with a small temperature perturbation amplitude can promote direct initiation of a detonation. Finally, although not directly related to the initiation of detonation in open space, He & Lee (Reference He and Lee1995) reported that piston-supported detonations with small over-driven factors and high activation energy (and thus highly unstable) cannot propagate through an auto-ignition mechanism in one dimension.
This mounting evidence indicates that 1D theories and computations suffer, by nature, from severe limitations when they are used to describe detonations with inherent multidimensional structures observed in experiments (see, for instance, Radulescu et al. Reference Radulescu, Higgins, Murray and Lee2003). In real physical settings, intrinsic multidimensional instabilities can induce complex wave interactions that are not yet clearly understood. It is therefore extremely difficult, if not impossible, to build an analytical model that takes multidimensional effects into account. An alternative approach is to perform highly resolved and accurate numerical simulations to gain some insights into the physical process and to provide detailed results to improve existing models and construct new ones. However, accurate numerical simulations of direct initiation of detonation are extremely expensive and require the calculation of the solution on billions of mesh points at hundreds of thousands of time steps. The effective use of high-performance computing facilities and scalable algorithms is thus essential, allowing accurate multiparameter flow studies to be carried out that help to disentangle the effects of numerics from flow physics.
In this work, we extend a well tested characteristic conservation element solution element (CE/SE) code (Shen, Wen & Zhang Reference Shen, Wen and Zhang2015; Shen & Wen Reference Shen and Wen2016; Shen et al. Reference Shen, Wen, Parsani and Shu2017) to simulate the direct initiation of cylindrical detonations in one and two dimensions. Our main objective is to investigate the role of multidimensional instabilities in direct initiation of detonations. We used Shaheen XC-40, the supercomputer installed at King Abdullah University of Science and Technology (KAUST) for the two-dimensional (2D) computations. Shaheen XC-40 is a 36-cabinet Cray computer composing of 6174 dual socket compute nodes based on 16-core Intel Haswell processors.
2 Mathematical model
The inviscid, unsteady 1D reactive compressible Euler equations with a geometrical source term can be written as follows:
 $$\begin{eqnarray}\frac{\unicode[STIX]{x2202}\boldsymbol{U}}{\unicode[STIX]{x2202}t}+\frac{\unicode[STIX]{x2202}\boldsymbol{F}}{\unicode[STIX]{x2202}x}=-\frac{j}{x}\boldsymbol{S}+\boldsymbol{R},\end{eqnarray}$$
where the conserved variable vector,
 $\boldsymbol{U}$
, the flux vector,
 $\boldsymbol{F}$
, the geometric source term vector,
 $\boldsymbol{S}$
, and the chemical reaction source term vector,
 $\boldsymbol{R}$
, are defined as
 $\boldsymbol{U}=[\unicode[STIX]{x1D70C},\unicode[STIX]{x1D70C}u,\unicode[STIX]{x1D70C}e,\unicode[STIX]{x1D70C}Y]^{\text{T}}$
,
 $\boldsymbol{F}=[\unicode[STIX]{x1D70C}u,\unicode[STIX]{x1D70C}u^{2}+p,(\unicode[STIX]{x1D70C}e+p)u,\unicode[STIX]{x1D70C}Yu]^{\text{T}}$
,
 $\boldsymbol{S}=[\unicode[STIX]{x1D70C}u,\unicode[STIX]{x1D70C}u^{2},(\unicode[STIX]{x1D70C}e+p)u,\unicode[STIX]{x1D70C}Yu]^{\text{T}}$
and
 $\boldsymbol{R}=[0,0,0,\unicode[STIX]{x1D70C}\unicode[STIX]{x1D714}]^{\text{T}}$
. In these definitions, the symbols
 $\unicode[STIX]{x1D70C}$
,
 $u$
,
 $p$
,
 $e$
and
 $Y$
denote the density, velocity, pressure, specific total energy and reactant mass fraction, respectively. The parameter
 $j$
represents a geometric factor with
 $j=0,1,2$
for the planar, cylindrical and spherical geometries, respectively.
Similarly, the 2D reactive compressible Euler equations read
 $$\begin{eqnarray}\frac{\unicode[STIX]{x2202}\boldsymbol{U}}{\unicode[STIX]{x2202}t}+\frac{\unicode[STIX]{x2202}\boldsymbol{F}}{\unicode[STIX]{x2202}x}+\frac{\unicode[STIX]{x2202}\boldsymbol{G}}{\unicode[STIX]{x2202}y}=\boldsymbol{R},\end{eqnarray}$$
where
 $\boldsymbol{U}=[\unicode[STIX]{x1D70C},\unicode[STIX]{x1D70C}u,\unicode[STIX]{x1D70C}v,\unicode[STIX]{x1D70C}e,\unicode[STIX]{x1D70C}Y]^{\text{T}}$
,
 $\boldsymbol{F}=[\unicode[STIX]{x1D70C}u,\unicode[STIX]{x1D70C}u^{2}+p,\unicode[STIX]{x1D70C}uv,(\unicode[STIX]{x1D70C}e+p)u,\unicode[STIX]{x1D70C}Yu]^{\text{T}}$
,
 $\boldsymbol{G}=[\unicode[STIX]{x1D70C}v,\unicode[STIX]{x1D70C}uv,\unicode[STIX]{x1D70C}v^{2}+p,(\unicode[STIX]{x1D70C}e+p)v,\unicode[STIX]{x1D70C}Yv]^{\text{T}}$
, and
 $\boldsymbol{R}=[0,0,0,0,\unicode[STIX]{x1D70C}\unicode[STIX]{x1D714}]^{\text{T}}$
. The symbols
 $u$
and
 $v$
respectively denote the
 $x$
and
 $y$
components of the velocity vector
 $\boldsymbol{v}=[u,v]^{\text{T}}$
. Here, we use the perfect gas assumption. Thus, the specific total energy and equation of state are given by
 $$\begin{eqnarray}e=\frac{p}{(\unicode[STIX]{x1D6FE}-1)\unicode[STIX]{x1D70C}}+\frac{1}{2}\boldsymbol{v}\boldsymbol{\cdot }\boldsymbol{v}+YQ,\end{eqnarray}$$
and
 $$\begin{eqnarray}p=\unicode[STIX]{x1D70C}T,\end{eqnarray}$$
respectively, where
 $\unicode[STIX]{x1D6FE}$
and
 $Q$
represent the specific heat ratio and the heat released by the chemical reaction. The chemical reaction rate is calculated by the well-known Arrhenius equation:
 $$\begin{eqnarray}\unicode[STIX]{x1D714}=-kY\text{e}^{-E_{a}/T},\end{eqnarray}$$
where
 $k$
is the constant pre-exponential factor and
 $E_{a}$
is the activation energy. We note that the value of
 $k$
is chosen to derive a unit half reaction length (
 $L_{1/2}$
) using the Zel’dovich–von Neumann–Döring (ZND) model (Fickett & Davis Reference Fickett and Davis1979). The other variables are non-dimensionalized with respect to the state of the unburned reactants as follows:
 $$\begin{eqnarray}\left.\begin{array}{@{}c@{}}\displaystyle \unicode[STIX]{x1D70C}=\frac{\unicode[STIX]{x1D70C}^{\ast }}{\unicode[STIX]{x1D70C}_{0}},\quad p=\frac{p^{\ast }}{p_{0}},\quad T=\frac{T^{\ast }}{T_{0}}=\frac{\unicode[STIX]{x1D70C}_{0}RT^{\ast }}{p_{0}},\quad u=\frac{u^{\ast }}{\sqrt{RT_{0}}},\quad v=\frac{v^{\ast }}{\sqrt{RT_{0}}},\\ \displaystyle E_{a}=\frac{E_{a}^{\ast }}{RT_{0}},\quad Q=\frac{Q^{\ast }}{RT_{0}},\quad x=\frac{x^{\ast }}{L_{1/2}},\quad t=\frac{t^{\ast }}{L_{1/2}/\sqrt{RT_{0}}},\end{array}\right\}\end{eqnarray}$$
where
 $R$
is the gas constant. The superscript ‘
 $\ast$
’ and the subscript ‘0’ denote the dimensional quantities and the quantities of the unburned reactants, respectively.
A second-order characteristic space-time CE/SE method (Chang Reference Chang1995; Shen et al.
Reference Shen, Wen and Zhang2015; Shen & Wen Reference Shen and Wen2016) coupled with a local Lax–Friedrichs (LLxF) flux is used to solve (2.1) and (2.2) numerically. The chemical reaction source term,
 $\boldsymbol{R}$
, is discretized using the implicit trapezoidal method.
3 Numerical results
3.1 Code validation
In this section, we validate our code by solving the well-understood 1D piston-supported detonation case with
 $\unicode[STIX]{x1D6FE}=1.2$
,
 $E_{a}=50$
and
 $Q=50$
which has been studied by Lee & Stewart (Reference Lee and Stewart1990), He & Lee (Reference He and Lee1995) and Hwang et al. (Reference Hwang, Fedkiw, Merriman, Aslam, Karagozian and Osher2000). The length of the domain of interest,
 $\unicode[STIX]{x1D6FA}$
, is 1000
 $L_{1/2}$
. The detonation is initiated by a steady ZND solution for
 $x\leqslant 5$
and an inflow boundary condition is applied at the left boundary of
 $\unicode[STIX]{x1D6FA}$
. The stability of the propagating detonation depends on the over-driven factor,
 $f=(D/D_{CJ})^{2}$
, where
 $D$
is the velocity of the detonation wave and
 $D_{CJ}$
is the corresponding CJ value. According to Lee & Stewart (Reference Lee and Stewart1990), the detonation is stable when
 $f>1.731$
. The smaller the value of
 $f$
is, the more unstable the detonation becomes. To validate our code, we choose a mildly stable case with
 $f=1.6$
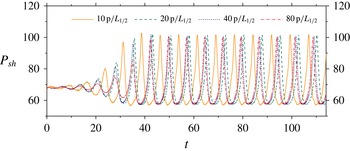
. This case is characterized by a single unstable frequency. Figure 1 shows the peak pressure,
 $P_{sh}$
, at the shock front versus time,
 $t$
. At very fine grid resolutions, the maximum peak pressure converges to approximately 99, which agrees well with the results of other numerical schemes (Hwang et al.
Reference Hwang, Fedkiw, Merriman, Aslam, Karagozian and Osher2000). According to the nonlinear stability analysis (Erpenbeck Reference Erpenbeck1967), the periods of pressure oscillations have the value of 7.41 or 7.49, depending on the perturbation method used in the analysis. All numerical schemes tested by Hwang et al. (Reference Hwang, Fedkiw, Merriman, Aslam, Karagozian and Osher2000) converge to a period in the range of 7.33–7.37 using more than 50 points per half reaction length (50 p
 $/L_{1/2}$
). In this study, the computed periods of oscillations using 10 p
 $/L_{1/2}$
, 20 p
 $/L_{1/2}$
, 40 p
 $/L_{1/2}$
and 80 p
 $/L_{1/2}$
are 7.57, 7.44, 7.38 and 7.37, respectively.
Peak pressure at the shock front (
 $P_{sh}$
) of a piston-supported detonation as a function of the time (
 $t$
) and the mesh size for an over-driven factor of
 $f=1.6$
.

3.2 Set-up for the numerical simulation of the reactive compressible Euler equations
We focus on the direct initiation of cylindrical detonations with
 $\unicode[STIX]{x1D6FE}=1.2$
and
 $Q=50$
. According to the normal mode stability analysis method of Lee & Stewart (Reference Lee and Stewart1990), 1D CJ detonations for this case are neutrally stable when
 $E_{a}\approx 25$
. Based on the threshold of instability, we study the following three cases: (i) stable case with
 $E_{a}=15$
, (ii) mildly unstable case with
 $E_{a}=27$
and (iii) highly unstable case with
 $E_{a}=50$
.
In the 1D simulations, the system of (2.1) with
 $j=1$
is solved in a domain,
 $\unicode[STIX]{x1D6FA}$
, whose size is no less than 1000
 $L_{1/2}$
. Symmetric and outflow boundary conditions are used for the left and right boundaries, respectively. In the 2D simulations, the computational domain is
 $[2000,2000]\times L_{1/2}$
and all the boundary conditions are outflow. All simulations are done using 20 p
 $/L_{1/2}$
, which implies that the number of mesh points is 1.6 billion. With our CE/SE scheme for solving the 2D compressible Euler equations, such a mesh density yields 24 billion unknowns. It is important to note that a resolution exceeding
 $10^{4}$
grid points per induction length is required to resolve the physical diffusive layers with the reactive compressible Navier–Stokes equations (Radulescu et al.
Reference Radulescu, Sharpe, Law and Lee2007). Such a high resolution is not feasible for current computational capabilities. At the current grid resolution, the numerical diffusion dominates over physical diffusion and, hence, solutions of Euler and Navier–Stokes equations are similar (Radulescu et al.
Reference Radulescu, Sharpe, Law and Lee2007; Mazaheri, Mahmoudi & Radulescu Reference Mazaheri, Mahmoudi and Radulescu2012). Therefore, in this work, we only focus on exploring the role of larger scales in highly unstable detonations using the reactive Euler equations. If a more detailed resolution of highly unstable detonations is sought, the readers are encouraged to refer to the results of Kessler, Gamezo & Oran (Reference Kessler, Gamezo and Oran2010), Mazaheri et al. (Reference Mazaheri, Mahmoudi and Radulescu2012) and Mahmoudi & Mazaheri (Reference Mahmoudi and Mazaheri2015).
Following Regele et al. (Reference Regele, Kassoy, Aslani and Vasilyev2016), we ignite the detonation using the concept of thermodynamic analysis of direct initiation and deflagration-to-detonation transition (DDT) by Kassoy (Reference Kassoy2016). A hot spot with
 $p_{s}=(\unicode[STIX]{x1D6FE}-1)E_{s}$
and
 $T_{s}=20.0$
for
 $x\leqslant 1$
in 1D and
 $\sqrt{(x-1000)^{2}+(y-1000)^{2}}\leqslant 1$
in 2D is adopted. The high-pressure gas in the hot spot acts like a piston, driving mechanical disturbances into the still reactants. The amount of energy added to the hot spot is large enough to make the thermal power deposition from a point source into the heated volume on a time scale that is smaller than the characteristic acoustic time scale. Therefore, strong blast waves can be initiated by the hot spot (Kassoy Reference Kassoy2016; Regele et al.
Reference Regele, Kassoy, Aslani and Vasilyev2016). Compared with initiation using a point blast wave with constant initial density, this alternative approach allows us to use a larger time step and, hence, to reduce drastically the wall-clock time of each simulation without affecting the flow features we are interested in. The 2D code is parallelized using a domain-decomposition approach and a standard implementation of the message passing interface. All the 2D simulations are performed using 40 000 cores.
3.3 Stable case with
 $E_{a}=15$

First, we solve the problem with
 $E_{s}$
ranging from
 $1.8\times 10^{4}$
to
 $1.0\times 10^{5}$
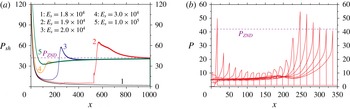
. Figure 2(a) shows the peak pressure at the shock front,
 $P_{sh}$
, versus the position,
 $x$
, using different values for
 $E_{s}$
. A supercritical regime is observed for
 $E_{s}=1.0\times 10^{5}$
. In fact,
 $P_{sh}$
first decays to a slightly sub-ZND value due to the geometric curvature and then quickly approaches the ZND value (i.e.
 $P_{ZND}$
). A critical regime is observed for
 $E_{s}=1.9\times 10^{4},2.0\times 10^{4}$
and
 $3.0\times 10^{4}$
, in which case
 $P_{sh}$
first decays to a sub-ZND value and then very quickly increases. The secondary ignition of the detonation is attributed to the formation and amplification of a pressure pulse induced by the chemical reaction behind the leading shock, as shown in figure 2(b). When
 $E_{s}$
decreases to
 $1.8\times 10^{4}$
, the detonation does not occur within the computed domain. This case refers to the subcritical regime. The failure of the detonation is mainly due to excessive unsteadiness arising from deceleration of the leading shock (Eckett et al.
Reference Eckett, Quirk and Shepherd2000). We note that the run-up distance increases exponentially when
 $E_{s}$
decreases. If the computational domain is long enough, the detonation can eventually be initiated using one-step chemistry (Mazaheri Reference Mazaheri1997).
(a) Peak pressure at the shock front (
 $P_{sh}$
) as a function of position and source energy (
 $E_{s}$
), for the stable case with
 $E_{a}=15$
. (b) Spatial pressure profiles with equal time step intervals for
 $E_{s}=2\times 10^{4}$
.
 $P_{ZND}$
is the peak pressure predicted by the ZND model.

Next, we perform 2D simulations with
 $E_{s}=2.0\times 10^{4}$
and
 $2.5\times 10^{4}$
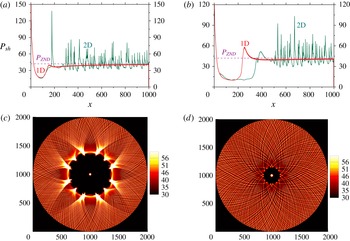
. Figure 3(a) and (b) show a comparison of
 $P_{sh}$
along the radial coordinate at
 $y=1000$
with
 $P_{sh}$
computed by the 1D simulations. The 1D and 2D solutions overlap in the early stage of the initiation. After some distance, the 2D solutions start to deviate from 1D solution. In particular, the 1D detonations remain stable throughout the whole simulation whereas the 2D detonations exhibit regular cellular structures that appear as a result of the interactions of multidimensional instabilities. These instabilities are developed from the initial perturbations induced by using a rectangular mesh to approach the circular geometry. As a consequence of the instabilities, the run-up distances are different in different directions. However, as shown in figures 3(c) and (d), when
 $E_{s}$
is large enough, the 2D run-up distances become more homogeneous and get closer to the 1D values.
(a,b) Comparison of the peak pressure at the shock front along
 $y=1000$
of the 2D simulations with the 1D simulations and (c,d) 2D contours of the peak pressure of the stable case with
 $E_{a}=15$
. (a)
 $E_{s}=2\times 10^{4}$
, (b)
 $E_{s}=2.5\times 10^{4}$
, (c)
 $E_{s}=2\times 10^{4}$
, (d)
 $E_{s}=2.5\times 10^{4}$
.

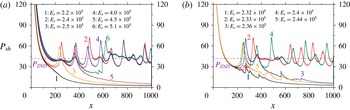
Peak pressure at the shock front (
 $P_{sh}$
) as a function of position (
 $x$
) and source energy (
 $E_{s}$
) for the mildly unstable 1D case with
 $E_{a}=27$
.

3.4 Mildly unstable case with
$E_{a}=27$

In this section, we investigate direct initiation of mildly unstable detonation when
 $E_{s}$
ranges from
 $2.2\times 10^{5}$
to
 $5.1\times 10^{5}$
in
 $1\times 10^{4}$
increments. Figure 4(a) shows
 $P_{sh}$
as a function of the position for selected values of
 $E_{s}$
in the aforementioned range. In the 1D numerical studies of Mazaheri (Reference Mazaheri1997) and Eckett et al. (Reference Eckett, Quirk and Shepherd2000), second critical energies were found in mildly unstable detonations. In our 1D simulations, detonations are successfully initiated for cases with
 $E_{s}=2.4\times 10^{5}$
,
 $3.8\times 10^{5}{-}4.1\times 10^{5}$
, and
 $5.1\times 10^{5}$
. In contrast, detonations fail in the other cases. This behaviour suggests that the current 1D model admits at least three critical energies, i.e.
 $2.4\times 10^{5}$
,
 $3.8\times 10^{5}$
and
 $5.1\times 10^{5}$
. We extend our search for other potential critical energies by increasing
 $E_{s}$
from
 $2.2\times 10^{5}$
to
 $2.5\times 10^{5}$
in
 $1\times 10^{3}$
increments. Surprisingly, a fourth critical energy at
 $2.33\times 10^{5}$
is detected, as shown by the red curve in figure 4(b).
Guided by the 1D results, we initiate 2D detonations with
 $E_{s}=2.4\times 10^{5}$
(the first 1D critical energy),
 $3.5\times 10^{5}$
(between the first and the second 1D critical energies),
 $4\times 10^{5}$
(slightly above the second 1D critical energy) and
 $4.5\times 10^{5}$
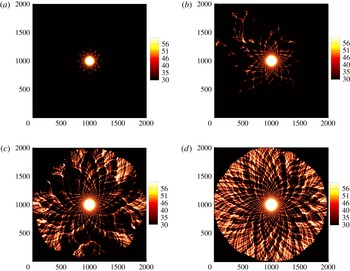
(between the second and the third 1D critical energies). Figure 5 shows the corresponding 2D contour plots of
 $P_{sh}$
. After an early decaying stage of the blast wave, irregular cellular structures appear in all simulations. The detonation fails at
 $E_{s}=2.4\times 10^{5}$
and
 $E_{s}=3.5\times 10^{5}$
. However, in the latter case, the failure is non-homogeneous. In fact, as shown in figure 5(b), the detonation fails rapidly in three of the four quadrants but takes a while before decaying in the top left portion of the domain. Our numerical experiments show that the detonation succeeds when
 $E_{s}\geqslant 4\times 10^{5}$
. This suggests that there may exist a unique critical energy (approximately
 $4\times 10^{5}$
) for this mildly unstable case in 2D.
Peak pressure at the shock front in two dimensions for the mildly unstable case with
 $E_{a}=27$
and variable source energies. (a)
 $E_{s}=2.4\times 10^{5}$
, (b)
 $E_{s}=3.5\times 10^{5}$
, (c)
 $E_{s}=4.0\times 10^{5}$
, (d)
 $E_{s}=4.5\times 10^{5}$
.

3.5 Highly unstable case with
$E_{a}=50$

Little research has been done on the direct initiation of highly unstable detonations. To investigate this problem, we increase the source energies from
 $5\times 10^{5}$
to
 $3\times 10^{7}$
in
 $5\times 10^{5}$
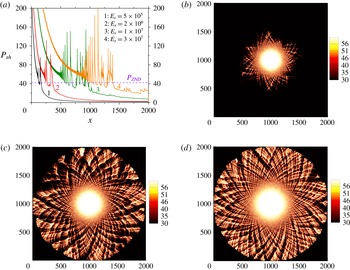
increments. Figure 6(a) shows
 $P_{sh}$
versus positions computed using the 1D model with different
 $E_{s}$
. With the 1D model, the failure of the detonation seems to be independent of the magnitude of
 $E_{s}$
. Although the propagating distance increases by increasing
 $E_{s}$
, the detonation eventually fails in all cases after a highly oscillatory phase during which instabilities play a major role. This result is consistent with the 1D results published by He & Lee (Reference He and Lee1995) about piston-supported detonations. They reported that piston-supported detonation with a small over-driven factor and high activation energy (thus highly unstable) cannot propagate through an auto-ignition mechanism in one dimension.
Peak pressure at the shock front in (a) one dimension and (b–d) two dimensions for the highly unstable case with
 $E_{a}=50$
and variable source energies. (a) 1D simulations, (b)
 $E_{s}=1\times 10^{6}$
, (c)
 $E_{s}=1.5\times 10^{6}$
, (d)
 $E_{s}=2.0\times 10^{6}$
.

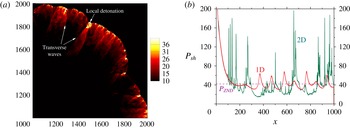
(a) 2D pressure contours when the detonation reaches the boundary; (b) comparison of the peak pressure at the shock front along
 $y=1000$
of the 2D simulations with the 1D simulations, where
 $E_{a}=27$
and
 $E_{s}=4\times 10^{5}$
.

Next, we perform 2D simulations with
 $E_{s}=1\times 10^{6}$
,
 $1.5\times 10^{6}$
and
 $2\times 10^{6}$
. Figure 6(b–d) shows the corresponding 2D contour plots of
 $P_{sh}$
. In all three cases, cellular structures with highly irregular patterns emerge after a decay of the blast wave. The detonation fails at
 $E_{s}=1\times 10^{6}$
(figure 6
b) and succeeds in the other two cases (figure 6
c,d). The numerically observed critical energy is approximately
 $1.5\times 10^{6}$
in this highly unstable 2D case.
4 Discussion and conclusion
By comparing the 1D and 2D numerical results for stable, mildly unstable and highly unstable cases, we conclude that multidimensional instabilities strongly influence direct initiation of detonations. Under the 1D assumption, the direct initiation of detonation is dominated by a competition between heat release and unsteadiness. The primary physical mechanism for the failure of the initiation of 1D detonation is excessive unsteadiness arising from the deceleration of the leading shock (Eckett et al. Reference Eckett, Quirk and Shepherd2000). In 2D, heat release and unsteadiness are still undoubtedly two competing factors in the failure or success of the initiation of detonations, but they are accompanied by a third key element, the inherent multidimensional instabilities.
In stable detonations, the initiation regimes in 1D and 2D are similar. After the success of initiation, the heat release overwhelms the unsteadiness. This observation is supported by the fact that 1D detonations are quasi-steady and 2D detonations never fail even though
 $P_{sh}$
is highly oscillatory (see figure 3
a,b).
In unstable detonations, the relationships between heat release, unsteadiness and multidimensional instability are very complex. The critical energy in 1D is not unique in mildly unstable detonations, and probably does not exist in the highly unstable ones. Figures 4 and 6(a) show that the failure of the 1D mildly and highly unstable detonations is quite similar, except for the cases with very low values of
 $E_{s}$
. At the early stage, the detonations are successfully ignited but they eventually decay to acoustic waves after some periods of oscillation. One-dimensional pressure oscillations are governed by a competition between rapid expansion waves at the rear of the reaction zone and the heat released due to chemical reactions (Mazaheri Reference Mazaheri1997). The failure of the detonation is mainly caused by excessive unsteadiness due to this expansion. In highly unstable cases, the unsteadiness dominates the initiation process so that the 1D detonation cannot propagate through the auto-ignition mechanism. In 2D cases, the inevitable multidimensional instabilities are double-edged swords. First, the interaction of these instabilities can generate transverse waves. As observed in figure 7(a), the collision of transverse waves can generate hot spots which can induce local over-driven detonations by the Zel’dovich gradient mechanism (Zel’dovich et al.
Reference Zel’dovich, Librovich, Makhviladze and Sivashinskil1970; Oran & Gamezo Reference Oran and Gamezo2007), thereby assisting the propagation of the overall detonation. Second, as shown by figure 7(b), these local over-driven detonations can induce stronger expansion waves than 1D detonations. This feature increases the risk of failure of the detonation. The competition between these two effects therefore provides an additional initiation mechanism in 2D detonations. When
 $E_{s}$
is small, the unsteadiness induced by strong expansion waves is more important. This explains why the initiation of the detonation succeeds in 1D but fails in 2D in the mildly unstable case with
 $E_{a}=27$
and
 $E_{s}=2.4\times 10^{5}$
(the first observed 1D critical energy). In contrast, the first effect is dominant with large
 $E_{s}$
. Consequently, unstable detonations can be directly initiated in two dimensions when
 $E_{s}$
exceeds the critical energy.
In conclusion, the 1D assumption only provides a valid approach to understanding the direct initiation of stable detonations, and multidimensional effects must be included in a predictive model of direct initiation of unstable detonations.
Acknowledgements
Research reported in this paper was funded by King Abdullah University of Science and Technology. We are grateful for the computing resources of the Supercomputing Laboratory and the Extreme Computing Research Center at King Abdullah University of Science and Technology.