


1 Introduction
The efficiency of solute transport inside microchannels is an important issue in microfluidics (Datta & Ghosal Reference Datta and Ghosal2009) because of its vast applications in different areas such as microfluidic mixing (Wu & Nguyen Reference Wu and Nguyen2005; Matsunaga, Lee & Nishino Reference Matsunaga, Lee and Nishino2013; Sadeghi Reference Sadeghi2016), capillary electrophoresis (Wu, Qin & Lin Reference Wu, Qin and Lin2008), capillary electrochromatography and capillary liquid chromatography (Feltkamp Reference Feltkamp1966), DNA amplification (Tripathi, Bozkurt & Chauhan Reference Tripathi, Bozkurt and Chauhan2005) and molecular separation (Garcia et al. Reference Garcia, Ista, Petsev, O’Brien, Bisong, Mammoli, Brueck and López2005). Solute transport occurs via advection, diffusion and hydrodynamic dispersion mechanisms. The first mechanism takes place when solutes move with the fluid flow and it is responsible for the transport of the centre of mass of an injected solute band. The diffusive dispersion is due to random thermal motion of solute molecules and a non-uniform velocity profile is the reason for hydrodynamic dispersion. Because of hydrodynamic dispersion, a solute band is stretched in the flow direction under a combined action of advection and diffusion (Masliyah & Bhattacharjee Reference Masliyah and Bhattacharjee2006). Depending on the flow profile, hydrodynamic dispersion may be more influential than molecular diffusion. For some applications, such as mixing, it is desirable to increase the degree of dispersion to shorten the mixing time. However, in applications like separation, it is preferable to decrease hydrodynamic dispersion to achieve a better resolution. Therefore, investigating the parameters controlling the hydrodynamic dispersion, such as the transport coefficients, is an important matter in the design of microfluidic devices involving solute transport.
The first study on hydrodynamic dispersion was conducted by Taylor (Reference Taylor1953) who introduced an effective dispersion coefficient for a steady laminar flow in a straight circular tube, which was then generalized by Aris (Reference Aris1956) by incorporating the effect of axial molecular diffusion utilizing the method of moments. After these pioneering studies, more research works were conducted to consider the effect of various parameters on the solute dispersion coefficient. Analysing band broadening from initial times after injection, Gill & Sankarasubramanian (Reference Gill and Sankarasubramanian1970) proposed a general model expressing the transport coefficients as a function of time in a steady-state flow. More progress was made by considering time variable flow (Gill & Sankarasubramanian Reference Gill and Sankarasubramanian1972; Sankarasubramanian & Gill Reference Sankarasubramanian and Gill1972; Vedel & Bruus Reference Vedel and Bruus2011), oscillating flow (Ng Reference Ng2006), non-uniformity of the injected solute band (Gill & Sankarasubramanian Reference Gill and Sankarasubramanian1971, Reference Gill and Sankarasubramanian1972) and interfacial as well boundary mass transfer (Sankarasubramanian & Gill Reference Sankarasubramanian and Gill1973; Phillips & Kaye Reference Phillips and Kaye1998; Ng Reference Ng2006).
One important issue in microfluidics is robust flow generation as the high working pressures required may lead to the failure of conventional pumping devices. To meet the pumping requirements at the microscale, various pumping mechanisms have been proposed among which electrokinetic phenomena such as electroosmosis have found widespread applications (Sadeghi, Sadeghi & Saidi Reference Sadeghi, Sadeghi and Saidi2016). Electroosmosis refers to flow mobilization of an electrolyte solution relative to a charged surface by utilizing an external electric filed. The movement of fluid in electroosmotic flow (EOF) is due to a redistribution of free ions in the solution because of surface charges, causing the formation of an electric double layer (EDL) adjacent to the surface (Masliyah & Bhattacharjee Reference Masliyah and Bhattacharjee2006; Keramati et al. Reference Keramati, Sadeghi, Saidi and Chakraborty2016; Sadeghi et al. Reference Sadeghi, Saidi, Moosavi and Sadeghi2017). The non-uniformities of the velocity profile are restricted to this layer and, hence, EOF usually has a flatter velocity profile as compared to the Poiseuille flow. Accordingly, it can provide a better resolution in processes in which minimum dispersion is favoured (Ng & Zhou Reference Ng and Zhou2012). Besides low solute dispersion, EOF possesses other advantages, such as requiring no moving components, which is crucial for the manufacturing of EOF-based instruments at the microscale. Thanks to its advantages, EOF is now a widely used actuation method for flow generation in lab-on-a-chip devices (Vennela et al. Reference Vennela, Mondal, De and Bhattacharjee2012).
There are several research studies in the literature investigating the dispersion of electrokinetically actuated flow in microchannels, most of which are related to parallel-plate and circular geometries (Datta & Kotamarthi Reference Datta and Kotamarthi1990; Andreev & Lisin Reference Andreev and Lisin1993; Griffiths & Nilson Reference Griffiths and Nilson1999, Reference Griffiths and Nilson2000; Ng & Zhou Reference Ng and Zhou2012). Despite the importance of the rectangular geometry, much less attention has been given to hydrodynamic dispersion in rectangular microchannels (Dutta Reference Dutta2007; Paul & Ng Reference Paul and Ng2012). A very important aspect of solute dispersion in rectangular microchannels, that raises the need for separate analyses for this geometry, is that the dispersion coefficient for a rectangular microchannel of high aspect ratio does not reduce to the value for a parallel-plate microchannel (Paul & Ng Reference Paul and Ng2012).
The maximum achievable electroosmotic velocity for a given working fluid is dependent upon both the applied electric field and surface zeta potential. As utilizing large electric fields is accompanied by a high amount of Joule heating, which has several unfavourable effects such as increasing band broadening, the only healthy way for increasing the electroosmotic flow rate is to use surfaces having large zeta potentials. However, in many situations, the design objectives are not met by natural properties of the channel surface. In these cases, the surface may be altered to achieve the desired characteristics. One of the main approaches of surface treatment is to coat it with a polyelectrolyte layer (PEL), which may be formed by grafting polymer brushes having electrically charged groups, termed polyelectrolyte brushes, to the surface (Yeh et al. Reference Yeh, Zhang, Hu, Joo, Qian and Hsu2012). The presence of brushes alters the fluid flow by affecting it in a twofold manner. First, the brushes directly exert a resistive force on the fluid particles. Second, the fixed charged groups of the brushes indirectly amplify fluid flow via accumulating free electrolyte ions of opposite charge within the PEL. By appropriately adjusting the above-mentioned two effects, any desired flow conditions may be obtained. It has been shown that by grafting polyelectrolyte brushes to the inner surface of a microchannel, it is possible to increase the flow rate by more than one order of magnitude (Paumier et al. Reference Paumier, Sudor, Gue, Vinet, Li, Chabal, Estève and Djafari-Rouhani2008). On the other hand, in some applications, such as capillary electrophoresis, polymer coating is used to enhance the efficiency of separation by suppressing the generated electroosmotic flow (Chiari et al. Reference Chiari, Cretich, Damin, Ceriotti and Consonni2000; Hickey, Harden & Slater Reference Hickey, Harden and Slater2009). Because of the unique features of polyelectrolyte coating, it is used in different applications such as colloidal stabilization (Dautzenberg Reference Dautzenberg1985), enhancement of biomaterial capability (Ratner et al. Reference Ratner, Hoffman, Schoen and Lemons2004) and control of membrane permeability among others.
Despite the importance of PEL-grafted microchannels, little attention has been paid to the dispersion properties of electrokinetic flow in this type of microchannel. The only available research study, which is the work due to Hoshyargar et al. (Reference Hoshyargar, Khorami, Ashrafizadeh and Sadeghi2018), is based on the original study of Taylor and, hence, only the long-term dispersion coefficient is given. More importantly, in spite of the fact that most microfabrication techniques produce channels of rectangular cross-sectional area (Stone, Stroock & Ajdari Reference Stone, Stroock and Ajdari2004; Sadeghi, Saidi & Sadeghi Reference Sadeghi, Saidi and Sadeghi2017), this study deals with a parallel-plate geometry. Considering the importance of lateral walls on the dispersion properties, the findings of this study may not be appropriate to rectangular microchannels of even large aspect ratio. Last but not least, even though the presence of polyelectrolyte brushes provides appropriate circumstances for the adsorption of solutes at the channel walls, Hoshyargar et al. (Reference Hoshyargar, Khorami, Ashrafizadeh and Sadeghi2018) considered no-flux boundary conditions. All of these gaps are bridged in the present study by considering hydrodynamic dispersion by steady fully developed electroosmotic flow in a PEL-grafted slit/rectangular microchannel utilizing the generalized dispersion model proposed by Gill & Sankarasubramanian (Reference Gill and Sankarasubramanian1970). This model enables us to track an injected solute band from the time of injection by taking advantage of three time-dependent transport factors including the exchange, the convection and the dispersion coefficients. A first-order reaction is considered at the channel walls to account for probable surface adsorption of solute molecules. The solutions obtained are able to take any initial distribution of the solute band into account. Although the validity of the analytical solutions presented are restricted to low electric potentials, full numerical simulations are also performed to go beyond the Debye–Hückel limit. By comparing the analytical and numerical results, it is shown that the model developed is able to capture the dispersion properties of the problem under consideration.
2 Problem formulation
2.1 Problem definition
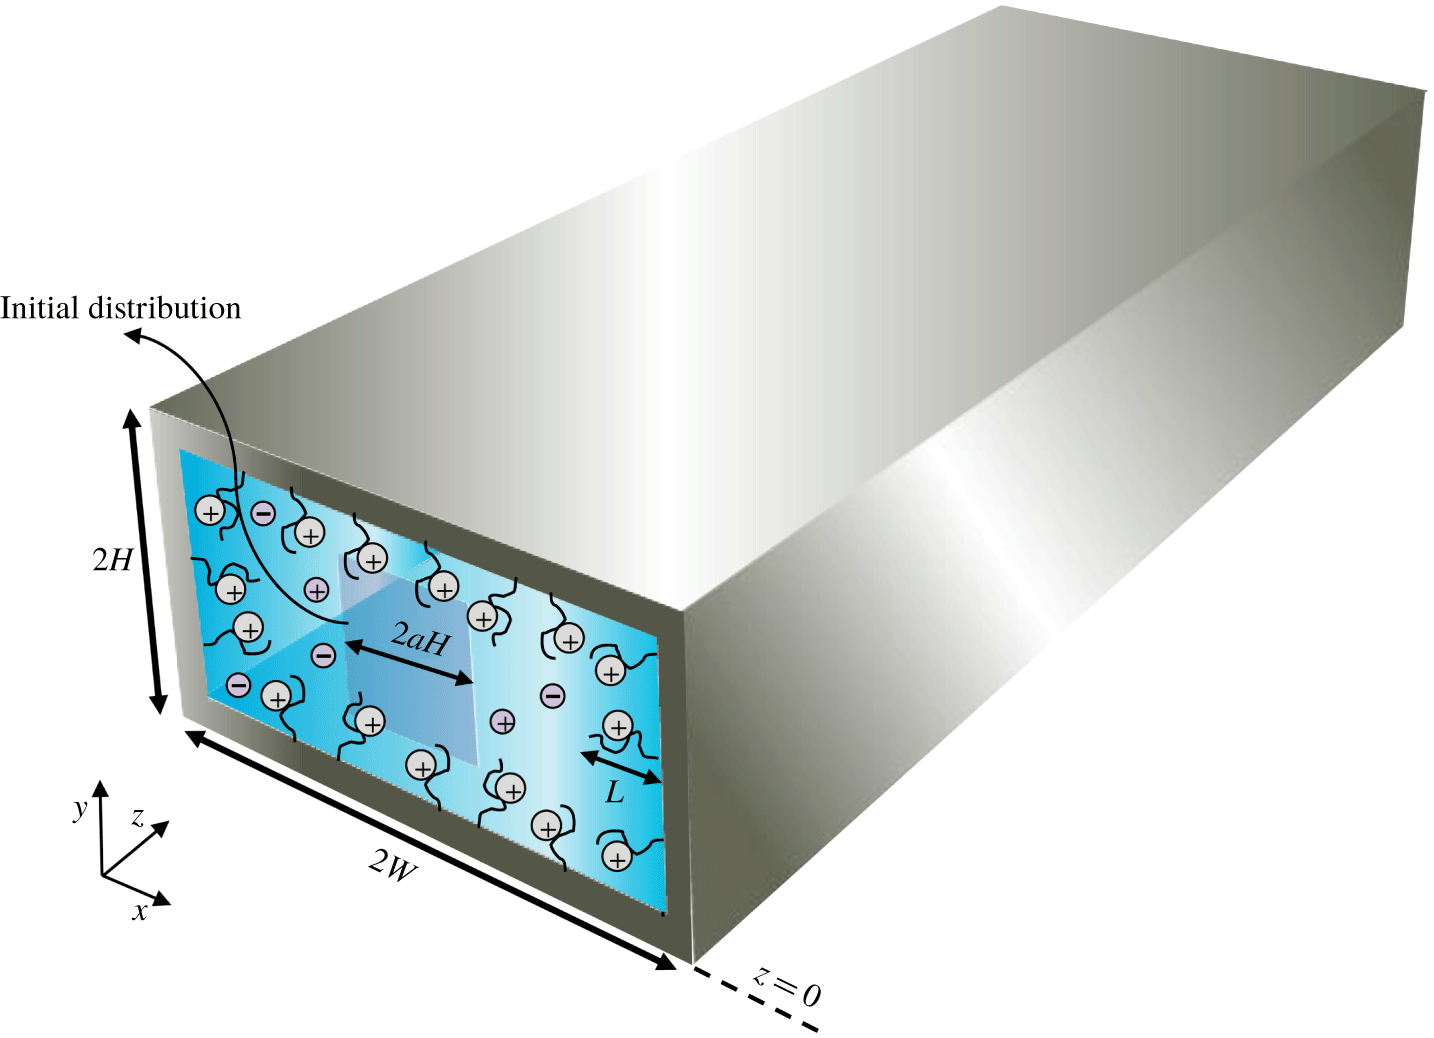
Consideration is given to the unsteady dispersion of a solute band by electroosmotic flow of a Newtonian liquid with constant physical properties in a straight rectangular microchannel with PEL-grafted walls. The channel dimensions, the coordinate system, located at the centre of the  $X$–
 $Y$ plane at the channel entrance and other details are given in figure 1. It is assumed that the flow is both steady and fully developed. The probable adsorption/reaction of the solutes at the channel walls is accounted for via applying an irreversible first-order boundary reaction formula. The PEL is considered to have a constant and uniform charge density and a uniform thickness all around the channel with a sufficiently low grafting density to allow the use of the same values of permittivity and viscosity inside and outside the PEL. Since a low grafting density is considered, the volumetric density of the PEL fixed charges may be assumed to be low enough to permit application of the Debye–Hückel linearization when treating the problem analytically. It is further assumed that the Debye length is larger than the hydraulic diameter of the channel so that the concentration polarization effect arising due to the selective transport of ionic species can be ignored. Finally, the liquid is considered to contain an electrolyte of a completely dissociated symmetric salt. Owing to the symmetry, the analysis is limited to the first quarter of the channel.
Schematic representation of the rectangular microchannel under consideration. The internal surface of the microchannel is coated with a polyelectrolyte layer of thickness  $L$. The square of side length
 $2aH$ shows the shape of the initial solute distribution that is considered in the presentation of results.
2.2 Electric potential field
The overall electric potential field  $\unicode[STIX]{x1D6F7}(X,Y,Z)$ within the microchannel is the superposition of the externally applied electric potential
 $\unicode[STIX]{x1D711}(Z)$ and the EDL electric potential
 $\unicode[STIX]{x1D6F9}(X,Y)$, that is
 $$\begin{eqnarray}\unicode[STIX]{x1D6F7}(X,Y,Z)=\unicode[STIX]{x1D6F9}(X,Y)+\unicode[STIX]{x1D711}(Z).\end{eqnarray}$$
The electric potential is governed by the Poisson equation, written as
 $$\begin{eqnarray}\unicode[STIX]{x1D6FB}^{2}\unicode[STIX]{x1D6F7}=-\frac{\unicode[STIX]{x1D70C}_{e}}{\unicode[STIX]{x1D700}},\end{eqnarray}$$
where  $\unicode[STIX]{x1D700}$ represents the permittivity and
 $\unicode[STIX]{x1D70C}_{e}$ stands for the net electric charge density. As noted before, the same permittivities are assumed within and outside of the PEL. However, attention should be given to the fact that, since the permittivity of polyelectrolyte brushes is lower than that of water, the PEL permittivity is generally lower than solution permittivity. In fact, the range 52.8–78 is reported for the relative permittivity of the PEL (Sadeghi, Azari & Hardt Reference Sadeghi, Azari and Hardt2019). Whereas the lower limit differs significantly from water permittivity, the upper limit is quite close to it. This corresponds to the cases for which the grafting density is low, similar to the circumstances considered in the present study.
There are two types of electric charge in the microchannel, namely solution ions, which move freely throughout the whole domain under consideration, and PEL charges that are fixed within this layer. The net electric charges of solution and PEL ions are respectively given as
 $$\begin{eqnarray}\displaystyle \unicode[STIX]{x1D70C}_{E} & = & \displaystyle ez_{E}(C_{+}-C_{-})=ez_{E}C^{\infty }\left[\exp \left(-\frac{ez_{E}\unicode[STIX]{x1D6F9}}{k_{B}T}\right)-\exp \left(\frac{ez_{E}\unicode[STIX]{x1D6F9}}{k_{B}T}\right)\right]\nonumber\\ \displaystyle & = & \displaystyle -2ez_{E}C^{\infty }\sinh \left(\frac{ez_{E}\unicode[STIX]{x1D6F9}}{k_{B}T}\right),\end{eqnarray}$$
 $$\begin{eqnarray}\unicode[STIX]{x1D70C}_{PEL}=e\mathbb{N}_{PEL}z_{PEL},\end{eqnarray}$$
where  $e$ is the proton charge,
 $K_{B}$ shows the Boltzmann constant,
 $T$ indicates the absolute temperature,
 $z_{E}$ denote the valence of electrolyte ions and
 $\mathbb{N}_{PEL}$ and
 $z_{PEL}$ are the number density and valence of the PEL fixed charges, respectively. In addition,
 $C_{+}$ and
 $C_{-}$ stand for the number concentrations of cations and anions, respectively, which both equal
 $C^{\infty }$ at neutral conditions. Note that a Boltzmann distribution is assumed for the solution ions since the fluid velocity does not influence the ionic distribution in the normal direction to a rectilinear flow. Substituting (2.3) and (2.4) into (2.2) and recalling that
 $\unicode[STIX]{x1D6FB}^{2}\unicode[STIX]{x1D711}=0$ for a constant applied electric field, one obtains
 $$\begin{eqnarray}\frac{\unicode[STIX]{x2202}^{2}\unicode[STIX]{x1D6F9}}{\unicode[STIX]{x2202}X^{2}}+\frac{\unicode[STIX]{x2202}^{2}\unicode[STIX]{x1D6F9}}{\unicode[STIX]{x2202}Y^{2}}-\frac{2ez_{E}C^{\infty }}{\unicode[STIX]{x1D700}}\sinh \left(\frac{ez_{E}\unicode[STIX]{x1D6F9}}{k_{B}T}\right)+\frac{e\mathbb{N}z_{PEL}}{\unicode[STIX]{x1D700}}=0.\end{eqnarray}$$
The parameter  $\mathbb{N}$ appearing in (2.5), which is equal to
 $\mathbb{N}_{PEL}$ and 0 inside and outside of the grafted layer, respectively, reminds us of the fact that the existence of the fixed charges is limited to the PEL. It should be pointed out that the spatial distribution of the PEL fixed charges is generally non-uniform, with a decreasing dependence on the normal distance from the hard wall; however, depending on the properties of the electrolyte and brushes, situations may be found in which a uniform charge distribution, considered in this study, is reasonable (Sadeghi et al. Reference Sadeghi, Azari and Hardt2019). For low grafting densities, the electric potential is so low that the term
 $\sinh (ez_{E}\unicode[STIX]{x1D6F9}/k_{B}T)$ can be approximated by
 $ez_{E}\unicode[STIX]{x1D6F9}/k_{B}T$. This approximation, known as Debye–Hückel linearization, modifies equation (2.5) as
 $$\begin{eqnarray}\frac{\unicode[STIX]{x2202}^{2}\unicode[STIX]{x1D6F9}}{\unicode[STIX]{x2202}X^{2}}+\frac{\unicode[STIX]{x2202}^{2}\unicode[STIX]{x1D6F9}}{\unicode[STIX]{x2202}Y^{2}}-2\left(\frac{e^{2}z_{E}^{2}C^{\infty }}{k_{B}T\unicode[STIX]{x1D700}}\unicode[STIX]{x1D6F9}\right)+\frac{e\mathbb{N}z_{PEL}}{\unicode[STIX]{x1D700}}=0.\end{eqnarray}$$
By introducing the dimensionless parameters as below,
 $$\begin{eqnarray}x=\frac{X}{H},\quad y=\frac{Y}{H},\quad \unicode[STIX]{x1D713}=\frac{ez_{E}\unicode[STIX]{x1D6F9}}{k_{B}T},\quad \mathbb{N}^{\ast }=\frac{\mathbb{N}}{\mathbb{N}_{PEL}},\quad K=H/\unicode[STIX]{x1D706}_{E},\quad \unicode[STIX]{x1D702}_{\unicode[STIX]{x1D706}}=\unicode[STIX]{x1D706}_{PEL}/\unicode[STIX]{x1D706}_{E},\end{eqnarray}$$
with  $\unicode[STIX]{x1D706}_{E}=(k_{B}T\unicode[STIX]{x1D700}/2C^{\infty }e^{2}z_{E}^{2})^{1/2}$ and
 $\unicode[STIX]{x1D706}_{PEL}=(k_{B}T\unicode[STIX]{x1D700}/z_{E}z_{PEL}\mathbb{N}_{PEL}e^{2})^{1/2}$ being the characteristic and PEL Debye lengths, respectively, equation (2.6) is scaled as
 $$\begin{eqnarray}\frac{\unicode[STIX]{x2202}^{2}\unicode[STIX]{x1D713}}{\unicode[STIX]{x2202}x^{2}}+\frac{\unicode[STIX]{x2202}^{2}\unicode[STIX]{x1D713}}{\unicode[STIX]{x2202}y^{2}}-K^{2}\unicode[STIX]{x1D713}+K^{2}\unicode[STIX]{x1D702}_{\unicode[STIX]{x1D706}}^{-2}\mathbb{N}^{\ast }=0.\end{eqnarray}$$
The boundary conditions associated with (2.8) include
 $$\begin{eqnarray}\left.\frac{\unicode[STIX]{x2202}\unicode[STIX]{x1D713}}{\unicode[STIX]{x2202}x}\right|_{x=0}=\left.\frac{\unicode[STIX]{x2202}\unicode[STIX]{x1D713}}{\unicode[STIX]{x2202}x}\right|_{x=w}=\left.\frac{\unicode[STIX]{x2202}\unicode[STIX]{x1D713}}{\unicode[STIX]{x2202}y}\right|_{y=0}=\left.\frac{\unicode[STIX]{x2202}\unicode[STIX]{x1D713}}{\unicode[STIX]{x2202}y}\right|_{y=1}=0,\end{eqnarray}$$
where  $w=W/H$. The boundary conditions (2.9) reflect symmetry at the centrelines and the neutrality of the rigid walls of the microchannel. Since the electrical potential and its gradient are continuous at the electrolyte–PEL interface, we consider for both domains a single solution of the form
 $$\begin{eqnarray}\unicode[STIX]{x1D713}=\mathop{\sum }_{j=1}^{\infty }b_{j}\cos (\unicode[STIX]{x1D709}_{l_{j}}y)\cos (\unicode[STIX]{x1D709}_{m_{j}}x/w),\end{eqnarray}$$
where  $\unicode[STIX]{x1D709}_{l_{j}}=l_{j}\unicode[STIX]{x03C0}$ and
 $\unicode[STIX]{x1D709}_{m_{j}}=m_{j}\unicode[STIX]{x03C0}$ with
 $l_{j}=0,1,2,\ldots$ and
 $m_{j}=0,1,2,\ldots$ . The form (2.10) satisfies the pertinent boundary conditions. Substituting this functional form into (2.8) results in
 $$\begin{eqnarray}\mathop{\sum }_{j=1}^{\infty }b_{j}(\unicode[STIX]{x1D709}_{l_{j}}^{2}+\unicode[STIX]{x1D709}_{m_{j}}^{2}/w^{2}+K^{2})\cos (\unicode[STIX]{x1D709}_{l_{j}}y)\cos (\unicode[STIX]{x1D709}_{m_{j}}x/w)=K^{2}\unicode[STIX]{x1D702}_{\unicode[STIX]{x1D706}}^{-2}\mathbb{N}^{\ast }.\end{eqnarray}$$
Multiplying both sides of (2.11) by  $\cos (\unicode[STIX]{x1D709}_{l_{i}}y)\cos (\unicode[STIX]{x1D709}_{m_{i}}x/w)$, integrating over the dimensionless cross-sectional area and making use of the orthogonality conditions, we obtain
 $$\begin{eqnarray}\displaystyle & & \displaystyle b_{i}(\unicode[STIX]{x1D709}_{l_{i}}^{2}+\unicode[STIX]{x1D709}_{m_{i}}^{2}/w^{2}+K^{2})\int _{0}^{w}\int _{0}^{1}\cos ^{2}(\unicode[STIX]{x1D709}_{l_{i}}y)\cos ^{2}(\unicode[STIX]{x1D709}_{m_{i}}x/w)\,\text{d}y\,\text{d}x\nonumber\\ \displaystyle & & \displaystyle \quad =K^{2}\unicode[STIX]{x1D702}_{\unicode[STIX]{x1D706}}^{-2}\int _{0}^{w}\int _{0}^{1}\mathbb{N}^{\ast }\cos (\unicode[STIX]{x1D709}_{l_{i}}y)\cos (\unicode[STIX]{x1D709}_{m_{i}}x/w)\,\text{d}y\,\text{d}x.\end{eqnarray}$$
Performing the integrations,  $b_{i}$ is obtained as
 $b_{i}=c_{i}/a_{i}$ where
 $$\begin{eqnarray}\displaystyle c_{i} & = & \displaystyle K^{2}\unicode[STIX]{x1D702}_{\unicode[STIX]{x1D706}}^{-2}w\left.\unicode[STIX]{x27E6}\unicode[STIX]{x1D6FF}_{0,l_{i}+m_{i}}-\left\{\unicode[STIX]{x1D6FF}_{0,l_{i}}(1-l)+(1-\unicode[STIX]{x1D6FF}_{0,l_{i}})\frac{\sin [\unicode[STIX]{x1D709}_{l_{i}}(1-l)]}{\unicode[STIX]{x1D709}_{l_{i}}}\right\}\left\{\unicode[STIX]{x1D6FF}_{0,m_{i}}(1-l/w)\right.\right.\nonumber\\ \displaystyle & & \displaystyle +\left.\left.(1-\unicode[STIX]{x1D6FF}_{0,m_{i}})\frac{\sin [\unicode[STIX]{x1D709}_{m_{i}}(1-l/w)]}{\unicode[STIX]{x1D709}_{m_{i}}}\right\}\right.\unicode[STIX]{x27E7},\end{eqnarray}$$
 $$\begin{eqnarray}a_{i}=\frac{1}{4w}[w^{2}\unicode[STIX]{x1D709}_{l_{i}}^{2}(1+\unicode[STIX]{x1D6FF}_{0,m_{i}})+\unicode[STIX]{x1D709}_{m_{i}}^{2}(1+\unicode[STIX]{x1D6FF}_{0,l_{i}})+K^{2}w^{2}(1+\unicode[STIX]{x1D6FF}_{0,m_{i}})(1+\unicode[STIX]{x1D6FF}_{0,l_{i}})],\end{eqnarray}$$
 $\unicode[STIX]{x1D6FF}$ denotes the Kronecker delta and
 $l=L/H$ is the dimensionless thickness of the grafted layer.
2.2.1 Special solution for  $w\rightarrow \infty$

When the channel aspect ratio is very large, that is for  $1\ll w$, the dependence of the physical parameters on the
 $x$-coordinate vanishes. The solutions obtained under these circumstances are computationally less expensive and are more appropriate to experimentalists. The electric potential distribution for this case is found by solving the following ordinary differential equations for outside and inside the PEL, respectively,
 $$\begin{eqnarray}\displaystyle & \displaystyle \frac{\text{d}^{2}\unicode[STIX]{x1D713}_{E}}{\text{d}y^{2}}-K^{2}\unicode[STIX]{x1D713}_{E}=0, & \displaystyle\end{eqnarray}$$
 $$\begin{eqnarray}\displaystyle & \displaystyle \frac{\text{d}^{2}\unicode[STIX]{x1D713}_{PEL}}{\text{d}y^{2}}-K^{2}\unicode[STIX]{x1D713}_{PEL}+K^{2}\unicode[STIX]{x1D702}_{\unicode[STIX]{x1D706}}^{-2}=0, & \displaystyle\end{eqnarray}$$
which are subject to the following boundary and interfacial conditions:
 $$\begin{eqnarray}\displaystyle & \displaystyle \left.\frac{\text{d}\unicode[STIX]{x1D713}_{E}}{\text{d}y}\right|_{y=0}=\left.\frac{\text{d}\unicode[STIX]{x1D713}_{PEL}}{\text{d}y}\right|_{y=1}=0, & \displaystyle\end{eqnarray}$$
 $$\begin{eqnarray}\displaystyle & \displaystyle \left.\unicode[STIX]{x1D713}_{E}\right|_{y=1-l}=\left.\unicode[STIX]{x1D713}_{PEL}\right|_{y=1-l}, & \displaystyle\end{eqnarray}$$
 $$\begin{eqnarray}\displaystyle & \displaystyle \left.\frac{\text{d}\unicode[STIX]{x1D713}_{E}}{\text{d}y}\right|_{y=1-l}=\left.\frac{\text{d}\unicode[STIX]{x1D713}_{PEL}}{\text{d}y}\right|_{y=1-l}. & \displaystyle\end{eqnarray}$$
It can be shown that the solutions of (2.14) and (2.15) subject to the pertinent boundary conditions are given as
 $$\begin{eqnarray}\displaystyle & \displaystyle \unicode[STIX]{x1D713}_{E}=b_{E1}\cosh (Ky), & \displaystyle\end{eqnarray}$$
 $$\begin{eqnarray}\displaystyle & \displaystyle \unicode[STIX]{x1D713}_{PEL}=b_{PEL1}[\cosh (Ky)-\tanh K\sinh (Ky)]+\unicode[STIX]{x1D702}_{\unicode[STIX]{x1D706}}^{-2}\unicode[STIX]{x1D6FE}^{-1}, & \displaystyle\end{eqnarray}$$
where
 $$\begin{eqnarray}\displaystyle b_{E1} & = & \displaystyle \unicode[STIX]{x1D702}_{\unicode[STIX]{x1D706}}^{-2}\{\sinh [K(1-l)]\}^{-1}\{\!\tanh [K(1-l)]\nonumber\\ \displaystyle & & \displaystyle -\,\tanh K\!\}\unicode[STIX]{x27E6}\{\tanh [K(1-l)]\}^{-1}\{\tanh [K(1-l)]-\tanh K\}-1\nonumber\\ \displaystyle & & \displaystyle +\,\tanh K\tanh [K(1-l)]\unicode[STIX]{x27E7}^{-1},\end{eqnarray}$$
 $$\begin{eqnarray}\displaystyle b_{PEL1} & = & \displaystyle \unicode[STIX]{x1D702}_{\unicode[STIX]{x1D706}}^{-2}\{\cosh [K(1-l)]\}^{-1}\unicode[STIX]{x27E6}\{\tanh [K(1-l)]\}^{-1}\{\tanh [K(1-l)]-\tanh K\}-1\nonumber\\ \displaystyle & & \displaystyle +\,\tanh K\tanh [K(1-l)]\unicode[STIX]{x27E7}^{-1}.\end{eqnarray}$$
2.3 Velocity distribution
For evaluation of the velocity field, the mathematical representation of the momentum conservation law must be solved. For an incompressible flow of Newtonian fluids with constant physical properties, the general form of the momentum equation reads
 $$\begin{eqnarray}\unicode[STIX]{x1D70C}\frac{\text{D}\boldsymbol{U}}{\text{D}t}=-\unicode[STIX]{x1D735}P+\unicode[STIX]{x1D707}\unicode[STIX]{x1D6FB}^{2}\boldsymbol{U}+\boldsymbol{F},\end{eqnarray}$$
where parameters  $\unicode[STIX]{x1D70C}$,
 $t$,
 $\boldsymbol{U}$,
 $P$,
 $\unicode[STIX]{x1D707}$ and
 $\boldsymbol{F}$ denote the density, time, velocity vector, pressure, dynamic viscosity and body force vector, respectively. Since the flow is assumed to be both steady and fully developed, the inertia term is dropped from the momentum equation and the axial velocity
 $U_{z}$ becomes a function of the transverse coordinates only. The body force vector
 $\boldsymbol{F}$ is the superposition of the force exerted on the ions by the electric field
 $\boldsymbol{E}$, given as
 $\unicode[STIX]{x1D70C}_{e}\boldsymbol{E}$, and the drag force created by the polyelectrolyte brushes. The widely accepted approach to accounting for the drag force is to consider a volumetric resistive force proportional to the velocity, which is equivalent to modelling the PEL as a porous medium utilizing the Brinkman equation. For a fully developed flow, such a resistive force is given as
 $f_{PEL}U_{z}$ where
 $f_{PEL}$ is the friction coefficient of the PEL per unit volume. Adding the above-mentioned terms to the Navier–Stokes equation and substituting for
 $\unicode[STIX]{x1D70C}_{e}$ from (2.3) and (2.4), the momentum equation in the axial direction becomes
 $$\begin{eqnarray}\unicode[STIX]{x1D707}\left(\frac{\unicode[STIX]{x2202}^{2}U_{z}}{\unicode[STIX]{x2202}X^{2}}+\frac{\unicode[STIX]{x2202}^{2}U_{z}}{\unicode[STIX]{x2202}Y^{2}}\right)-fU_{z}-2ez_{E}E_{z}C^{\infty }\sinh \left(\frac{ez_{E}\unicode[STIX]{x1D713}}{k_{B}T}\right)=0,\end{eqnarray}$$
where  $E_{z}$ is the applied electric field and the friction coefficient
 $f$ is equal to
 $f_{PEL}$ inside the grafted layer and 0 within the electrolyte. By introducing the following new dimensionless parameters
 $$\begin{eqnarray}U_{0}=-\frac{\unicode[STIX]{x1D700}k_{B}TE_{z}}{ez_{E}\unicode[STIX]{x1D707}},\quad u=\frac{U_{z}}{U_{0}},\quad f^{\ast }=\frac{f}{f_{PEL}},\quad \unicode[STIX]{x1D6FC}=H\left(\frac{f_{PEL}}{\unicode[STIX]{x1D707}}\right)^{1/2},\end{eqnarray}$$
with  $U_{0}=-\unicode[STIX]{x1D700}k_{B}TE_{z}/e\unicode[STIX]{x1D707}z_{E}$ being the reference velocity, and performing the Debye–Hückel linearization, the momentum equation (2.21) can be scaled as
 $$\begin{eqnarray}\frac{\unicode[STIX]{x2202}^{2}u}{\unicode[STIX]{x2202}x^{2}}+\frac{\unicode[STIX]{x2202}^{2}u}{\unicode[STIX]{x2202}y^{2}}-\unicode[STIX]{x1D6FC}^{2}f^{\ast }u+K^{2}\unicode[STIX]{x1D713}=0.\end{eqnarray}$$
The momentum equation is subject to symmetry and no-slip boundary conditions, which are written in dimensionless form as
 $$\begin{eqnarray}\left.\frac{\unicode[STIX]{x2202}u}{\unicode[STIX]{x2202}x}\right|_{x=0}=u|_{x=w}=\left.\frac{\unicode[STIX]{x2202}u}{\unicode[STIX]{x2202}y}\right|_{y=0}=u|_{y=1}=0.\end{eqnarray}$$
The solution of (2.23) satisfying the pertinent boundary conditions may be expressed as
 $$\begin{eqnarray}u=\mathop{\sum }_{j=1}^{\infty }d_{j}\cos (\unicode[STIX]{x1D709}_{r_{j}}y)\cos (\unicode[STIX]{x1D709}_{q_{j}}x/w),\end{eqnarray}$$
where  $\unicode[STIX]{x1D709}_{r_{j}}=(2r_{j}+1)\unicode[STIX]{x03C0}/2$ and
 $\unicode[STIX]{x1D709}_{q_{j}}=(2q_{j}+1)\unicode[STIX]{x03C0}/2$ with
 $r_{j}=0,1,2,\ldots$ and
 $q_{j}=0,1,2,\ldots$ . Substituting the forms (2.10) and (2.25) into (2.23), multiplying both sides by
 $\cos (\unicode[STIX]{x1D709}_{r_{i}}y)\cos (\unicode[STIX]{x1D709}_{q_{i}}x/w)$ and integrating over the dimensionless cross-sectional area, one gets
 $$\begin{eqnarray}\displaystyle & & \displaystyle \mathop{\sum }_{j=1}^{\infty }d_{j}\int _{0}^{w}\int _{0}^{1}(\unicode[STIX]{x1D709}_{r_{j}}^{2}+\unicode[STIX]{x1D709}_{q_{j}}^{2}/w^{2}+\unicode[STIX]{x1D6FC}^{2}f^{\ast })\cos (\unicode[STIX]{x1D709}_{r_{i}}y)\cos (\unicode[STIX]{x1D709}_{q_{i}}x/w)\cos (\unicode[STIX]{x1D709}_{r_{j}}y)\cos (\unicode[STIX]{x1D709}_{q_{j}}x/w)\,\text{d}y\,\text{d}x\nonumber\\ \displaystyle & & \displaystyle \quad =K^{2}\mathop{\sum }_{j=1}^{\infty }b_{j}\int _{0}^{w}\int _{0}^{1}\cos (\unicode[STIX]{x1D709}_{r_{i}}y)\cos (\unicode[STIX]{x1D709}_{q_{i}}x/w)\cos (\unicode[STIX]{x1D709}_{l_{j}}y)\cos (\unicode[STIX]{x1D709}_{m_{j}}x/w)\,\text{d}y\,\text{d}x.\end{eqnarray}$$
It should be pointed out that, because of the position-dependent nature of  $f^{\ast }$, the orthogonality condition does not hold for this case. Truncating the series on the left side from the
 $N$th term and that on the right side from the
 $M$th term and performing the integrations, a system of
 $N$ equations of
 $N$ unknowns including
 $d_{1},d_{2},\ldots ,d_{N}$ are obtained that may be written in matrix form as
 $$\begin{eqnarray}\unicode[STIX]{x1D640}\boldsymbol{d}=\boldsymbol{H},\end{eqnarray}$$
where the matrix  $\unicode[STIX]{x1D640}$ and vector
 $\boldsymbol{H}$ have the following elements:
 $$\begin{eqnarray}\displaystyle e_{ij} & = & \displaystyle \frac{\unicode[STIX]{x1D6FF}_{r_{i},r_{j}}\unicode[STIX]{x1D6FF}_{q_{i},q_{j}}}{4w}(w^{2}\unicode[STIX]{x1D709}_{r_{i}}\unicode[STIX]{x1D709}_{r_{j}}+\unicode[STIX]{x1D709}_{q_{i}}\unicode[STIX]{x1D709}_{q_{j}})+\frac{\unicode[STIX]{x1D6FC}^{2}}{4}w\unicode[STIX]{x1D6FF}_{r_{i},r_{j}}\unicode[STIX]{x1D6FF}_{q_{i},q_{j}}\nonumber\\ \displaystyle & & \displaystyle -\,\frac{\unicode[STIX]{x1D6FC}^{2}w}{4}\left.\unicode[STIX]{x27E6}\unicode[STIX]{x1D6FF}_{r_{i},r_{j}}\left\{1-l+\frac{\sin [2\unicode[STIX]{x1D709}_{r_{i}}(1-l)]}{2\unicode[STIX]{x1D709}_{r_{i}}}\right\}\right.\nonumber\\ \displaystyle & & \displaystyle +\left.(1-\unicode[STIX]{x1D6FF}_{r_{i},r_{j}})\left\{\frac{\sin [(\unicode[STIX]{x1D709}_{r_{i}}-\unicode[STIX]{x1D709}_{r_{j}})(1-l)]}{\unicode[STIX]{x1D709}_{r_{i}}-\unicode[STIX]{x1D709}_{r_{j}}}-\frac{\sin [(\unicode[STIX]{x1D709}_{r_{i}}+\unicode[STIX]{x1D709}_{r_{j}})(1-l)]}{\unicode[STIX]{x1D709}_{r_{i}}+\unicode[STIX]{x1D709}_{r_{j}}}\right\}\right.\unicode[STIX]{x27E7}\left.\unicode[STIX]{x27E6}\unicode[STIX]{x1D6FF}_{q_{i},q_{j}}\left\{1-l/w\right.\right.\nonumber\\ \displaystyle & & \displaystyle +\left.\frac{\sin [2\unicode[STIX]{x1D709}_{q_{i}}(1-l/w)]}{2\unicode[STIX]{x1D709}_{q_{i}}}\right\}\nonumber\\ \displaystyle & & \displaystyle +\left.(1-\unicode[STIX]{x1D6FF}_{q_{i},q_{j}})\left\{\frac{\sin [(\unicode[STIX]{x1D709}_{q_{i}}-\unicode[STIX]{x1D709}_{q_{j}})(1-l/w)]}{\unicode[STIX]{x1D709}_{q_{i}}-\unicode[STIX]{x1D709}_{q_{j}}}+\frac{\sin [(\unicode[STIX]{x1D709}_{q_{i}}+\unicode[STIX]{x1D709}_{q_{j}})(1-l/w)]}{\unicode[STIX]{x1D709}_{q_{i}}+\unicode[STIX]{x1D709}_{q_{j}}}\right\}\right.\unicode[STIX]{x27E7},\end{eqnarray}$$
 $$\begin{eqnarray}h_{i}=K^{2}\mathop{\sum }_{j=1}^{M}\frac{wb_{j}}{4}\left[\frac{(-1)^{r_{i}-l_{j}}}{\unicode[STIX]{x1D709}_{r_{i}}-\unicode[STIX]{x1D709}_{l_{j}}}+\frac{(-1)^{r_{i}+l_{j}}}{\unicode[STIX]{x1D709}_{r_{i}}+\unicode[STIX]{x1D709}_{l_{j}}}\right]\left[\frac{(-1)^{q_{i}-m_{j}}}{\unicode[STIX]{x1D709}_{q_{i}}-\unicode[STIX]{x1D709}_{m_{j}}}+\frac{(-1)^{q_{i}+m_{j}}}{\unicode[STIX]{x1D709}_{q_{i}}+\unicode[STIX]{x1D709}_{m_{j}}}\right].\end{eqnarray}$$
So the vector  $\boldsymbol{d}$, which stands for the coefficients
 $d_{j}$, can be readily obtained as
 $\boldsymbol{d}=\unicode[STIX]{x1D640}^{-1}\boldsymbol{H}$.
As soon as the dimensionless velocity  $u$ is obtained, the dimensionless mean velocity can be evaluated as
 $$\begin{eqnarray}u_{m}=\frac{\displaystyle \int _{0}^{w}\int _{0}^{1}u\,\text{d}y\,\text{d}x}{\displaystyle \int _{0}^{w}\int _{0}^{1}\,\text{d}y\,\text{d}x}=\mathop{\sum }_{j=1}^{N}\frac{d_{j}(-1)^{r_{j}+q_{j}}}{\unicode[STIX]{x1D709}_{r_{j}}\unicode[STIX]{x1D709}_{q_{j}}}.\end{eqnarray}$$
2.3.1 Special solution for $w\rightarrow \infty$

The momentum equation for this case reduces to the following equations for the electrolyte and the PEL:
 $$\begin{eqnarray}\displaystyle & \displaystyle \frac{\text{d}^{2}u_{E}}{\text{d}y^{2}}+K^{2}u_{E}=0, & \displaystyle\end{eqnarray}$$
 $$\begin{eqnarray}\displaystyle & \displaystyle \frac{\text{d}^{2}u_{PEL}}{\text{d}y^{2}}-\unicode[STIX]{x1D6FC}^{2}u_{PEL}+K^{2}\unicode[STIX]{x1D713}_{PEL}=0. & \displaystyle\end{eqnarray}$$
In addition, the boundary and interfacial conditions read
 $$\begin{eqnarray}\displaystyle & \displaystyle \left.\frac{\text{d}u_{E}}{\text{d}y}\right|_{y=0}=u_{PEL}|_{y=1}=0, & \displaystyle\end{eqnarray}$$
 $$\begin{eqnarray}\displaystyle & \displaystyle u_{E}|_{y=1-l}=u_{PEL}|_{y=1-l}, & \displaystyle\end{eqnarray}$$
 $$\begin{eqnarray}\displaystyle & \displaystyle \left.\frac{\text{d}u_{E}}{\text{d}y}\right|_{y=1-l}=\left.\frac{\text{d}u_{PEL}}{\text{d}y}\right|_{y=1-l}. & \displaystyle\end{eqnarray}$$
It can be demonstrated that the solutions of (2.30) and (2.31) subject to the conditions (2.32) are given as
 $$\begin{eqnarray}u_{E}=-b_{E1}\cosh (Ky)+b_{E2},\end{eqnarray}$$
 $$\begin{eqnarray}\displaystyle u_{PEL} & = & \displaystyle b_{PEL2}[\cosh (\unicode[STIX]{x1D6FC}y)-\coth \unicode[STIX]{x1D6FC}\sinh (\unicode[STIX]{x1D6FC}y)]\nonumber\\ \displaystyle & & \displaystyle +\,\left[(\cosh K)^{-1}\left(\frac{K^{2}b_{PEL1}}{K^{2}-\unicode[STIX]{x1D6FC}^{2}}\right)-\frac{K^{2}}{\unicode[STIX]{x1D6FC}^{2}\unicode[STIX]{x1D702}_{\unicode[STIX]{x1D706}}^{2}}\right]\frac{\sinh (\unicode[STIX]{x1D6FC}y)}{\sinh \unicode[STIX]{x1D6FC}}\nonumber\\ \displaystyle & & \displaystyle -\,\left(\frac{K^{2}b_{PEL1}}{K^{2}-\unicode[STIX]{x1D6FC}^{2}}\right)\cosh (Ky)+\tanh K\left(\frac{K^{2}b_{PEL1}}{K^{2}-\unicode[STIX]{x1D6FC}^{2}}\right)\sinh (Ky)+\frac{K^{2}}{\unicode[STIX]{x1D6FC}^{2}\unicode[STIX]{x1D702}_{\unicode[STIX]{x1D706}}^{2}},\qquad\end{eqnarray}$$
where
 $$\begin{eqnarray}\displaystyle & & \displaystyle b_{E2}=b_{PEL2}\{\cosh [\unicode[STIX]{x1D6FC}(1-l)]-\coth \unicode[STIX]{x1D6FC}\sinh [\unicode[STIX]{x1D6FC}(1-l)]\}\nonumber\\ \displaystyle & & \displaystyle \quad +\,\left[(\cosh K)^{-1}\left(\frac{K^{2}b_{PEL1}}{K^{2}-\unicode[STIX]{x1D6FC}^{2}}\right)-\frac{K^{2}}{\unicode[STIX]{x1D6FC}^{2}\unicode[STIX]{x1D702}_{\unicode[STIX]{x1D706}}^{2}}\right]\frac{\sinh [\unicode[STIX]{x1D6FC}(1-l)]}{\sinh \unicode[STIX]{x1D6FC}}-\left(\frac{K^{2}b_{PEL1}}{K^{2}-\unicode[STIX]{x1D6FC}^{2}}\right)\cosh [K(1-l)]\nonumber\\ \displaystyle & & \displaystyle \quad +\,\tanh K\left(\frac{K^{2}b_{PEL1}}{K^{2}-\unicode[STIX]{x1D6FC}^{2}}\right)\sinh [K(1-l)]+\frac{K^{2}}{\unicode[STIX]{x1D6FC}^{2}\unicode[STIX]{x1D702}_{\unicode[STIX]{x1D706}}^{2}}+b_{E1}\cosh [K(1-l)],\end{eqnarray}$$
 $$\begin{eqnarray}\displaystyle b_{PEL2} & = & \displaystyle \unicode[STIX]{x1D6FC}^{-1}\{\sinh [\unicode[STIX]{x1D6FC}(1-l)]-\coth \unicode[STIX]{x1D6FC}\cosh [\unicode[STIX]{x1D6FC}(1-l)]\}^{-1}\left\{-b_{E1}K\sinh [K(1-l)]\right.\nonumber\\ \displaystyle & & \displaystyle -\,\unicode[STIX]{x1D6FC}\left[(\cosh K)^{-1}\left(\frac{K^{2}b_{PEL1}}{K^{2}-\unicode[STIX]{x1D6FC}^{2}}\right)-\frac{K^{2}}{\unicode[STIX]{x1D6FC}^{2}\unicode[STIX]{x1D702}_{\unicode[STIX]{x1D706}}^{2}}\right]\nonumber\\ \displaystyle & & \displaystyle \times \,\frac{\cosh [\unicode[STIX]{x1D6FC}(1-l)]}{\sinh \unicode[STIX]{x1D6FC}}+\left(\frac{K^{3}b_{PEL1}}{K^{2}-\unicode[STIX]{x1D6FC}^{2}}\right)\sinh [K(1-l)]\nonumber\\ \displaystyle & & \displaystyle -\left.\left(\frac{K^{3}b_{PEL1}}{K^{2}-\unicode[STIX]{x1D6FC}^{2}}\right)\tanh K\cosh [K(1-l)]\right\}.\end{eqnarray}$$
And the mean velocity becomes
 $$\begin{eqnarray}\displaystyle u_{m} & = & \displaystyle \int _{0}^{1-l}u_{E}\,\text{d}y+\int _{1-l}^{1}u_{PEL}\,\text{d}y\nonumber\\ \displaystyle & = & \displaystyle -\frac{b_{E1}}{K}\sinh [K(1-l)]+b_{E2}(1-l)\nonumber\\ \displaystyle & & \displaystyle -\,\unicode[STIX]{x1D6FC}^{-1}b_{PEL2}\{\sinh [\unicode[STIX]{x1D6FC}(1-l)]-\coth \unicode[STIX]{x1D6FC}\cosh [\unicode[STIX]{x1D6FC}(1-l)]+(\sinh \unicode[STIX]{x1D6FC})^{-1}\}\nonumber\\ \displaystyle & & \displaystyle +\,K^{2}\unicode[STIX]{x1D6FC}^{-1}\left[(\cosh K)^{-1}\left(\frac{b_{PEL1}}{K^{2}-\unicode[STIX]{x1D6FC}^{2}}\right)-\unicode[STIX]{x1D6FC}^{-2}\unicode[STIX]{x1D702}_{\unicode[STIX]{x1D706}}^{-2}\right]\left\{\coth \unicode[STIX]{x1D6FC}-\frac{\cosh [\unicode[STIX]{x1D6FC}(1-l)]}{\sinh \unicode[STIX]{x1D6FC}}\right\}\nonumber\\ \displaystyle & & \displaystyle -\,\left(\frac{Kb_{PEL1}}{K^{2}-\unicode[STIX]{x1D6FC}^{2}}\right)\{\sinh K-\sinh [K(1-l)]\}+\tanh K\left(\frac{Kb_{PEL1}}{K^{2}-\unicode[STIX]{x1D6FC}^{2}}\right)\nonumber\\ \displaystyle & & \displaystyle \times \,\{\cosh K-\cosh [K(1-l)]\}+\frac{K^{2}l}{\unicode[STIX]{x1D6FC}^{2}\unicode[STIX]{x1D702}_{\unicode[STIX]{x1D706}}^{2}}.\end{eqnarray}$$
2.4 Concentration field
The solute concentration distribution due to an injection source at  $z=0$ can be described by the following transient advective–diffusive equation:
 $$\begin{eqnarray}\frac{\unicode[STIX]{x2202}C}{\unicode[STIX]{x2202}\unicode[STIX]{x1D70F}}+\unicode[STIX]{x1D735}\boldsymbol{\cdot }(\boldsymbol{U}C)=\unicode[STIX]{x1D735}\boldsymbol{\cdot }(D\unicode[STIX]{x1D735}C),\end{eqnarray}$$
where  $\unicode[STIX]{x1D70F}$ denotes the time,
 $D$ stands for the molecular diffusivity and
 $C$ is the number concentration of solutes. Note that, due to the presence of polyelectrolyte brushes, the molecular diffusivity in the PEL is smaller than that in the bulk. Nevertheless, considering the fact that the effective diffusion coefficient in a porous medium of high porosity is approximately the same as that in void spaces (Vafai Reference Vafai2005), the diffusion coefficient in the soft layer may be considered the same as that in the bulk due to the small grafting densities assumed in the analysis. As we would like to perform separate analyses for slit and rectangular microchannels, the subscripts 1 and 2 are hereafter used for these geometries, respectively, to distinguish between the associated concentrations. Since we consider a fully developed flow of a liquid with constant thermophysical properties, equation (2.37) can be simplified to yield the following equations for slit and rectangular geometries, respectively,
 $$\begin{eqnarray}\displaystyle & \displaystyle \frac{\unicode[STIX]{x2202}C_{1}}{\unicode[STIX]{x2202}\unicode[STIX]{x1D70F}}+U_{z}\frac{\unicode[STIX]{x2202}C_{1}}{\unicode[STIX]{x2202}Z}=D\left[\frac{\unicode[STIX]{x2202}^{2}C_{1}}{\unicode[STIX]{x2202}Y^{2}}+\frac{\unicode[STIX]{x2202}^{2}C_{1}}{\unicode[STIX]{x2202}Z^{2}}\right], & \displaystyle\end{eqnarray}$$
 $$\begin{eqnarray}\displaystyle & \displaystyle \frac{\unicode[STIX]{x2202}C_{2}}{\unicode[STIX]{x2202}\unicode[STIX]{x1D70F}}+U_{z}\frac{\unicode[STIX]{x2202}C_{2}}{\unicode[STIX]{x2202}Z}=D\left[\frac{\unicode[STIX]{x2202}^{2}C_{2}}{\unicode[STIX]{x2202}X^{2}}+\frac{\unicode[STIX]{x2202}^{2}C_{2}}{\unicode[STIX]{x2202}Y^{2}}+\frac{\unicode[STIX]{x2202}^{2}C_{2}}{\unicode[STIX]{x2202}Z^{2}}\right], & \displaystyle\end{eqnarray}$$
which are subject to the following initial and boundary conditions:
 $$\begin{eqnarray}\displaystyle & \displaystyle C_{1}(0,Y,Z)=C_{0}H\unicode[STIX]{x1D6FF}(Z)\unicode[STIX]{x1D703}_{1}(Y), & \displaystyle\end{eqnarray}$$
 $$\begin{eqnarray}\displaystyle & \displaystyle \left.\frac{\unicode[STIX]{x2202}C_{1}}{\unicode[STIX]{x2202}Y}\right|_{Y=0}=\left.\frac{\unicode[STIX]{x2202}C_{1}}{\unicode[STIX]{x2202}X}\right|_{X=0}=0, & \displaystyle\end{eqnarray}$$
 $$\begin{eqnarray}\displaystyle & \displaystyle -D\left.\frac{\unicode[STIX]{x2202}C_{1}}{\unicode[STIX]{x2202}Y}\right|_{Y=H}=k_{R}C_{1}|_{Y=H},\quad -D\left.\frac{\unicode[STIX]{x2202}C_{1}}{\unicode[STIX]{x2202}X}\right|_{X=W}=k_{R}C_{1}|_{X=W}, & \displaystyle\end{eqnarray}$$
 $$\begin{eqnarray}\displaystyle & \displaystyle \lim _{Z\rightarrow \infty }C_{1}=\lim _{Z\rightarrow \infty }\frac{\unicode[STIX]{x2202}C_{1}}{\unicode[STIX]{x2202}Z}=0, & \displaystyle\end{eqnarray}$$
 $$\begin{eqnarray}\displaystyle & \displaystyle C_{2}(0,X,Y,Z)=C_{0}H\unicode[STIX]{x1D6FF}(Z)\unicode[STIX]{x1D703}_{2}(X,Y), & \displaystyle\end{eqnarray}$$
 $$\begin{eqnarray}\displaystyle & \displaystyle \left.\frac{\unicode[STIX]{x2202}C_{2}}{\unicode[STIX]{x2202}Y}\right|_{Y=0}=\left.\frac{\unicode[STIX]{x2202}C_{2}}{\unicode[STIX]{x2202}X}\right|_{X=0}=0, & \displaystyle\end{eqnarray}$$
 $$\begin{eqnarray}\displaystyle & \displaystyle -D\left.\frac{\unicode[STIX]{x2202}C_{2}}{\unicode[STIX]{x2202}Y}\right|_{Y=H}=k_{R}C_{2}|_{Y=H},\quad -D\left.\frac{\unicode[STIX]{x2202}C_{2}}{\unicode[STIX]{x2202}X}\right|_{X=W}=k_{R}C_{2}|_{X=W}, & \displaystyle\end{eqnarray}$$
 $$\begin{eqnarray}\displaystyle & \displaystyle \lim _{Z\rightarrow \infty }C_{2}=\lim _{Z\rightarrow \infty }\frac{\unicode[STIX]{x2202}C_{2}}{\unicode[STIX]{x2202}Z}=0, & \displaystyle\end{eqnarray}$$
 $\unicode[STIX]{x1D6FF}$ is the Dirac delta function. Equations (2.40c) and (2.41c) show that an irreversible first-order reaction with the rate
 $k_{R}$ occurs at the walls. It is here emphasized that, although irreversible reactions are possible in microfluidic devices, surface adsorption is mainly a reversible phenomenon, which is usually modelled by a first-order Langmuir adsorption model (Sadeghi et al. Reference Sadeghi, Amini, Saidi and Chakraborty2014). Approximating the Langmuir model by the form given in (2.40c) and (2.41c) is inevitable for analytical tractability of the problem. This way, we neglect some characteristics of reversible surface reactions, while retaining its most important physical features that are the same as those for reversible reactions.
Equations (2.38) and (2.39) are made dimensionless by using the following dimensionless parameters:
 $$\begin{eqnarray}c_{i}=\frac{C_{i}}{C_{0}},\quad t=\frac{\unicode[STIX]{x1D70F}D}{H^{2}},\quad z=\frac{Z}{HPe},\quad Pe=\frac{HU_{0}}{D},\quad Da=\frac{Hk_{R}}{D}.\end{eqnarray}$$
The dimensionless solute transport equations and the pertinent initial and boundary conditions then become
 $$\begin{eqnarray}\frac{\unicode[STIX]{x2202}c_{1}}{\unicode[STIX]{x2202}t}+u_{1}(y)\frac{\unicode[STIX]{x2202}c_{1}}{\unicode[STIX]{x2202}z}=\frac{\unicode[STIX]{x2202}^{2}c_{1}}{\unicode[STIX]{x2202}y^{2}}+\frac{1}{Pe^{2}}\frac{\unicode[STIX]{x2202}^{2}c_{1}}{\unicode[STIX]{x2202}z^{2}},\end{eqnarray}$$
 $$\begin{eqnarray}\displaystyle & \displaystyle c_{1}(0,y,z)=Pe^{-1}\unicode[STIX]{x1D6FF}(z)\unicode[STIX]{x1D703}_{1}(y), & \displaystyle\end{eqnarray}$$
 $$\begin{eqnarray}\displaystyle & \displaystyle \left.\frac{\unicode[STIX]{x2202}c_{1}}{\unicode[STIX]{x2202}y}\right|_{y=0}=0, & \displaystyle\end{eqnarray}$$
 $$\begin{eqnarray}\displaystyle & \displaystyle \left.\frac{\unicode[STIX]{x2202}c_{1}}{\unicode[STIX]{x2202}y}\right|_{y=1}=-Dac_{1}|_{y=1}, & \displaystyle\end{eqnarray}$$
 $$\begin{eqnarray}\displaystyle & \displaystyle \lim _{z\rightarrow \infty }c_{1}=\lim _{z\rightarrow \infty }\frac{\unicode[STIX]{x2202}c_{1}}{\unicode[STIX]{x2202}z}=0, & \displaystyle\end{eqnarray}$$
 $$\begin{eqnarray}\frac{\unicode[STIX]{x2202}c_{2}}{\unicode[STIX]{x2202}t}+u_{2}(x,y)\frac{\unicode[STIX]{x2202}c_{2}}{\unicode[STIX]{x2202}z}=\frac{\unicode[STIX]{x2202}^{2}c_{2}}{\unicode[STIX]{x2202}x^{2}}+\frac{\unicode[STIX]{x2202}^{2}c_{2}}{\unicode[STIX]{x2202}y^{2}}+\frac{1}{Pe^{2}}\frac{\unicode[STIX]{x2202}^{2}c_{2}}{\unicode[STIX]{x2202}z^{2}},\end{eqnarray}$$
 $$\begin{eqnarray}\displaystyle & \displaystyle c_{2}(0,x,y,z)=Pe^{-1}\unicode[STIX]{x1D6FF}(z)\unicode[STIX]{x1D703}_{2}(x,y), & \displaystyle\end{eqnarray}$$
 $$\begin{eqnarray}\displaystyle & \displaystyle \left.\frac{\unicode[STIX]{x2202}c_{2}}{\unicode[STIX]{x2202}y}\right|_{y=0}=\left.\frac{\unicode[STIX]{x2202}c_{2}}{\unicode[STIX]{x2202}x}\right|_{x=0}=0, & \displaystyle\end{eqnarray}$$
 $$\begin{eqnarray}\displaystyle & \displaystyle \left.\frac{\unicode[STIX]{x2202}c_{2}}{\unicode[STIX]{x2202}y}\right|_{y=1}=-Dac_{2}|_{y=1},\quad \left.\frac{\unicode[STIX]{x2202}c_{2}}{\unicode[STIX]{x2202}x}\right|_{x=w}=-Dac_{2}|_{x=w}, & \displaystyle\end{eqnarray}$$
 $$\begin{eqnarray}\displaystyle & \displaystyle \lim _{z\rightarrow \infty }c_{2}=\lim _{z\rightarrow \infty }\frac{\unicode[STIX]{x2202}c_{2}}{\unicode[STIX]{x2202}z}=0. & \displaystyle\end{eqnarray}$$
The unsteady transport equation with the associated initial and boundary conditions can be solved using the method proposed by Gill & Sankarasubramanian (Reference Gill and Sankarasubramanian1970). In this method, the solute concentration  $c$ is expanded in an infinite series as follows:
 $$\begin{eqnarray}\displaystyle & \displaystyle c_{1}(t,y,z)=\mathop{\sum }_{n=0}^{\infty }f_{n,1}(t,y)\frac{\unicode[STIX]{x2202}^{n}c_{m,1}(t,z)}{\unicode[STIX]{x2202}z^{n}}, & \displaystyle\end{eqnarray}$$
 $$\begin{eqnarray}\displaystyle & \displaystyle c_{2}(t,x,y,z)=\mathop{\sum }_{n=0}^{\infty }f_{n,2}(t,x,y)\frac{\unicode[STIX]{x2202}^{n}c_{m,2}(t,z)}{\unicode[STIX]{x2202}z^{n}}, & \displaystyle\end{eqnarray}$$
where the dimensionless mean concentration  $c_{m}(t,z)$ is defined as
 $$\begin{eqnarray}\displaystyle & \displaystyle c_{m,1}(t,z)=\int _{0}^{1}c_{1}\,\text{d}y, & \displaystyle\end{eqnarray}$$
 $$\begin{eqnarray}\displaystyle & \displaystyle c_{m,2}(t,z)=\frac{\displaystyle \int _{0}^{w}\int _{0}^{1}c_{2}\,\text{d}y\,\text{d}x}{w}. & \displaystyle\end{eqnarray}$$
By integrating the dimensionless concentration equations (2.43) and (2.45) over the microchannel cross-sectional area and using the mean concentration definition in (2.49) and (2.50) we will have
 $$\begin{eqnarray}\frac{\unicode[STIX]{x2202}c_{m,1}}{\unicode[STIX]{x2202}t}=\frac{1}{Pe^{2}}\frac{\unicode[STIX]{x2202}^{2}c_{m,1}}{\unicode[STIX]{x2202}z^{2}}+\left.\frac{\unicode[STIX]{x2202}c_{1}}{\unicode[STIX]{x2202}y}\right|_{y=1}-\frac{\unicode[STIX]{x2202}}{\unicode[STIX]{x2202}z}\int _{0}^{1}u_{1}c_{1}\,\text{d}y,\end{eqnarray}$$
 $$\begin{eqnarray}\displaystyle \frac{\unicode[STIX]{x2202}c_{m,2}}{\unicode[STIX]{x2202}t} & = & \displaystyle \frac{1}{Pe^{2}}\frac{\unicode[STIX]{x2202}^{2}c_{m,2}}{\unicode[STIX]{x2202}z^{2}}+\frac{1}{w}\left(\int _{0}^{1}\left.\frac{\unicode[STIX]{x2202}c_{2}}{\unicode[STIX]{x2202}x}\right|_{x=w}\,\text{d}y+\int _{0}^{w}\left.\frac{\unicode[STIX]{x2202}c_{2}}{\unicode[STIX]{x2202}y}\right|_{y=1}\,\text{d}x\right)\nonumber\\ \displaystyle & & \displaystyle -\,\frac{1}{w}\frac{\unicode[STIX]{x2202}}{\unicode[STIX]{x2202}z}\int _{0}^{1}\int _{0}^{w}u_{2}c_{2}\,\text{d}x\,\text{d}y.\end{eqnarray}$$
Then, substituting the local concentration formulas from (2.47) and (2.48) into (2.51) and (2.52) and rearranging gives the following dispersion model for  $c_{m}$:
 $$\begin{eqnarray}\frac{\unicode[STIX]{x2202}c_{m,i}}{\unicode[STIX]{x2202}t}=\mathop{\sum }_{n=0}^{\infty }K_{n,i}(t)\frac{\unicode[STIX]{x2202}^{n}c_{m,i}(t,z)}{\unicode[STIX]{x2202}z^{n}},\quad i=1,2,\end{eqnarray}$$
where the coefficients  $K_{n,i}(t)$ are
 $$\begin{eqnarray}K_{n,1}(t)=\frac{\unicode[STIX]{x1D6FF}_{n,2}}{Pe^{2}}+\left.\frac{\unicode[STIX]{x2202}f_{n,1}}{\unicode[STIX]{x2202}y}\right|_{y=1}-\int _{0}^{1}u_{1}(y)f_{n-1,1}\,\text{d}y,\quad n=0,1,2,\ldots ,\end{eqnarray}$$
 $$\begin{eqnarray}\displaystyle K_{n,2}(t) & = & \displaystyle \frac{\unicode[STIX]{x1D6FF}_{n,2}}{Pe^{2}}+\frac{1}{w}\left(\int _{0}^{1}\left.\frac{\unicode[STIX]{x2202}f_{n,2}}{\unicode[STIX]{x2202}x}\right|_{x=w}\,\text{d}y+\int _{0}^{w}\left.\frac{\unicode[STIX]{x2202}f_{n,2}}{\unicode[STIX]{x2202}y}\right|_{y=1}\,\text{d}x\right)\nonumber\\ \displaystyle & & \displaystyle -\,\frac{1}{w}\int _{0}^{1}\int _{0}^{w}u_{2}(x,y)f_{n-1,2}\,\text{d}x\,\text{d}y,\quad n=0,1,2\ldots .\end{eqnarray}$$
Neglecting the terms with  $3\leqslant n$ due to their negligible contribution to the dispersion of the mean concentration, equation (2.53) is reduced to
 $$\begin{eqnarray}\frac{\unicode[STIX]{x2202}c_{m,i}}{\unicode[STIX]{x2202}t}=K_{0,i}(t)c_{m,i}+K_{1,i}(t)\frac{\unicode[STIX]{x2202}c_{m,i}}{\unicode[STIX]{x2202}z}+K_{2,i}(t)\frac{\unicode[STIX]{x2202}^{2}c_{m,i}}{\unicode[STIX]{x2202}z^{2}},\end{eqnarray}$$
where  $K_{0,i}(t)$ is the exchange coefficient due to non-zero solute flux at the tube wall,
 $K_{1,i}(t)$ is the convection coefficient due to convective transport of the solutes and
 $K_{2,i}(t)$ is the dispersion coefficient due to molecular diffusion and non-uniformity of the velocity profile. So the behaviour of solute dispersion can be described well by evaluating these three transport coefficients.
Besides appropriate initial and boundary conditions, the determination of  $K_{0,i}(t)$,
 $K_{1,i}(t)$ and
 $K_{2,i}(t)$ is needed to solve (2.56). Considering (2.54) and (2.55), we must first evaluate functions
 $f_{n}$. The equations governing
 $f_{n}$ can be achieved by substituting the local concentration distributions from (2.47) and (2.48) and also the time derivative of
 $c_{m}$ from (2.53) into (2.43) and (2.45) and then equating the coefficients of
 $\unicode[STIX]{x2202}^{n}c_{m}/\unicode[STIX]{x2202}z^{n}$. The desired equations then read
 $$\begin{eqnarray}\displaystyle & \displaystyle \frac{\unicode[STIX]{x2202}f_{n,1}}{\unicode[STIX]{x2202}t}=\frac{\unicode[STIX]{x2202}^{2}f_{n,1}}{\unicode[STIX]{x2202}y^{2}}+\frac{f_{n-2,1}}{Pe^{2}}-u_{1}f_{n-1,1}-\mathop{\sum }_{i=0}^{\infty }f_{n-i,1}K_{i,1}(t), & \displaystyle\end{eqnarray}$$
 $$\begin{eqnarray}\displaystyle & \displaystyle \frac{\unicode[STIX]{x2202}f_{n,2}}{\unicode[STIX]{x2202}t}=\frac{\unicode[STIX]{x2202}^{2}f_{n,2}}{\unicode[STIX]{x2202}x^{2}}+\frac{\unicode[STIX]{x2202}^{2}f_{n,2}}{\unicode[STIX]{x2202}y^{2}}+\frac{f_{n-2,2}}{Pe^{2}}-u_{2}f_{n-1,2}-\mathop{\sum }_{i=0}^{\infty }f_{n-i,2}K_{i,2}(t), & \displaystyle\end{eqnarray}$$
where  $f_{-1}=f_{-2}=\cdots =0$. Substituting (2.47) and (2.48) into (2.44) and (2.46) and recalling that
 $c_{m,i}(0,z)=Pe^{-1}\unicode[STIX]{x1D6FF}(z)\unicode[STIX]{x1D703}_{m,i}$ where
 $\unicode[STIX]{x1D703}_{m,1}=\int _{0}^{1}\unicode[STIX]{x1D703}_{1}\,\text{d}y$ and
 $\unicode[STIX]{x1D703}_{m,2}=\int _{0}^{1}\int _{0}^{w}\unicode[STIX]{x1D703}_{2}\,\text{d}x\,\text{d}y/w$, the associated initial and boundary conditions are obtained as
 $$\begin{eqnarray}\displaystyle & \displaystyle f_{0,1}(0,y)=\frac{\unicode[STIX]{x1D703}_{1}(y)}{\unicode[STIX]{x1D703}_{m,1}},\quad f_{n\geqslant 1,1}(0,y)=0, & \displaystyle\end{eqnarray}$$
 $$\begin{eqnarray}\displaystyle & \displaystyle \left.\frac{\unicode[STIX]{x2202}f_{n,1}}{\unicode[STIX]{x2202}y}\right|_{y=0}=0, & \displaystyle\end{eqnarray}$$
 $$\begin{eqnarray}\displaystyle & \displaystyle \left.\frac{\unicode[STIX]{x2202}f_{n,1}}{\unicode[STIX]{x2202}y}\right|_{y=1}=-Daf_{n,1}|_{y=1}, & \displaystyle\end{eqnarray}$$
 $$\begin{eqnarray}\displaystyle & \displaystyle f_{0,2}(0,x,y)=\frac{\unicode[STIX]{x1D703}_{2}(x,y)}{\unicode[STIX]{x1D703}_{m,2}},\quad f_{n\geqslant 1,2}(0,x,y)=0, & \displaystyle\end{eqnarray}$$
 $$\begin{eqnarray}\displaystyle & \displaystyle \left.\frac{\unicode[STIX]{x2202}f_{n,2}}{\unicode[STIX]{x2202}x}\right|_{x=0}=\left.\frac{\unicode[STIX]{x2202}f_{n,2}}{\unicode[STIX]{x2202}y}\right|_{y=0}=0, & \displaystyle\end{eqnarray}$$
 $$\begin{eqnarray}\displaystyle & \displaystyle \left.\frac{\unicode[STIX]{x2202}f_{n,2}}{\unicode[STIX]{x2202}x}\right|_{x=w}=-Daf_{n,2}|_{x=w},\quad \left.\frac{\unicode[STIX]{x2202}f_{n,2}}{\unicode[STIX]{x2202}y}\right|_{y=1}=-Daf_{n,2}|_{y=1}. & \displaystyle\end{eqnarray}$$
Now, integrating (2.59a) and (2.60a) over the dimensionless cross-sectional area provides
 $$\begin{eqnarray}\displaystyle & \displaystyle \int _{0}^{1}f_{n,1}\,\text{d}y=\unicode[STIX]{x1D6FF}_{n,0}, & \displaystyle\end{eqnarray}$$
 $$\begin{eqnarray}\displaystyle & \displaystyle \frac{1}{w}\int _{0}^{w}\int _{0}^{1}f_{n,2}\,\text{d}y\,\text{d}x=\unicode[STIX]{x1D6FF}_{n,0}. & \displaystyle\end{eqnarray}$$
In order to obtain the unsteady solution transport in the microchannel, the unknown parameters  $K_{0,i}(t)$,
 $K_{1,i}(t)$,
 $K_{2,i}(t)$ and
 $f_{0,i}(t,x,y)$,
 $f_{1,i}(t,x,y)$ and
 $f_{2,i}(t,x,y)$ must be evaluated via solving the coupled systems of (2.57) and (2.58) subject to the associated boundary conditions given in (2.59) and (2.60). An appropriate method is to utilize the eigenfunction expansion, a method that is adopted here.
2.4.1 Exchange coefficient
The equation governing the parameter  $f_{0}$ can be written by substituting
 $n=0$ into (2.57) and (2.58) as follows:
 $$\begin{eqnarray}\displaystyle & \displaystyle \frac{\unicode[STIX]{x2202}f_{0,1}}{\unicode[STIX]{x2202}t}=\frac{\unicode[STIX]{x2202}^{2}f_{0,1}}{\unicode[STIX]{x2202}y^{2}}-f_{0,1}K_{0,1}, & \displaystyle\end{eqnarray}$$
 $$\begin{eqnarray}\displaystyle & \displaystyle \frac{\unicode[STIX]{x2202}f_{0,2}}{\unicode[STIX]{x2202}t}=\frac{\unicode[STIX]{x2202}^{2}f_{0,2}}{\unicode[STIX]{x2202}x^{2}}+\frac{\unicode[STIX]{x2202}^{2}f_{0,2}}{\unicode[STIX]{x2202}y^{2}}-f_{0,2}K_{0,2}, & \displaystyle\end{eqnarray}$$
with the associated initial and boundary conditions, given in (2.59) and (2.60), for  $n=0$. The solution of
 $f_{0}$ can be determined as
 $$\begin{eqnarray}f_{0,i}(x,y,t)=\mathop{\sum }_{n=0}^{\infty }A_{n,i}\text{EXP}(n,t,i)\exp \left[-\int _{0}^{t}K_{0,i}(s)\,\text{d}s\right]\text{COS}(n,x,y,i),\end{eqnarray}$$
where
 $$\begin{eqnarray}\displaystyle & \displaystyle \text{EXP}(n,t,i)=\unicode[STIX]{x1D6FF}_{1,i}\exp (-\unicode[STIX]{x1D706}_{n}^{2}t)+\unicode[STIX]{x1D6FF}_{2,i}\exp (-\unicode[STIX]{x1D706}_{rn}^{2}-\unicode[STIX]{x1D6FE}_{sn}^{2})t, & \displaystyle\end{eqnarray}$$
 $$\begin{eqnarray}\displaystyle & \displaystyle \text{COS}(n,x,y,i)=\unicode[STIX]{x1D6FF}_{1,i}\cos (\unicode[STIX]{x1D706}_{n}y)+\unicode[STIX]{x1D6FF}_{2,i}\cos (\unicode[STIX]{x1D706}_{rn}y)\cos (\unicode[STIX]{x1D6FE}_{sn}x). & \displaystyle\end{eqnarray}$$
The eigenvalues  $\unicode[STIX]{x1D706}_{rn}$ and
 $\unicode[STIX]{x1D6FE}_{sn}$ or
 $\unicode[STIX]{x1D706}_{n}$ must satisfy the following equations:
 $$\begin{eqnarray}\unicode[STIX]{x1D706}_{rn}\sin \unicode[STIX]{x1D706}_{rn}=Da\cos \unicode[STIX]{x1D706}_{rn},\quad \unicode[STIX]{x1D6FE}_{sn}\sin (\unicode[STIX]{x1D6FE}_{sn}w)=Da\cos (\unicode[STIX]{x1D6FE}_{sn}w),\end{eqnarray}$$
 $$\begin{eqnarray}\unicode[STIX]{x1D706}_{n}\sin \unicode[STIX]{x1D706}_{n}=Da\cos \unicode[STIX]{x1D706}_{n}.\end{eqnarray}$$
Moreover, the constants  $A_{n,i}$ are determined, by the substitution of the form (2.65) into (2.59a) and (2.60a) for
 $n=0$, as
 $$\begin{eqnarray}A_{n,i}=\frac{\displaystyle \int _{0}^{1}\left[\unicode[STIX]{x1D703}\unicode[STIX]{x1D6FF}_{1,i}\text{COS}(n,x,y,1)+\unicode[STIX]{x1D6FF}_{2,i}\int _{0}^{w}\unicode[STIX]{x1D703}\text{COS}(n,x,y,2)\,\text{d}x\right]\,\text{d}y}{\unicode[STIX]{x1D703}_{m,i}\text{INTCOS}(n,i)},\end{eqnarray}$$
where
 $$\begin{eqnarray}\displaystyle & \displaystyle \text{INTCOS}(n,i)=\unicode[STIX]{x1D6FF}_{1,i}\text{Intcos}\_1(n)+\unicode[STIX]{x1D6FF}_{2,i}\text{Intcos}\_2(n), & \displaystyle\end{eqnarray}$$
 $$\begin{eqnarray}\displaystyle & \displaystyle \text{Intcos}\_1(n)=\int _{0}^{1}\cos ^{2}(\unicode[STIX]{x1D706}_{n}y)\,\text{d}y=\frac{1}{2}+\frac{1}{4\unicode[STIX]{x1D706}_{n}}\sin (2\unicode[STIX]{x1D706}_{n}), & \displaystyle\end{eqnarray}$$
 $$\begin{eqnarray}\displaystyle \text{Intcos}\_2(n) & = & \displaystyle \int _{0}^{w}\int _{0}^{1}\cos ^{2}(\unicode[STIX]{x1D6FE}_{sn}x)\cos ^{2}(\unicode[STIX]{x1D706}_{rn}y)\,\text{d}y\,\text{d}x\nonumber\\ \displaystyle & = & \displaystyle \left[\frac{1}{2}+\frac{1}{4\unicode[STIX]{x1D706}_{rn}}\sin (2\unicode[STIX]{x1D706}_{rn})\right]\left[\frac{w}{2}+\frac{1}{4\unicode[STIX]{x1D6FE}_{sn}}\sin (2w\unicode[STIX]{x1D6FE}_{sn})\right].\end{eqnarray}$$
Using the integral condition in (2.61) and (2.62), one obtains
 $$\begin{eqnarray}\exp \left[-\int _{0}^{t}K_{0,i}(s)\,\text{d}s\right]=\frac{\unicode[STIX]{x1D6FF}_{1,i}+\unicode[STIX]{x1D6FF}_{2,i}w}{\displaystyle \mathop{\sum }_{n=1}^{\infty }A_{n,i}\text{EXP}(n,t,i)\text{INTEIGEN}(n,i)},\end{eqnarray}$$
where
 $$\begin{eqnarray}\text{INTEIGEN}(n,i)=\unicode[STIX]{x1D6FF}_{1,i}(\sin \unicode[STIX]{x1D706}_{n}/\unicode[STIX]{x1D706}_{n})+\unicode[STIX]{x1D6FF}_{2,i}(\sin \unicode[STIX]{x1D706}_{rn}/\unicode[STIX]{x1D706}_{rn})[\sin (\unicode[STIX]{x1D6FE}_{sn}w)/\unicode[STIX]{x1D6FE}_{sn}].\end{eqnarray}$$
So the function  $f_{0,i}$ is obtained as
 $$\begin{eqnarray}f_{0,i}(x,y,t)=\frac{\displaystyle (\unicode[STIX]{x1D6FF}_{1,i}+\unicode[STIX]{x1D6FF}_{2,i}w)\mathop{\sum }_{n=0}^{\infty }A_{n,i}\text{EXP}(n,t,i)\text{COS}(n,x,y,i)}{\displaystyle \mathop{\sum }_{n=1}^{\infty }A_{n,i}\text{EXP}(n,t,i)\text{INTEIGEN}(n,i)}.\end{eqnarray}$$
The exchange coefficient can now be determined from (2.54) and (2.55) for  $n=0$ as
 $$\begin{eqnarray}K_{0,i}(t)=-\frac{\displaystyle Da\mathop{\sum }_{n=0}^{\infty }A_{n,i}\text{EXP}(n,t,i)\mathbb{F}(n,i)}{\displaystyle \mathop{\sum }_{n=0}^{\infty }A_{n,i}\text{EXP}(n,t,i)\text{INTEIGEN}(n,i)},\end{eqnarray}$$
where
 $$\begin{eqnarray}\mathbb{F}(n,i)=\unicode[STIX]{x1D6FF}_{1,i}\cos \unicode[STIX]{x1D706}_{n}+\unicode[STIX]{x1D6FF}_{2,i}\left[\frac{\sin \unicode[STIX]{x1D706}_{rn}\cos (\unicode[STIX]{x1D6FE}_{sn}w)}{\unicode[STIX]{x1D706}_{rn}}+\frac{\sin (\unicode[STIX]{x1D6FE}_{sn}w)\cos \unicode[STIX]{x1D706}_{rn}}{\unicode[STIX]{x1D6FE}_{sn}}\right].\end{eqnarray}$$
2.4.2 Convection coefficient
The equation governing the function  $f_{1}$ can be derived from (2.57) and (2.58) by setting
 $n=1$ as
 $$\begin{eqnarray}\displaystyle & \displaystyle \frac{\unicode[STIX]{x2202}f_{1,1}}{\unicode[STIX]{x2202}t}=\frac{\unicode[STIX]{x2202}^{2}f_{1,1}}{\unicode[STIX]{x2202}y^{2}}-f_{0,1}(u_{1}+K_{1,1})-f_{1,1}K_{0,1}, & \displaystyle\end{eqnarray}$$
 $$\begin{eqnarray}\displaystyle & \displaystyle \frac{\unicode[STIX]{x2202}f_{1,2}}{\unicode[STIX]{x2202}t}=\frac{\unicode[STIX]{x2202}^{2}f_{1,2}}{\unicode[STIX]{x2202}x^{2}}+\frac{\unicode[STIX]{x2202}^{2}f_{1,2}}{\unicode[STIX]{x2202}y^{2}}-f_{0,2}(u_{2}+K_{1,2})-f_{1,2}K_{0,2}. & \displaystyle\end{eqnarray}$$
The associated initial and boundary conditions are obtained by setting  $n=1$ in (2.59) and (2.60). The solution for
 $f_{1}$ satisfying the initial and boundary conditions can be determined as below
 $$\begin{eqnarray}\displaystyle f_{1,i} & = & \displaystyle -\exp \left[-\int _{0}^{t}K_{0,i}(s)\,\text{d}s\right]\mathop{\sum }_{p=0}^{\infty }\left\{\mathop{\sum }_{n=0}^{\infty }\left[\frac{A_{n,i}\text{INTU}2(n,p)}{\text{INTCOS}(p,i)}\text{INTEXP}(n,p,t)\right]\right.\nonumber\\ \displaystyle & & \displaystyle +\left.A_{p,i}\text{EXP}(p,t,i)\int _{0}^{t}K_{1,i}(s)\,\text{d}s\right\}\text{COS}(p,x,y,i),\end{eqnarray}$$
where
 $$\begin{eqnarray}\displaystyle & \displaystyle \text{INTU}2(n,p)=\unicode[STIX]{x1D6FF}_{1,i}\text{IntU}2\_1(n,p)+\unicode[STIX]{x1D6FF}_{2,i}\text{IntU}2\_2(n,p), & \displaystyle\end{eqnarray}$$
 $$\begin{eqnarray}\displaystyle & \displaystyle \text{IntU}2\_1(n,p)=\int _{0}^{1}u_{1}\cos (\unicode[STIX]{x1D706}_{n}y)\cos (\unicode[STIX]{x1D706}_{p}y)\,\text{d}y, & \displaystyle\end{eqnarray}$$
 $$\begin{eqnarray}\displaystyle \text{IntU}2\_2(n,p) & = & \displaystyle \int _{0}^{w}\int _{0}^{1}u_{2}\cos (\unicode[STIX]{x1D6FE}_{sn}x)\cos (\unicode[STIX]{x1D6FE}_{sp}x)\cos (\unicode[STIX]{x1D706}_{rn}y)\cos (\unicode[STIX]{x1D706}_{rp}y)\,\text{d}y\,\text{d}x\nonumber\\ \displaystyle & = & \displaystyle \mathop{\sum }_{j=1}^{N}d_{j}\frac{(-1)^{r_{j}+q_{j}}}{16}\left[\frac{\cos (\unicode[STIX]{x1D706}_{rn}+\unicode[STIX]{x1D706}_{rp})}{\unicode[STIX]{x1D709}_{r_{j}}-\unicode[STIX]{x1D706}_{rn}-\unicode[STIX]{x1D706}_{rp}}+\frac{\cos (\unicode[STIX]{x1D706}_{rn}-\unicode[STIX]{x1D706}_{rp})}{\unicode[STIX]{x1D709}_{r_{j}}-\unicode[STIX]{x1D706}_{rn}+\unicode[STIX]{x1D706}_{rp}}+\frac{\cos (\unicode[STIX]{x1D706}_{rn}-\unicode[STIX]{x1D706}_{rp})}{\unicode[STIX]{x1D709}_{r_{j}}+\unicode[STIX]{x1D706}_{rn}-\unicode[STIX]{x1D706}_{rp}}\right.\nonumber\\ \displaystyle & & \displaystyle +\left.\frac{\cos (\unicode[STIX]{x1D706}_{rn}+\unicode[STIX]{x1D706}_{rp})}{\unicode[STIX]{x1D709}_{r_{j}}+\unicode[STIX]{x1D706}_{rn}+\unicode[STIX]{x1D706}_{rp}}\right]\left\{\frac{\cos [w(\unicode[STIX]{x1D6FE}_{sn}+\unicode[STIX]{x1D6FE}_{sp})]}{\unicode[STIX]{x1D709}_{q_{j}}-\unicode[STIX]{x1D6FE}_{sn}-\unicode[STIX]{x1D6FE}_{sp}}+\frac{\cos [w(\unicode[STIX]{x1D6FE}_{sn}-\unicode[STIX]{x1D6FE}_{sp})]}{\unicode[STIX]{x1D709}_{q_{j}}-\unicode[STIX]{x1D6FE}_{sn}+\unicode[STIX]{x1D6FE}_{sp}}\right.\nonumber\\ \displaystyle & & \displaystyle +\left.\frac{\cos [w(\unicode[STIX]{x1D6FE}_{sn}-\unicode[STIX]{x1D6FE}_{sp})]}{\unicode[STIX]{x1D709}_{q_{j}}+\unicode[STIX]{x1D6FE}_{sn}-\unicode[STIX]{x1D6FE}_{sp}}+\frac{\cos [w(\unicode[STIX]{x1D6FE}_{sn}+\unicode[STIX]{x1D6FE}_{sp})]}{\unicode[STIX]{x1D709}_{q_{j}}+\unicode[STIX]{x1D6FE}_{sn}+\unicode[STIX]{x1D6FE}_{sp}}\right\},\end{eqnarray}$$
 $$\begin{eqnarray}\displaystyle & \displaystyle \text{INTEXP}(n,p,t)=\unicode[STIX]{x1D6FF}_{1,i}\text{Intexp}\_1(n,p,t)+\unicode[STIX]{x1D6FF}_{2,i}\text{Intexp}\_2(n,p,t), & \displaystyle\end{eqnarray}$$
 $$\begin{eqnarray}\displaystyle & \displaystyle \text{Intexp}\_1(n,p,t)=(1-\unicode[STIX]{x1D6FF}_{n,p})\frac{\exp (-\unicode[STIX]{x1D706}_{n}^{2}t)-\exp (-\unicode[STIX]{x1D706}_{p}^{2}t)}{\unicode[STIX]{x1D706}_{p}^{2}-\unicode[STIX]{x1D706}_{n}^{2}}+\unicode[STIX]{x1D6FF}_{n,p}t\exp (-\unicode[STIX]{x1D706}_{n}^{2}t), & \displaystyle\end{eqnarray}$$
 $$\begin{eqnarray}\displaystyle \text{Intexp}\_2(n,p,t) & = & \displaystyle (1-\unicode[STIX]{x1D6FF}_{n,p})\frac{\exp [-(\unicode[STIX]{x1D706}_{rn}^{2}+\unicode[STIX]{x1D6FE}_{sn}^{2})t]-\exp [-(\unicode[STIX]{x1D706}_{rp}^{2}+\unicode[STIX]{x1D6FE}_{sp}^{2})t]}{\unicode[STIX]{x1D706}_{rp}^{2}-\unicode[STIX]{x1D706}_{rn}^{2}+\unicode[STIX]{x1D6FE}_{sp}^{2}-\unicode[STIX]{x1D6FE}_{sn}^{2}}\nonumber\\ \displaystyle & & \displaystyle +\,\unicode[STIX]{x1D6FF}_{n,p}t\exp [-(\unicode[STIX]{x1D706}_{rn}^{2}+\unicode[STIX]{x1D6FE}_{sn}^{2})t].\end{eqnarray}$$
The term  $\int _{0}^{t}K_{1}(s)\,\text{d}s$ can be found, by applying the integral conditions in (2.61) and (2.62), as
 $$\begin{eqnarray}\int _{0}^{t}K_{1,i}(s)\,\text{d}s=-\frac{\displaystyle \mathop{\sum }_{p=0}^{\infty }\left[\mathop{\sum }_{n=0}^{\infty }\frac{A_{n,i}\text{INTU}2(n,p)}{\text{INTCOS}(p)}\text{INTEXP}(n,p,t)\right]\text{INTEIGEN}(p,i)}{\displaystyle \mathop{\sum }_{p=0}^{\infty }A_{p,i}\text{EXP}(p,t,i)\text{INTEIGEN}(p,i)}.\end{eqnarray}$$
It is now time to derive the expression of the convection coefficient that is obtained from (2.54) and (2.55) as
 $$\begin{eqnarray}\displaystyle & & \displaystyle K_{1,i}(t)\nonumber\\ \displaystyle & & \displaystyle \quad =\frac{Da}{\unicode[STIX]{x1D6FF}_{2,i}w+\unicode[STIX]{x1D6FF}_{1,i}}\exp \left[-\int _{0}^{t}K_{0i}(s)\,\text{d}s\right]\mathop{\sum }_{p=0}^{\infty }\left\{\mathop{\sum }_{n=0}^{\infty }\left[\frac{A_{ni}\text{INTU}2(n,p)}{\text{INTCOS}(p)}\text{INTEXP}(n,p,t)\right]\right.\nonumber\\ \displaystyle & & \displaystyle \quad +\left.A_{p,i}\text{EXP}(p,t,i)\int _{0}^{t}K_{1,i}(s)\,\text{d}s\right\}\mathbb{F}(p,i)\nonumber\\ \displaystyle & & \displaystyle \quad -\,\frac{\displaystyle \exp \left[-\int _{0}^{t}K_{0,i}(s)\,\text{d}s\right]}{\unicode[STIX]{x1D6FF}_{2,i}w+\unicode[STIX]{x1D6FF}_{1,i}}\mathop{\sum }_{n=0}^{\infty }A_{n,i}\text{EXP}(n,t,i)\text{INTU}1(n,i),\end{eqnarray}$$
where
 $$\begin{eqnarray}\text{INTU}1(n,i)=\unicode[STIX]{x1D6FF}_{1,i}\text{IntU}1\_1(n)+\unicode[STIX]{x1D6FF}_{2,i}\text{IntU}1\_2(n),\end{eqnarray}$$
 $$\begin{eqnarray}\displaystyle \text{IntU}1\_2(n) & = & \displaystyle \int _{0}^{w}\int _{0}^{1}u_{2}\cos (\unicode[STIX]{x1D6FE}_{sn}x)\cos (\unicode[STIX]{x1D706}_{rn}y)\,\text{d}y\,\text{d}x\nonumber\\ \displaystyle & = & \displaystyle \mathop{\sum }_{j=1}^{N}d_{j}\frac{(-1)^{r_{j}+q_{j}}\unicode[STIX]{x1D709}_{r_{j}}\unicode[STIX]{x1D709}_{q_{j}}\cos \unicode[STIX]{x1D706}_{rn}\cos (\unicode[STIX]{x1D6FE}_{sn}w)}{(\unicode[STIX]{x1D709}_{r_{j}}^{2}-\unicode[STIX]{x1D706}_{rn}^{2})(\unicode[STIX]{x1D709}_{q_{j}}^{2}-\unicode[STIX]{x1D6FE}_{sn}^{2}w^{2})},\end{eqnarray}$$
 $$\begin{eqnarray}\displaystyle & & \displaystyle \text{IntU}1\_1(n)=\int _{0}^{1}u_{1}\cos (\unicode[STIX]{x1D706}_{n}y)\,\text{d}y=\int _{1-l}^{1}u_{PEL}\cos (\unicode[STIX]{x1D706}_{n}y)\,\text{d}y+\int _{0}^{1-l}u_{E}\cos (\unicode[STIX]{x1D706}_{n}y)\,\text{d}y\nonumber\\ \displaystyle & & \displaystyle \quad =\frac{B_{2}}{\unicode[STIX]{x1D6FC}^{2}+\unicode[STIX]{x1D706}_{n}^{2}}\{\!\unicode[STIX]{x1D706}_{n}\sin [\unicode[STIX]{x1D706}_{n}(l-1)]\cosh [\unicode[STIX]{x1D6FC}(l-1)]+\unicode[STIX]{x1D6FC}\cos [\unicode[STIX]{x1D706}_{n}(l-1)]\sinh [\unicode[STIX]{x1D6FC}(l-1)]\nonumber\\ \displaystyle & & \displaystyle \qquad +\,\unicode[STIX]{x1D706}_{n}\sin \unicode[STIX]{x1D706}_{n}\cosh \unicode[STIX]{x1D6FC}+\unicode[STIX]{x1D6FC}\cos \unicode[STIX]{x1D706}_{n}\sinh \unicode[STIX]{x1D6FC}\!\}\nonumber\\ \displaystyle & & \displaystyle \qquad +\,\frac{\displaystyle \left(B_{2}\coth \unicode[STIX]{x1D6FC}-\frac{1}{\sinh \unicode[STIX]{x1D6FC}}\left[(\cosh K)^{-1}\left(\frac{K^{2}B_{1}}{K^{2}-\unicode[STIX]{x1D6FC}^{2}}\right)-\frac{K^{2}}{\unicode[STIX]{x1D6FC}^{2}\unicode[STIX]{x1D702}_{\unicode[STIX]{x1D706}}^{2}}\right]\right)}{\unicode[STIX]{x1D6FC}^{2}+\unicode[STIX]{x1D706}_{n}^{2}}\nonumber\\ \displaystyle & & \displaystyle \qquad \times \,\{\!\unicode[STIX]{x1D6FC}\cos [\unicode[STIX]{x1D706}_{n}(l-1)]\cosh [\unicode[STIX]{x1D6FC}(l-1)]\nonumber\\ \displaystyle & & \displaystyle \qquad +\,\unicode[STIX]{x1D706}_{n}\sin [\unicode[STIX]{x1D706}_{n}(l-1)]\sinh [\unicode[STIX]{x1D6FC}(l-1)]-\unicode[STIX]{x1D6FC}\cos \unicode[STIX]{x1D706}_{n}\cosh \unicode[STIX]{x1D6FC}-\unicode[STIX]{x1D706}_{n}\sin \unicode[STIX]{x1D706}_{n}\sinh \unicode[STIX]{x1D6FC}\!\}\nonumber\\ \displaystyle & & \displaystyle \qquad -\,\frac{K^{2}B_{1}}{(K^{2}-\unicode[STIX]{x1D6FC}^{2})(K^{2}+\unicode[STIX]{x1D706}_{n}^{2})}\{\!\unicode[STIX]{x1D706}_{n}\sin [\unicode[STIX]{x1D706}_{n}(l-1)]\cosh [K(l-1)]\nonumber\\ \displaystyle & & \displaystyle \qquad +\,K\cos [\unicode[STIX]{x1D706}_{n}(l-1)]\sinh [K(l-1)]+\unicode[STIX]{x1D706}_{n}\sin \unicode[STIX]{x1D706}_{n}\cosh K+K\cos \unicode[STIX]{x1D706}_{n}\sinh K\!\}\nonumber\\ \displaystyle & & \displaystyle \qquad -\,\left(\frac{\tanh K}{\unicode[STIX]{x1D6FC}^{2}+\unicode[STIX]{x1D706}_{n}^{2}}\right)\left(\frac{K^{2}B_{1}}{K^{2}-\unicode[STIX]{x1D6FC}^{2}}\right)\{\!K\cos [\unicode[STIX]{x1D706}_{n}(l-1)]\cosh [K(l-1)]\nonumber\\ \displaystyle & & \displaystyle \qquad +\,\unicode[STIX]{x1D706}_{n}\sin [\unicode[STIX]{x1D706}_{n}(l-1)]\sinh [K(l-1)]-K\cos \unicode[STIX]{x1D706}_{n}\cosh K-\unicode[STIX]{x1D706}_{n}\sin \unicode[STIX]{x1D706}_{n}\sinh K\!\}\nonumber\\ \displaystyle & & \displaystyle \qquad +\,\frac{K^{2}}{\unicode[STIX]{x1D706}_{n}\unicode[STIX]{x1D6FC}^{2}\unicode[STIX]{x1D702}_{\unicode[STIX]{x1D706}}^{2}}\{\sin [\unicode[STIX]{x1D706}_{n}(l-1)]+\sin \unicode[STIX]{x1D706}_{n}\}\nonumber\\ \displaystyle & & \displaystyle \qquad +\,\frac{1}{\unicode[STIX]{x1D706}_{n}(K^{2}+\unicode[STIX]{x1D706}_{n}^{2})}\{\!\unicode[STIX]{x1D706}_{n}^{2}A_{1}\sin [\unicode[STIX]{x1D706}_{n}(l-1)]\cosh [K(l-1)]\nonumber\\ \displaystyle & & \displaystyle \qquad +\,A_{1}K\unicode[STIX]{x1D706}_{n}\cos [\unicode[STIX]{x1D706}_{n}(l-1)]\sinh [K(l-1)]-A_{2}K^{2}\sin [\unicode[STIX]{x1D706}_{n}(l-1)]\nonumber\\ \displaystyle & & \displaystyle \qquad -\,\unicode[STIX]{x1D706}_{n}^{2}A_{2}\sin [\unicode[STIX]{x1D706}_{n}(l-1)]\!\}.\end{eqnarray}$$
2.4.3 Dispersion coefficient
Setting  $n=2$ in (2.57) and (2.58), the equations governing
 $f_{2}$ are derived as below
 $$\begin{eqnarray}\displaystyle & \displaystyle \frac{\unicode[STIX]{x2202}f_{2,2}}{\unicode[STIX]{x2202}t}=\frac{\unicode[STIX]{x2202}^{2}f_{2,2}}{\unicode[STIX]{x2202}x^{2}}+\frac{\unicode[STIX]{x2202}^{2}f_{2,2}}{\unicode[STIX]{x2202}y^{2}}-f_{2,2}K_{0,2}-f_{1,2}(u_{2}+K_{1,2})+\left[\frac{1}{Pe^{2}}-K_{2,2}(t)\right]f_{0,2}, & \displaystyle\end{eqnarray}$$
 $$\begin{eqnarray}\displaystyle & \displaystyle \frac{\unicode[STIX]{x2202}f_{2,1}}{\unicode[STIX]{x2202}t}=\frac{\unicode[STIX]{x2202}^{2}f_{2,1}}{\unicode[STIX]{x2202}y^{2}}-f_{2,1}K_{0,1}-f_{1,1}(u_{1}+K_{1,1})+\left[\frac{1}{Pe^{2}}-K_{2,1}(t)\right]f_{0,1}, & \displaystyle\end{eqnarray}$$
which are to be solved subject to initial and boundary conditions given by (2.59) and (2.60) for  $n=2$. Using the method of eigenfunction expansion, the solution for
 $f_{2}$ satisfying the initial and boundary conditions can be obtained as
 $$\begin{eqnarray}\displaystyle f_{2,i} & = & \displaystyle -\exp \left[-\int _{0}^{t}K_{0,i}(s)\,\text{d}s\right]\left\{\mathop{\sum }_{q=0}^{\infty }\text{EXP}(q,t,i)\right.\nonumber\\ \displaystyle & & \displaystyle \times \,\left\{\int _{0}^{t}\frac{\text{d}s}{\text{EXP}(q,s,i)}\exp \left[\int _{0}^{s}K_{0,i}(s^{\prime })\,\text{d}s^{\prime }\right][X_{q,i}^{1}(s)+X_{q,i}^{2}(s)]\right.\nonumber\\ \displaystyle & & \displaystyle -\left.\left.A_{q,i}\int _{0}^{t}\left[\frac{1}{Pe^{2}}-K_{2,i}(s)\right]\,\text{d}s\right\}\text{COS}(q,x,y,i)\right\},\end{eqnarray}$$
where
 $$\begin{eqnarray}\displaystyle X_{q,i}^{1}(t) & = & \displaystyle -\exp \left[-\int _{0}^{t}K_{0,i}(s)\,\text{d}s\right][\text{INTCOS}(q)]^{-1}\nonumber\\ \displaystyle & & \displaystyle \times \,\mathop{\sum }_{p=0}^{\infty }\left\{\mathop{\sum }_{n=0}^{\infty }\left[\frac{A_{n,i}\text{INTU}2(n,p)}{\text{INTCOS}(p)}\text{INTEXP}(n,p,t)\right]\right.\nonumber\\ \displaystyle & & \displaystyle +\left.A_{p,i}\text{EXP}(p,t,i)\int _{0}^{t}K_{1,i}(s)\,\text{d}s\right\}\text{INTU}2(p,q),\end{eqnarray}$$
 $$\begin{eqnarray}\displaystyle X_{q,i}^{2}(t) & = & \displaystyle -K_{1,i}(t)\exp \left[-\int _{0}^{t}K_{0,i}(s)\,\text{d}s\right]\left\{\mathop{\sum }_{n=0}^{\infty }\left[\frac{A_{n,i}\text{INTU}2(n,q)}{\text{INTCOS}(q)}\text{INTEXP}(n,q,t)\right]\right.\nonumber\\ \displaystyle & & \displaystyle +\left.A_{q,i}\text{EXP}(q,t,i)\int _{0}^{t}K_{1,i}(s)\,\text{d}s\right\}.\end{eqnarray}$$
And from the integral conditions, equations (2.61) and (2.62), we will have
 $$\begin{eqnarray}\displaystyle & & \displaystyle \int _{0}^{t}\left[\frac{1}{Pe^{2}}-K_{2i}(s)\right]\,\text{d}s\nonumber\\ \displaystyle & & \displaystyle \quad =\left[\mathop{\sum }_{q=0}^{\infty }A_{q,i}\text{EXP}(q,t,i)\text{INTEIGEN}(q,i)\right]^{-1}\mathop{\sum }_{q=0}^{\infty }\text{EXP}(q,t,i)\nonumber\\ \displaystyle & & \displaystyle \qquad \times \,\left\{\int _{0}^{t}\frac{1}{\text{EXP}(q,s,i)}\exp \left[\int _{0}^{s}K_{0i}(s^{\prime })\,\text{d}s^{\prime }\right](X_{q,i}^{1}+X_{q,i}^{2})\right\}\text{INTEIGEN}(q,i).\qquad \quad\end{eqnarray}$$
So the dispersion coefficient can be derived via equations (2.54) and (2.55) as
 $$\begin{eqnarray}\displaystyle & & \displaystyle K_{2,i}(t)=\frac{1}{Pe^{2}}+\frac{Da}{\unicode[STIX]{x1D6FF}_{2,i}w+\unicode[STIX]{x1D6FF}_{1,i}}\exp \left[-\int _{0}^{t}K_{0i}(s)\,\text{d}s\right]\nonumber\\ \displaystyle & & \displaystyle \quad \times \,\left\{\mathop{\sum }_{q=0}^{\infty }\text{EXP}(q,t,i)\left\{\int _{0}^{t}\frac{1}{\text{EXP}(q,s,i)}\exp \left[\int _{0}^{s}K_{0i}(s^{\prime })\,\text{d}s^{\prime }\right](X_{q,i}^{1}+X_{q,i}^{2})\right.\right.\nonumber\\ \displaystyle & & \displaystyle \quad -\left.\left.A_{q,i}\int _{0}^{t}\left[\frac{1}{Pe^{2}}-K_{2,i}(s)\right]\,\text{d}s\right\}\mathbb{F}(q,i)\right\}\nonumber\\ \displaystyle & & \displaystyle \quad +\,\frac{1}{\unicode[STIX]{x1D6FF}_{2,i}w+\unicode[STIX]{x1D6FF}_{1,i}}\exp \left[-\int _{0}^{t}K_{0,i}(s)\,\text{d}s\right]\mathop{\sum }_{p=0}^{\infty }\left\{\mathop{\sum }_{n=0}^{\infty }\left[\frac{A_{ni}\text{INTU}2(n,p)}{\text{INTCOS}(p)}\text{INTEXP}(n,p,t)\right]\right.\nonumber\\ \displaystyle & & \displaystyle \quad +\left.A_{p,i}\text{EXP}(p,t,i)\int _{0}^{t}K_{1,i}(s)\,\text{d}s\right\}\text{INTU}1(p,i).\end{eqnarray}$$
2.4.4 Solute concentration expression
The solution of (2.56) satisfying the associated initial and boundary conditions, derived via the cross-sectional averaging of (2.44a), (2.46a), (2.44d) and (2.46d), is obtained by the Fourier transform method as
 $$\begin{eqnarray}c_{m,i}(t,z)=\frac{\unicode[STIX]{x1D703}_{m,i}}{2Pe(\unicode[STIX]{x03C0}\unicode[STIX]{x1D709})^{1/2}}\exp \left(\unicode[STIX]{x1D70D}-\frac{z_{1}^{2}}{4\unicode[STIX]{x1D709}}\right),\end{eqnarray}$$
where
 $$\begin{eqnarray}\displaystyle & \displaystyle \unicode[STIX]{x1D70D}(t)=\int _{0}^{t}K_{0,i}(\unicode[STIX]{x1D702})\,\text{d}\unicode[STIX]{x1D702},\quad i=1,2, & \displaystyle\end{eqnarray}$$
 $$\begin{eqnarray}\displaystyle & \displaystyle z_{1}(t,z)=z+\int _{0}^{t}K_{1,i}(\unicode[STIX]{x1D702})\,\text{d}\unicode[STIX]{x1D702},\quad i=1,2, & \displaystyle\end{eqnarray}$$
 $$\begin{eqnarray}\displaystyle & \displaystyle \unicode[STIX]{x1D709}(t)=\int _{0}^{t}K_{2,i}(\unicode[STIX]{x1D702})\,\text{d}\unicode[STIX]{x1D702},\quad i=1,2. & \displaystyle\end{eqnarray}$$
As soon as the mean concentration is obtained, the local distribution of solutes can be found using (2.47) and (2.48). Performing the required manipulations, one obtains
 $$\begin{eqnarray}c_{i}=\frac{\unicode[STIX]{x1D703}_{m,i}}{2Pe(\unicode[STIX]{x03C0}\unicode[STIX]{x1D709})^{1/2}}\exp \left(\unicode[STIX]{x1D70D}-\frac{z_{1}^{2}}{4\unicode[STIX]{x1D709}}\right)\left[f_{0,i}-\frac{z_{1}}{2\unicode[STIX]{x1D709}}f_{1,i}+f_{2,i}\left(\frac{-1}{2\unicode[STIX]{x1D709}}+\frac{z_{1}^{2}}{4\unicode[STIX]{x1D709}^{2}}\right)\right].\end{eqnarray}$$
2.4.5 Special solutions for $Da=0$

In this section, special solutions are derived for the case where no reaction occurs at the wall. In the absence of reaction, the wall boundary conditions modify as
 $$\begin{eqnarray}\displaystyle & \displaystyle \left.\frac{\unicode[STIX]{x2202}c_{1}}{\unicode[STIX]{x2202}y}\right|_{y=1}=0, & \displaystyle\end{eqnarray}$$
 $$\begin{eqnarray}\displaystyle & \displaystyle \left.\frac{\unicode[STIX]{x2202}c_{2}}{\unicode[STIX]{x2202}y}\right|_{y=1}=\left.\frac{\unicode[STIX]{x2202}c_{2}}{\unicode[STIX]{x2202}x}\right|_{x=w}=0. & \displaystyle\end{eqnarray}$$
Furthermore, as the exchange coefficient is now zero, equations (2.54) to (2.58) are simplified to yield
 $$\begin{eqnarray}\displaystyle & \displaystyle \frac{\unicode[STIX]{x2202}c_{m,i}}{\unicode[STIX]{x2202}t}=K_{1,i}(t)\frac{\unicode[STIX]{x2202}c_{m,i}}{\unicode[STIX]{x2202}z}+K_{2,i}(t)\frac{\unicode[STIX]{x2202}^{2}c_{m,i}}{\unicode[STIX]{x2202}z^{2}}, & \displaystyle\end{eqnarray}$$
 $$\begin{eqnarray}\displaystyle & \displaystyle K_{n,1}(t)=\frac{\unicode[STIX]{x1D6FF}_{n2}}{Pe^{2}}-\int _{0}^{1}u_{1}(y)f_{n-1,1}\,\text{d}y,\quad n=1,2, & \displaystyle\end{eqnarray}$$
 $$\begin{eqnarray}\displaystyle & \displaystyle K_{n,2}(t)=\frac{\unicode[STIX]{x1D6FF}_{n2}}{Pe^{2}}-\frac{1}{w}\int _{0}^{1}\int _{0}^{w}u_{2}(x,y)f_{n-1,2}\,\text{d}x\,\text{d}y,\quad n=1,2, & \displaystyle\end{eqnarray}$$
 $$\begin{eqnarray}\displaystyle & \displaystyle \frac{\unicode[STIX]{x2202}f_{n,1}}{\unicode[STIX]{x2202}t}=\frac{\unicode[STIX]{x2202}^{2}f_{n,1}}{\unicode[STIX]{x2202}y^{2}}+\frac{f_{n-2,1}}{Pe^{2}}-uf_{n-1,1}-\mathop{\sum }_{i=1}^{\infty }f_{n-i,1}K_{i,1}(t), & \displaystyle\end{eqnarray}$$
 $$\begin{eqnarray}\displaystyle & \displaystyle \frac{\unicode[STIX]{x2202}f_{n,2}}{\unicode[STIX]{x2202}t}=\frac{\unicode[STIX]{x2202}^{2}f_{n,2}}{\unicode[STIX]{x2202}x^{2}}+\frac{\unicode[STIX]{x2202}^{2}f_{n,2}}{\unicode[STIX]{x2202}y^{2}}+\frac{f_{n-2,2}}{Pe^{2}}-uf_{n-1,2}-\mathop{\sum }_{i=1}^{\infty }f_{n-i,2}K_{i,2}(t). & \displaystyle\end{eqnarray}$$
The wall boundary conditions associated with  $f_{n}$ will also modify as
 $$\begin{eqnarray}\displaystyle & \displaystyle \left.\frac{\unicode[STIX]{x2202}f_{n,1}}{\unicode[STIX]{x2202}y}\right|_{y=1}=0, & \displaystyle\end{eqnarray}$$
 $$\begin{eqnarray}\displaystyle & \displaystyle \left.\frac{\unicode[STIX]{x2202}f_{n,2}}{\unicode[STIX]{x2202}x}\right|_{x=w}=\left.\frac{\unicode[STIX]{x2202}f_{n,2}}{\unicode[STIX]{x2202}y}\right|_{y=1}=0. & \displaystyle\end{eqnarray}$$
The solution for  $f_{0}$ can now be expressed as
 $$\begin{eqnarray}f_{0,i}(x,y,t)=\mathop{\sum }_{n=0}^{\infty }A_{n,i}\text{EXP}(n,t,i)\text{COS}(n,x,y,i),\end{eqnarray}$$
where
 $$\begin{eqnarray}\displaystyle & \displaystyle \text{EXP}(n,t,i)=\unicode[STIX]{x1D6FF}_{1,i}\exp (-n^{2}\unicode[STIX]{x03C0}^{2}t)+\unicode[STIX]{x1D6FF}_{2,i}\exp \left[-\unicode[STIX]{x03C0}^{2}\left(r_{n}^{2}+\frac{s_{n}^{2}}{w^{2}}\right)t\right], & \displaystyle\end{eqnarray}$$
 $$\begin{eqnarray}\displaystyle & \displaystyle \text{COS}(n,x,y,i)=\unicode[STIX]{x1D6FF}_{1,i}\cos (\unicode[STIX]{x03C0}ny)+\unicode[STIX]{x1D6FF}_{2,i}\cos (\unicode[STIX]{x03C0}r_{n}y)\cos \left(\frac{\unicode[STIX]{x03C0}s_{n}}{w}x\right), & \displaystyle\end{eqnarray}$$
 $$\begin{eqnarray}\displaystyle & \displaystyle A_{n,i}=\frac{\displaystyle \int _{0}^{1}\left[\unicode[STIX]{x1D703}\unicode[STIX]{x1D6FF}_{1,i}\text{COS}(n,x,y,1)+\unicode[STIX]{x1D6FF}_{2,i}\int _{0}^{w}\unicode[STIX]{x1D703}\text{COS}(n,x,y,2)\,\text{d}x\right]\,\text{d}y}{\unicode[STIX]{x1D703}_{m,i}\text{INTCOS}(n,i)}, & \displaystyle\end{eqnarray}$$
with  $r_{n}=0,1,2,\ldots ,s_{n}=0,1,2,\ldots$ , and
 $$\begin{eqnarray}\text{INTCOS}(n,i)=\unicode[STIX]{x1D6FF}_{1,i}\text{Intcos}\_1(n)+\unicode[STIX]{x1D6FF}_{2,i}\text{Intcos}\_2(n),\end{eqnarray}$$
 $$\begin{eqnarray}\displaystyle \text{Intcos}\_2(n) & = & \displaystyle \int _{0}^{w}\int _{0}^{1}\cos ^{2}(\unicode[STIX]{x03C0}r_{n}y)\cos ^{2}\left(\frac{\unicode[STIX]{x03C0}s_{n}}{w}x\right)\,\text{d}y\,\text{d}x\nonumber\\ \displaystyle & = & \displaystyle w\unicode[STIX]{x1D6FF}_{0,r_{n}+s_{n}}+\frac{w(\unicode[STIX]{x1D6FF}_{0,s_{n}})(1-\unicode[STIX]{x1D6FF}_{0,r_{n}})}{2}+\frac{w(\unicode[STIX]{x1D6FF}_{0,r_{n}})(1-\unicode[STIX]{x1D6FF}_{0,s_{n}})}{2}\nonumber\\ \displaystyle & & \displaystyle +\,\frac{w(1-\unicode[STIX]{x1D6FF}_{0,r_{n}+s_{n}})(1-\unicode[STIX]{x1D6FF}_{0,r_{n}})(1-\unicode[STIX]{x1D6FF}_{0,s_{n}})}{4},\end{eqnarray}$$
 $$\begin{eqnarray}\text{Intcos}\_1(n)=\int _{0}^{1}\cos ^{2}(n\unicode[STIX]{x03C0}y)\,\text{d}y=\unicode[STIX]{x1D6FF}_{0,n}+\frac{1-\unicode[STIX]{x1D6FF}_{0,n}}{2}.\end{eqnarray}$$
For the special case where the source is uniformly distributed over the entire channel cross-section,  $A_{n,i}=0$ for
 $n\neq 0$; accordingly, the function
 $f_{0,i}$ possesses the following simple solution:
 $$\begin{eqnarray}f_{0,i}=1.\end{eqnarray}$$
As soon as  $f_{0}$ is evaluated, the convection coefficient can be found as
 $$\begin{eqnarray}K_{1,1}(t)=-\int _{0}^{1}u_{1}(y)f_{0}(y,t)\,\text{d}y=-\mathop{\sum }_{n=0}^{\infty }A_{n}\text{IntU}1\_1(n)\exp (-n^{2}\unicode[STIX]{x03C0}^{2}t),\end{eqnarray}$$
 $$\begin{eqnarray}\displaystyle K_{1,2}(t) & = & \displaystyle -\frac{1}{w}\int _{0}^{1}\int _{0}^{w}u_{2}(x,y)f_{0}(x,y,t)\,\text{d}x\,\text{d}y\nonumber\\ \displaystyle & = & \displaystyle -\mathop{\sum }_{n=0}^{\infty }\frac{A_{n}}{w}\text{IntU}1\_2(n)\exp \left[-\unicode[STIX]{x03C0}^{2}\left(r_{n}^{2}+\frac{s_{n}^{2}}{w^{2}}\right)t\right],\end{eqnarray}$$
where
 $$\begin{eqnarray}\displaystyle & & \displaystyle \text{IntU}1\_1(n)=\int _{0}^{1}u_{1}\cos (\unicode[STIX]{x03C0}ny)\,\text{d}y\nonumber\\ \displaystyle & & \displaystyle \quad =-b_{E1}\mathbb{G}_{1}(n,K)+b_{E2}(1-\unicode[STIX]{x1D701})\unicode[STIX]{x1D6FF}_{n,0}-b_{E2}\frac{(-1)^{n}\sin (n\unicode[STIX]{x03C0}\unicode[STIX]{x1D701})}{n\unicode[STIX]{x03C0}}(1-\unicode[STIX]{x1D6FF}_{n,0})+b_{1}^{\prime }\mathbb{G}_{2}(n,\unicode[STIX]{x1D6FC})\nonumber\\ \displaystyle & & \displaystyle \qquad +\,b_{2}^{\prime }\mathbb{G}_{3}(n,\unicode[STIX]{x1D6FC})+b_{3}^{\prime }\mathbb{G}_{2}(n,K)+b_{4}^{\prime }\mathbb{G}_{3}(n,K)+b_{5}^{\prime }\nonumber\\ \displaystyle & & \displaystyle \qquad \times \,\left[\unicode[STIX]{x1D701}\unicode[STIX]{x1D6FF}_{n,0}+\frac{(-1)^{n}\sin (n\unicode[STIX]{x03C0}\unicode[STIX]{x1D701})}{n\unicode[STIX]{x03C0}}(1-\unicode[STIX]{x1D6FF}_{n,0})\right],\end{eqnarray}$$
 $$\begin{eqnarray}\displaystyle & & \displaystyle \text{IntU}1\_2(n)=\int _{0}^{w}\int _{0}^{1}u_{2}\cos (\unicode[STIX]{x03C0}r_{n}y)\cos \left(\frac{\unicode[STIX]{x03C0}s_{n}}{w}x\right)\,\text{d}y\,\text{d}x\nonumber\\ \displaystyle & & \displaystyle \quad =\frac{4w}{\unicode[STIX]{x03C0}^{2}}\mathop{\sum }_{j=1}^{N}\frac{d_{j}(-1)^{r_{j}+q_{j}+s_{n}+r_{n}}(2r_{j}+1)(2q_{j}+1)}{(2r_{j}+2r_{n}+1)(2r_{j}-2r_{n}+1)(2q_{j}+2s_{n}+1)(2q_{j}-2s_{n}+1)},\quad \qquad\end{eqnarray}$$
with
 $$\begin{eqnarray}\displaystyle & \displaystyle b_{1}^{\prime }=b_{PE2}, & \displaystyle\end{eqnarray}$$
 $$\begin{eqnarray}\displaystyle & \displaystyle b_{2}^{\prime }=-b_{PE2}\coth \unicode[STIX]{x1D6FC}+\frac{\displaystyle (\cosh K)^{-1}\left(\frac{K^{2}b_{PE1}}{K^{2}-\unicode[STIX]{x1D6FC}^{2}}\right)-\frac{K^{2}}{\unicode[STIX]{x1D6FC}^{2}\unicode[STIX]{x1D702}_{\unicode[STIX]{x1D706}}^{2}}}{\sinh \unicode[STIX]{x1D6FC}}, & \displaystyle\end{eqnarray}$$
 $$\begin{eqnarray}\displaystyle & \displaystyle b_{3}^{\prime }=-\frac{K^{2}b_{PE1}}{K^{2}-\unicode[STIX]{x1D6FC}^{2}}, & \displaystyle\end{eqnarray}$$
 $$\begin{eqnarray}\displaystyle & \displaystyle b_{4}^{\prime }=\tanh K\left(\frac{K^{2}b_{PE1}}{K^{2}-\unicode[STIX]{x1D6FC}^{2}}\right), & \displaystyle\end{eqnarray}$$
 $$\begin{eqnarray}\displaystyle & \displaystyle b_{5}^{\prime }=\frac{K^{2}}{\unicode[STIX]{x1D6FC}^{2}\unicode[STIX]{x1D702}_{\unicode[STIX]{x1D706}}^{2}}, & \displaystyle\end{eqnarray}$$
 $$\begin{eqnarray}\displaystyle & \displaystyle \mathbb{G}_{1}(n,K)=(-1)^{n}\frac{K\cos (n\unicode[STIX]{x03C0}l)\sinh [K(1-l)]-n\unicode[STIX]{x03C0}\sin (n\unicode[STIX]{x03C0}l)\cosh [K(1-l)]}{K^{2}+(n\unicode[STIX]{x03C0})^{2}}, & \displaystyle \nonumber\\ \displaystyle & & \displaystyle\end{eqnarray}$$
 $$\begin{eqnarray}\displaystyle & \displaystyle \mathbb{G}_{2}(n,\unicode[STIX]{x1D6FC})=(-1)^{n}\frac{\unicode[STIX]{x1D6FC}\sinh \unicode[STIX]{x1D6FC}-\unicode[STIX]{x1D6FC}\cos (n\unicode[STIX]{x03C0}l)\sinh [\unicode[STIX]{x1D6FC}(1-l)]+n\unicode[STIX]{x03C0}\sin (n\unicode[STIX]{x03C0}l)\cosh [\unicode[STIX]{x1D6FC}(1-l)]}{\unicode[STIX]{x1D6FC}^{2}+(n\unicode[STIX]{x03C0})^{2}}, & \displaystyle \nonumber\\ \displaystyle & & \displaystyle\end{eqnarray}$$
 $$\begin{eqnarray}\displaystyle & \displaystyle \mathbb{G}_{3}(n,\unicode[STIX]{x1D6FC})=(-1)^{n}\frac{\unicode[STIX]{x1D6FC}\cosh \unicode[STIX]{x1D6FC}-\unicode[STIX]{x1D6FC}\cos (n\unicode[STIX]{x03C0}l)\cosh [\unicode[STIX]{x1D6FC}(1-l)]+n\unicode[STIX]{x03C0}\sin (n\unicode[STIX]{x03C0}l)\sinh [\unicode[STIX]{x1D6FC}(1-l)]}{\unicode[STIX]{x1D6FC}^{2}+(n\unicode[STIX]{x03C0})^{2}}. & \displaystyle \nonumber\\ \displaystyle & & \displaystyle\end{eqnarray}$$
For a uniform source, from (2.122) and (2.123), we may write
 $$\begin{eqnarray}\displaystyle & \displaystyle K_{1,1}(t)=-u_{m,1}, & \displaystyle\end{eqnarray}$$
 $$\begin{eqnarray}\displaystyle & \displaystyle K_{1,2}(t)=-u_{m,2}, & \displaystyle\end{eqnarray}$$
with  $u_{m,1}$ and
 $u_{m,2}$ given by (2.36) and (2.29), respectively.
The function  $f_{1}$ can be derived, using (2.110) and (2.111) for
 $n=1$ along with relevant initial and boundary conditions, as
 $$\begin{eqnarray}\displaystyle f_{1,i}(x,y,t) & = & \displaystyle -\mathop{\sum }_{p=1}^{\infty }\left\{\mathop{\sum }_{n=1}^{\infty }\left[\frac{A_{n,i}\text{INTU}2(n,p,i)}{\text{INTCOS}(p,i)}\text{INTEXP}(p,n,t,i)\right]\right.\nonumber\\ \displaystyle & & \displaystyle +\left.A_{p,i}\text{EXP}(p,t,i)\int _{0}^{t}K_{1,i}(s)\,\text{d}s\right\}\text{COS}(p,x,y,i),\end{eqnarray}$$
in which
 $$\begin{eqnarray}\displaystyle & \displaystyle \text{INTU}2(n,p,i)=\unicode[STIX]{x1D6FF}_{1,i}\text{IntU}2\_1(n,p)+\unicode[STIX]{x1D6FF}_{2,i}\text{IntU}2\_2(n,p), & \displaystyle\end{eqnarray}$$
 $$\begin{eqnarray}\displaystyle & \displaystyle \text{IntU}2\_1(n,p)=\int _{0}^{1}u_{1}\cos (n\unicode[STIX]{x03C0}y)\cos (\mathit{\{})\,\text{d}y, & \displaystyle\end{eqnarray}$$
 $$\begin{eqnarray}\displaystyle \text{IntU}2\_2(n,p) & = & \displaystyle \int _{0}^{w}\int _{0}^{1}u\cos (\unicode[STIX]{x03C0}r_{n}y)\cos (\unicode[STIX]{x03C0}r_{p}y)\cos \left(\frac{\unicode[STIX]{x03C0}s_{n}}{w}x\right)\cos \left(\frac{\unicode[STIX]{x03C0}s_{p}}{w}x\right)\,\text{d}y\,\text{d}x\nonumber\\ \displaystyle & = & \displaystyle \frac{w}{\unicode[STIX]{x03C0}^{2}}\mathop{\sum }_{j=1}^{N}d_{j}(-1)^{r_{j}+q_{j}+r_{n}+s_{n}+r_{p}+s_{p}}(2q_{j}+1)(2r_{j}+1)\nonumber\\ \displaystyle & & \displaystyle \times \,\left\{\frac{1}{[2(q_{j}+s_{n}+s_{p})+1][2(q_{j}-s_{n}-s_{p})+1]}\right.\nonumber\\ \displaystyle & & \displaystyle +\left.\frac{1}{[2(q_{j}+s_{n}-s_{p})+1][2(q_{j}-s_{n}+s_{p})+1]}\right\}\nonumber\\ \displaystyle & & \displaystyle \times \,\left\{\frac{1}{[2(r_{j}+r_{n}+r_{p})+1][2(r_{j}-r_{n}-r_{p})+1]}\right.\nonumber\\ \displaystyle & & \displaystyle +\left.\frac{1}{[2(r_{j}+r_{n}-r_{p})+1][2(r_{j}-r_{n}+r_{p})+1]}\right\},\end{eqnarray}$$
 $$\begin{eqnarray}\displaystyle & \displaystyle \text{INTEXP}(p,n,t,i)=\unicode[STIX]{x1D6FF}_{1,i}\text{Intexp}\_1(p,n,t)+\unicode[STIX]{x1D6FF}_{2,i}\text{Intexp}\_2(p,n,t), & \displaystyle\end{eqnarray}$$
 $$\begin{eqnarray}\displaystyle \text{Intexp}\_1(p,n,t) & = & \displaystyle (1-\unicode[STIX]{x1D6FF}_{n,p})\frac{\exp (-n^{2}\unicode[STIX]{x03C0}^{2}t)-\exp (-p^{2}\unicode[STIX]{x03C0}^{2}t)}{(p^{2}-n^{2})\unicode[STIX]{x03C0}^{2}}\nonumber\\ \displaystyle & & \displaystyle +\,\unicode[STIX]{x1D6FF}_{n,p}t\exp (-n^{2}\unicode[STIX]{x03C0}^{2}t),\end{eqnarray}$$
 $$\begin{eqnarray}\displaystyle \text{Intexp}\_2(p,n,t) & = & \displaystyle (1-\unicode[STIX]{x1D6FF}_{n,p})\frac{\displaystyle \exp \left[-\unicode[STIX]{x03C0}^{2}\left(r_{n}^{2}+\frac{s_{n}^{2}}{w^{2}}\right)t\right]-\exp \left[-\unicode[STIX]{x03C0}^{2}\left(r_{p}^{2}+\frac{s_{p}^{2}}{w^{2}}\right)t\right]}{\displaystyle \unicode[STIX]{x03C0}^{2}(r_{p}^{2}-r_{n}^{2})+\frac{\unicode[STIX]{x03C0}^{2}}{w^{2}}(s_{p}^{2}-s_{n}^{2})}\nonumber\\ \displaystyle & & \displaystyle +\,\unicode[STIX]{x1D6FF}_{n,p}t\exp \left[-\unicode[STIX]{x03C0}^{2}\left(r_{n}^{2}+\frac{s_{n}^{2}}{w^{2}}\right)t\right].\end{eqnarray}$$
The term  $\int _{0}^{t}K_{1}(s)\,\text{d}s$ can be evaluated by applying the integral conditions as
 $$\begin{eqnarray}\int _{0}^{t}K_{1,i}(s)\,\text{d}s=-\frac{\displaystyle \mathop{\sum }_{n=1}^{\infty }A_{n,i}\text{INTU}1(n,i)\text{INTEXP}(0,n,t,i)}{(A_{1,i})_{r_{p}=s_{p}=0\;\text{or}\;p=0}},\end{eqnarray}$$
where
 $$\begin{eqnarray}\text{INTU}1(n,i)=\unicode[STIX]{x1D6FF}_{1,i}\text{IntU}1\_1(n)+\unicode[STIX]{x1D6FF}_{2,i}\text{IntU}1\_2(n).\end{eqnarray}$$
The dispersion coefficient is also obtained to be
 $$\begin{eqnarray}\displaystyle K_{2,i}(t) & = & \displaystyle \frac{1}{Pe^{2}}+\frac{1}{\unicode[STIX]{x1D6FF}_{2,i}w+\unicode[STIX]{x1D6FF}_{1,i}}\mathop{\sum }_{p=1}^{\infty }\left\{\mathop{\sum }_{n=1}^{\infty }\left[\frac{A_{n,i}\text{INTU}2(n,p,i)}{\text{INTCOS}(p,i)}\text{INTEXP}(p,n,t,i)\right]\right.\nonumber\\ \displaystyle & & \displaystyle +\left.A_{p,i}\text{EXP}(p,t,i)\int _{0}^{t}K_{1,i}(s)\,\text{d}s\right\}\text{INTU}1(p,i).\end{eqnarray}$$
For a uniform source, the function  $f_{1}$ and the dispersion coefficients are given as
 $$\begin{eqnarray}\displaystyle f_{1,2} & = & \displaystyle \frac{4}{w}\mathop{\sum }_{p=1(r_{p}\;\text{and}\;s_{p}\neq 0)}^{\infty }\text{IntU}1\_2(p)\frac{\displaystyle \exp \left[-\unicode[STIX]{x03C0}^{2}\left(r_{p}^{2}+\frac{s_{p}^{2}}{w^{2}}\right)t\right]-1}{\displaystyle \unicode[STIX]{x03C0}^{2}\left(r_{p}^{2}+\frac{s_{p}^{2}}{w^{2}}\right)}\nonumber\\ \displaystyle & & \displaystyle \times \,\cos (\unicode[STIX]{x03C0}r_{p}y)\cos \left(\frac{\unicode[STIX]{x03C0}s_{p}}{w}x\right),\end{eqnarray}$$
 $$\begin{eqnarray}\displaystyle & \displaystyle f_{1,1}=2\mathop{\sum }_{p=1(p\neq 0)}^{\infty }\text{IntU}1\_1(p)\frac{\exp (-\unicode[STIX]{x03C0}^{2}p^{2}t)-1}{\unicode[STIX]{x03C0}^{2}p^{2}}\cos (\unicode[STIX]{x03C0}py), & \displaystyle\end{eqnarray}$$
 $$\begin{eqnarray}\displaystyle & \displaystyle K_{2,2}(t)=\frac{1}{Pe^{2}}-\frac{1}{w}\mathop{\sum }_{p=1(r_{p}\;\text{and}\;s_{p}\neq 0)}^{\infty }[\text{IntU}1\_2(p)]^{2}\frac{\displaystyle \exp \left[-\unicode[STIX]{x03C0}^{2}\left(r_{p}^{2}+\frac{s_{p}^{2}}{w^{2}}\right)t\right]-1}{\displaystyle \unicode[STIX]{x03C0}^{2}\left(r_{p}^{2}+\frac{s_{p}^{2}}{w^{2}}\right)\text{Intcos}\_2(p)}, & \displaystyle \nonumber\\ \displaystyle & & \displaystyle\end{eqnarray}$$
 $$\begin{eqnarray}\displaystyle & \displaystyle K_{2,1}(t)=\frac{1}{Pe^{2}}-2\mathop{\sum }_{p=1(p\neq 0)}^{\infty }[\text{IntU}1\_1(p)]^{2}\frac{\exp (-\unicode[STIX]{x03C0}^{2}p^{2}t)-1}{\unicode[STIX]{x03C0}^{2}p^{2}}. & \displaystyle\end{eqnarray}$$
It is noted that the expression of solute concentration for  $Da=0$ is still given by (2.104).
2.4.6 Numerical solutions
For validation of the results and to investigate the validity of the assumptions made in the derivation of the analytical solutions, finite-element-based numerical simulations were conducted utilizing COMSOL Multiphysics software. The electrical potential field was obtained using the Boltzmann distribution of ions without applying the Debye–Hückel linearization and the momentum equation was solved in steady state. After obtaining the velocity field, the unsteady mass transport equation was solved to analyse the transport of a solute band from the time of injection. A total number of 1 512 622 tetrahedral meshes were used in the simulations, which were found to provide grid-independent results, as no significant changes were observed in the results by reducing the number of meshes by half.
3 Results and discussion
Before proceeding with the discussion of the results, a convergence analysis is presented in table 1 to determine the terms required to obtain accurate velocity results. The parameter chosen for investigation is the dimensionless mean velocity and eight different combinations of the parameters  $K$,
 $l$ and
 $w$ are selected, which are more likely to provide the maximum error situations. The data given in table 1 show that utilizing
 $50^{2}$ terms of the series solutions instead of
 $100^{2}$ terms results in relative errors below 0.5 %. Hence, all the results are obtained considering
 $N=50^{2}=2500$ in the series solutions. In the selection of the dimensionless governing parameters, their practical ranges, given in table 3, are considered as a guide. Note that these ranges are obtained utilizing the typical values of the main physicochemical parameters compiled in table 2. Although the solutions obtained in § 2 are general enough to be applied to any form of initial concentration distribution, the results are given only for an initial distribution of square shape with a side length of
 $2aH$ (see figure 1). This way, not only do we approximate the initial solute concentration due to an injection from a syringe of lower diameter than the channel, but also we are able to recover the case that the sample plug occupies the entire cross-section as a special case of the assumed initial conditions for
 $a=w=1$. Unless otherwise is stated, the results are obtained utilizing the analytical solutions.
Convergence of the dimensionless mean velocity values for  $\unicode[STIX]{x1D6FC}=\unicode[STIX]{x1D702}_{\unicode[STIX]{x1D706}}=1$.

Typical ranges of the main physicochemical parameters.

Typical ranges of the dimensionless governing parameters.

Although the main purpose of this study is to focus on analyte dispersion, due to the dependence of the convection and dispersion coefficients on the velocity profile, the presentation of results starts with studying the influences of  $l$,
 $\unicode[STIX]{x1D6FC}$ and
 $K$ on the velocity profile at the vertical mid-plane in figure 2. A comparison is also made in this figure between the analytical results of fluid velocity and those predicted by COMSOL Multiphysics, indicating a good agreement between the results. The small discrepancy between the analytical and numerical results stems from the linearization of the electric potential equation when developing analytical solutions, a simplification that is not made when treating the problem numerically. As is obvious in figure 2(a), the thicker is the PEL the larger is the fluid velocity, a trend that can be attributed to the increase of the fixed charged groups inside the channel with thickening of the soft layer, which leads to more accumulation of counterions in the channel. Figure 2(b) demonstrates the effect of the PEL friction coefficient on the velocity distribution. As expected, the fluid velocity decreases with increasing the PEL friction due to higher resistive forces experienced by the fluid. It is worth mentioning that for large values of
 $\unicode[STIX]{x1D6FC}$, such as
 $100$ and
 $150$, the velocity becomes almost zero inside the soft layer and, therefore, the velocity profile shows a weaker dependence on
 $\unicode[STIX]{x1D6FC}$. The effect of
 $K$ on the velocity distribution is demonstrated in figure 2(c), showing that
 $u$ increases with increasing
 $K$. An increase in
 $K$ while keeping
 $l$ and
 $\unicode[STIX]{x1D702}_{\unicode[STIX]{x1D706}}$ constant may be achieved by increasing both the ionic concentration and the density of PEL fixed charges. The former tends to limit the region of net electric charge to the soft layer where the resistive force of polyelectrolyte brushes hinders fluid motion, whereas the latter tends to facilitate fluid motion by increasing the electroosmotic body force. Since the role of the latter is determinative, larger fluid velocities are achieved by increasing
 $K$.
Comparison between the vertical mid-plane velocity profiles obtained by means of the analytical solutions and those predicted by COMSOL Multiphysics. The default parameters include  $w=1$,
 $l=0.1$,
 $K=5$,
 $\unicode[STIX]{x1D702}_{\unicode[STIX]{x1D706}}=1$ and
 $\unicode[STIX]{x1D6FC}=1$.

The effect of initial solute distribution on the exchange coefficient  $K_{0}$ is shown in figure 3. Negative values of
 $K_{0}$ reflect the fact that the amount of solute in the channel is diminished due to wall adsorption. The first point drawing attention in figure 3(a) is the drastic difference in the behaviour of
 $K_{0}$ for different values of
 $a$. For small values of
 $a$,
 $K_{0}$ is a monotonically increasing function starting from zero; however, when
 $a$ approaches unity, a non-monotonic trend is observed. The latter is because, when the solute band has occupied an area that is initially in contact with the horizontal walls, adsorption starts immediately after the injection of the solute band, leading to higher values of
 $K_{0}$ at time zero. As the solute is convected along the microchannel, it diffuses through the entire cross-sectional area and approaches the vertical walls at a threshold time
 $t_{c}$. This, in turn, gives rise to higher adsorption rates at the walls, which reverse the decreasing trend of
 $K_{0}$ with time. For a better illustration, the
 $x$-dependence of the average concentration over the
 $Y$–
 $Z$ plane
 $c_{m}(x,t)$ for the case
 $a=1$ in figure 3(a) is shown in figure 3(c) at different times. It is evident from this figure that the time at which the solute concentration builds up at the transverse wall is very consistent with the threshold value of
 $t$ in figure 3(a).
Plots of the exchange coefficient versus the dimensionless time at various initial distributions for (a)  $Da=1,w=2$ and (b)
 $Da=10,w=4$. In (c), the values of average concentration over the
 $Y$–
 $Z$ plane
 $c_{m}(x,t)$, obtained by COMSOL Multiphysics, are plotted versus
 $x$ at different dimensionless times while keeping
 $Da=1$,
 $w=2$ and
 $a=1$. A channel length of
 $10H$ has been considered for averaging. The dashed lines in (a) denote the results pertaining to a slit geometry. 1-D, one-dimensional.

For a small  $a$, because of the absence of solutes adjacent to the walls, the exchange coefficient is zero at the beginning and starts to increase monotonically when the solutes reach the surface via molecular diffusion. Under these circumstances, the smaller the value of
 $a$, the higher the value of
 $t$ at which
 $K_{0}$ becomes significant, mainly because the distance travelled by the solutes to reach the surface is larger for a smaller
 $a$.
Figure 3(a) also includes a comparison of the results with those pertaining to a slit geometry. As is clear, there is a complete agreement between the results up to  $t_{c}$, after which the values of
 $K_{0}$ for a slit geometry lag behind those of a rectangular geometry, due to the absence of the vertical walls for the former. This reveals that approximating a rectangular geometry with the space between two parallel plates may lead to considerable errors in the estimation of the mass transport characteristics.
The effects of  $w$ and
 $Da$ on the unsteady behaviour of
 $K_{0}$ may be found by comparing different parts of figure 3. By comparing figure 3(b) with figure 3(a), one can deduce that the higher the value of
 $w$ or
 $Da$, the smaller the difference between the value of
 $K_{0}$ at time
 $t_{c}$, given by
 $K_{0,c}$, and its asymptotic value, shown as
 $K_{0,asy}$. The reason is that increasing of
 $w$ and
 $Da$ leads to the depletion of the concentration front heading the vertical walls, either because of higher adsorption rates at the horizontal walls or larger diffusion lengths, thereby reducing the mass transport to the vertical walls and, ultimately, lowering their importance. Moreover, on increasing
 $w$, the asymptotic values of
 $K_{0}$ are achieved at later times. This is because a larger diffusion path postpones the equilibrium between the diffusional transport of solutes across the channel and the solute adsorption at the surface, which is required for
 $K_{0}$ to reach a steady state.
Figure 4 displays the time dependence of  $K_{0}$ at different
 $a$ and
 $Da$ while keeping
 $w=1$. When
 $Da$ is small and the solute band initially occupies the entire cross-sectional area, that is for
 $Da=0.01$ and
 $a=1$,
 $K_{0}$ quickly reaches its final value. As stated before, the equilibrium between diffusional transport of solutes and surface adsorption determines the time at which
 $K_{0}$ becomes steady. At smaller values of
 $a$, regardless of
 $Da$, this time is controlled by the diffusion of solutes. For large values of
 $a$, however, since the solutes quickly reach the walls,
 $Da$ plays an important role in the determination of the steady state. In the case of a large
 $Da$, since the wall adsorption rate is much higher than the rate of the delivery of solutes to the wall, the time required to establish a steady state is once again controlled by the diffusional transport of solutes. For a small
 $Da$, however, the wall adsorption is insignificant; accordingly, the rate of the cross-stream travelling of solutes may be well suited to the consumption rate at the wall, leading to a fast balance of the mass transfer at the wall and a quick establishment of the steady state.
Plots of the exchange coefficient versus the dimensionless time at various initial distributions for a square duct setting (a)  $Da=0.01$, (b)
 $Da=1$ and (c)
 $Da=10$. The dashed lines in (c) denote the results pertaining to a slit geometry.

Figure 4(b) reveals an increasing–decreasing variation of  $K_{0}$ with time for
 $a=0.99$ and 0.95. The same is true for values of
 $a$ between 0.9 and 0.99 in figure 4(c). This may be attributed to the fact that, when
 $a$ is close to unity and
 $Da$ is moderately high, solutes are rapidly transported to the near-wall region and quickly captured at the wall, making
 $K_{0}$ an increasing function of time. After a while, the solution experiences a severe depletion adjacent to the wall; the decrease of solute concentration in these conditions is so high that it cannot be compensated for by the molecular diffusion of solutes, thereby reversing the trend of
 $K_{0}$ with
 $t$.
Figure 4(c) reveals that, despite figure 3(a), there is a significant discrepancy between the one- and two-dimensional results from the beginning of the process. This may be attributed to the square geometry of the channel, which prepares the way for the occurrence of adsorption from both horizontal and vertical walls from time zero.
By taking a glance at different parts of figure 4, it can be deduced that  $K_{0}$ shows an increasing dependence on
 $Da$. More precisely,
 $K_{0}$ seems to be of the order of
 $Da$. This can be justified by a scale analysis utilizing (2.60c) and (2.64). From the former, one can conclude that
 $\unicode[STIX]{x2202}f_{0,2}/\unicode[STIX]{x2202}y$ and, consequently,
 $\unicode[STIX]{x2202}^{2}f_{0,2}/\unicode[STIX]{x2202}y^{2}$ are of the same order as
 $Daf_{0,2}$. Then, equating the orders of the terms
 $\unicode[STIX]{x2202}^{2}f_{0,2}/\unicode[STIX]{x2202}y^{2}$ and
 $f_{0,2}K_{0,2}$ in (2.64), reveals that
 $K_{0,2}$ is truly of the order of
 $Da$.
Figure 5(a) depicts the dependence of the asymptotic values of  $K_{0}$ on the Damköhler number
 $Da$ for six different geometrical configurations;
 $K_{0,asy}$, which is independent of the initial distribution, increases with increasing
 $Da$ until it tends to limiting values at sufficiently high values of
 $Da$. The main reason is the enhancement of surface adsorption with increasing
 $Da$ until the shortage of the solutes near the wall prevents further mass transfer to the wall. It is observed in figure 5(b) that
 $K_{0,asy}$ decreases with increasing
 $w$ until it tends to limiting values pertinent to the special case of a slit geometry at high values of
 $w$. The decreasing dependence of
 $K_{0,asy}$ on
 $w$ can be attributed to the fact that, at sufficiently long times, it is the rate of solute delivery from the core to the wall-adherent region, which determines the amount of
 $K_{0,asy}$; therefore,
 $K_{0,asy}$ is smaller at a higher
 $w$, for which there is a larger diffusion path. All in all, figure 5 demonstrates that a channel of square cross-section provides the largest mass exchange between the fluid and the channel wall. This means that microreactors should be fabricated with the same width and height, in order to achieve the maximum efficiency.
Plots of asymptotic values of  $K_{0}$ versus (a)
 $Da$ at different values of
 $w$ and (b)
 $w$ at various
 $Da$. The symbols in (a) and dashed lines in (b) denote the results pertaining to a slit geometry.

Shown in figure 6 is the time dependence of  $K_{1}$ at different
 $a$ and
 $Da$. As observed,
 $K_{1}$ increases with increasing
 $Da$ for a fixed
 $a$. This may be explained by the fact that, when
 $Da$ increases, the solute concentration reduces, especially near the wall, where the fluid flows slowly. Consequently, the convective transport alters in favour of the fast-moving core region having higher concentrations, giving rise to higher values of
 $K_{1}$. This effect will appear by the time at which the solutes have reached the wall; so the graphs of the same
 $a$ but different
 $Da$ start to separate earlier for a larger
 $a$.
Plots of the convection coefficient versus dimensionless time for different  $a$ and
 $Da$ while keeping
 $w=1$,
 $l=0.1$,
 $\text{K }=5$,
 $\unicode[STIX]{x1D702}_{\unicode[STIX]{x1D706}}=1.0$ and
 $\unicode[STIX]{x1D6FC}=1$.

Plots of (a) the convection coefficient versus the dimensionless time for different values of  $a$ and
 $l$ considering
 $w=1$, (b) the convection coefficient versus the dimensionless time for different values of
 $a$ and
 $w$ considering
 $l=0.1$ and (c) the dimensionless partial average velocity
 $u_{m}^{par}$ versus
 $a$ for different values of
 $w$ and
 $l$ and the dimensionless average velocity
 $u_{m}$ versus
 $w$. The symbols in (b) denote the results pertaining to a slit geometry. All the results are obtained considering
 $K=5$,
 $\unicode[STIX]{x1D702}_{\unicode[STIX]{x1D706}}=1$,
 $\unicode[STIX]{x1D6FC}=1$ and
 $Da=1$.

It is to be mentioned that, for a given  $Da$, all the results obtained for
 $K_{1}$ at different initial distributions reach the same asymptotic value; nevertheless, different variations with time can be observed before a steady state is achieved. This is grounded in the fact that
 $K_{1}$ is determined by the interplay between the convective mass transport and the wall adsorption. At small values of
 $Da$, due to insignificant wall adsorption, solute convection plays the only important role in the variations of
 $K_{1}$. For non-unity values of
 $a$, there is a gradual movement of solutes from the core to the near-wall region, thereby diminishing the convective transport and, ultimately, rendering
 $K_{1}$ a decreasing function of time. For larger values of
 $Da$, however, the competition between the two aforementioned factors determines the variation of
 $K_{1}$ with time. For
 $Da=1$, wall adsorption is more determinant than solute convection for
 $a=0.9$ (at longer times) and
 $a=1$ (from the beginning), forcing
 $K_{1}$ to increase with
 $t$. By increasing the value of
 $Da$ to 10, because of the pronounced effect of wall adsorption, the amplification of
 $K_{1}$ is observed not only for
 $a=0.9$ and 1 but also for smaller values of
 $a$ such as
 $a=0.7$. The last point worth noting regarding figure 6 is that, regardless of
 $Da$, the transient convection coefficient increases with decreasing
 $a$. This occurs because more solutes are located in the core for a smaller
 $a$ so that the convective transport is pronounced.
Variations of the asymptotic value of the convection coefficient with respect to (a) the Damköhler number at several aspect ratios for both  $l=0.05$ and
 $l=0.1$ and (b) the aspect ratio for different
 $Da$. All the results are obtained considering
 $K=5$,
 $\unicode[STIX]{x1D702}_{\unicode[STIX]{x1D706}}=1$ and
 $\unicode[STIX]{x1D6FC}=1$. The long dashed lines denote the results pertaining to a slit geometry.

Figure 7 shows the effects of the channel geometrical configuration and the soft layer thickness on the time dependence of  $K_{1}$. As is clear in figure 7(a), a larger
 $l$ is accompanied by a larger
 $K_{1}$. This is mainly because a thicker PEL contains more electric charges, creating a larger electroosmotic flow and, consequently, an enhanced convective transport. Furthermore, the impact of
 $a$ on the transient convection coefficient is found to be higher for a larger
 $l$. The physical mechanism behind this behaviour can be deduced from figure 7(c) that plots the dimensionless partial average velocity, given by
 $u_{m}^{par}=\int _{0}^{a}\int _{0}^{a}u\,\text{d}x\,\text{d}y/a^{2}$, versus
 $a$. As shown, the changes of
 $u_{m}^{par}$ with
 $a$ are more intense for a larger
 $l$, justifying the sharper dependence of
 $K_{1}$ on
 $a$ for a thicker PEL. Figure 7(c) also illustrates that, as expected, the average velocity of the solute band decreases when it spreads out across the channel.
Plots of (a) the asymptotic values of  $K_{1}$ versus the PEL friction factor at different
 $Da$ and
 $l$, (b) the convection coefficient versus the dimensionless time at different
 $l$ and
 $\unicode[STIX]{x1D6FC}$ while keeping
 $Da=0.01$ and
 $a=0.1$, (c) the dimensionless partial average velocity versus the initial distribution parameter at different
 $l$ while keeping
 $\unicode[STIX]{x1D6FC}=50$. All the results are obtained considering
 $w=1$,
 $K=5$ and
 $\unicode[STIX]{x1D702}_{\unicode[STIX]{x1D706}}=1$.

The effect of the channel aspect ratio on the time dependence of  $K_{1}$ for three different initial distributions is shown in figure 7(b). The physical interpretation of the results can be easily performed utilizing figure 7(c). For the steady state for which the solutes have spread out over the entire channel cross-sectional area, it is the average velocity
 $u_{m}$ that determines the convection coefficient; hence,
 $K_{1}$ increases as
 $w$ increases because
 $u_{m}$ is higher for a larger aspect ratio. However, at earlier times, the influential parameter is
 $u_{m}^{par}$, which represents the average velocity in the area initially occupied by the solutes. Accordingly,
 $K_{1}$ shows the same trend as that of
 $u_{m}^{par}$.
The graphs of the asymptotic values of  $K_{1}$ versus the Damköhler number at different values of the geometrical aspect ratio and PEL thickness are plotted in figure 8(a). As noted previously,
 $K_{1,asy}$ is an increasing function of
 $Da$ until it tends to a limiting value at sufficiently high values of
 $Da$. In the small Damköhler regime,
 $K_{1,asy}$ is linearly proportional to
 $Da$. The graphs of
 $K_{1,asy}$ versus aspect ratio, plotted in figure 8(b), show an increasing dependence of
 $K_{1,asy}$ on
 $w$ for smaller values of
 $Da$; however, a non-monotonic trend is seen for higher Damköhler numbers. With amplification of
 $w$, due to the increase of
 $u_{m}$ (as shown in figure 7c), the convection of solutes is amplified; however, the wall adsorption reduces at the same time, as evidenced by figure 5. Therefore, at smaller values of
 $Da$ for which the wall adsorption is insignificant, the second effect is not important and
 $K_{1,asy}$ increases with increasing
 $w$. For higher values of
 $Da$, however, the second effect may become important and the interplay between the wall adsorption and the convection of solutes determines the changes of
 $K_{1,asy}$ with
 $w$. It is observed that the results are approaching those of the slit geometry for very large aspect ratios. This is owing to the fact that by increasing
 $w$ not only does the solute convection approach that of the slit geometry but also the high solute adsorption at the longitudinal walls renders their effects less significant.
Figure 9 is included to show the effect of the PEL friction factor  $\unicode[STIX]{x1D6FC}$ on the steady-state and transient values of
 $K_{1}$. As seen in figure 9(a),
 $K_{1,asy}$ is a decreasing function of
 $\unicode[STIX]{x1D6FC}$, mainly because of lower fluid velocities for a higher
 $\unicode[STIX]{x1D6FC}$ as a result of higher resistive forces. The dependence of
 $K_{1,asy}$ on
 $l$, however, is not monotonic. Beside the changes in the importance of the wall adsorption effects, this non-monotonic behaviour may be attributed to the fact that thickening of the PEL has two opposite effects: increasing the friction force tending to retard the fluid flow and increasing the electroosmotic body force as a result of a higher number of fixed electric charges.
The time development of  $K_{1}$ is shown in figure 9(b) at different values of
 $l$ and
 $\unicode[STIX]{x1D6FC}$ while keeping
 $Da=0.01$ and
 $a=0.1$. It can be seen that when
 $\unicode[STIX]{x1D6FC}=50$ the convection coefficient for
 $l=0.2$ is higher than that of
 $l=0.15$ at earlier times, whereas the opposite is true at the steady state. This is because, at initial times, when the solute band is concentrated in the core region, it moves with a larger average velocity when
 $l=0.2$. This can be observed in figure 9(c) depicting
 $u_{m}^{par}$ versus
 $a$: the dimensionless partial average velocity is larger for
 $l=0.2$ when
 $a=0.1$. At the steady state, when
 $u_{m}$ matters, the convection coefficient is higher for
 $l=0.15$, which provides a larger mean velocity as compared to
 $l=0.2$ (values of
 $u_{m}^{par}$ for
 $a=1$ are the same as
 $u_{m}$) because of the smaller PEL resistive force. Note that, such a reverse trend is not observed for
 $\unicode[STIX]{x1D6FC}=5$ since the PEL friction force is not significant for this case. Another point worth mentioning regarding figure 9(b) is that
 $K_{1}$ is a decreasing function of time mostly because of the cross-stream migration of solutes from the core to the wall-adherent area where the fluid velocity is low.
We study the impact of  $\unicode[STIX]{x1D702}_{\unicode[STIX]{x1D706}}$ on
 $K_{1,asy}$ at different values of the soft layer thickness in figure 10. As expected for a low
 $\unicode[STIX]{x1D6FC}$,
 $K_{1,asy}$ increases with
 $l$ because of the increase in the fluid velocity as a result of a larger number of fixed charge groups. In addition, it is observed that a higher
 $\unicode[STIX]{x1D702}_{\unicode[STIX]{x1D706}}$ leads to a smaller
 $K_{1,asy}$. A larger
 $\unicode[STIX]{x1D702}_{\unicode[STIX]{x1D706}}$ at a fixed
 $K$ can be achieved by decreasing the density of the fixed PEL charges that is accompanied by a reduction in the number of counterions accumulated within the soft layer and, ultimately, a smaller electroosmotic velocity. Hence, it is not surprising to see a diminished convective transport for a larger
 $\unicode[STIX]{x1D702}_{\unicode[STIX]{x1D706}}$.
Dependence of  $K_{1,asy}$ on
 $\unicode[STIX]{x1D702}_{\unicode[STIX]{x1D706}}$ for different values of
 $l$ considering
 $K=5$ and
 $w=\unicode[STIX]{x1D6FC}=Da=1$.

The impacts of the surface reaction rate and the initial distribution of solutes on the time dependence of the dispersion coefficient are investigated in figure 11. As observed,  $K_{2}(t)$ generally increases with time until reaching a limiting value at the steady state. As time passes, the solutes move from the core, where the fluid velocity is largely uniform, to the wall-adherent area, where the flow field is strongly non-uniform, thereby amplifying the dispersion of mass. A main exception is the cases with large values of both
 $a$ and
 $Da$ like the case for which
 $a=1$ and
 $Da=10$. For these cases,
 $K_{2}(t)$ increases first until a maximum after which it gradually reduces to the steady-state value. The reduction of
 $K_{2}(t)$ at later times may be attributed to the intense consumption of solutes at the wall at a high
 $Da$, leading to the depletion of solution near the wall. Despite earlier times, since a sufficient amount of solute does not exist in the core at later times, the shortage of solute near the wall cannot be compensated for by diffusion of mass from the internal locations, leading to a reduction in the overall solute dispersion. Another remarkable point in figure 11 is that the dispersion coefficient decreases with increasing
 $Da$. This occurs because an enhanced reaction rate leads to more depletion of the solution near the wall. Accordingly, the solute concentration is weighted in favour of the central region, where the velocity is more uniform, thereby reducing the overall dispersion of solutes.
Effects of the surface reaction rate and the initial distribution of solutes on the time dependence of the dispersion coefficient for  $l=0.1$,
 $K=5$ and
 $\unicode[STIX]{x1D702}_{\unicode[STIX]{x1D706}}=\unicode[STIX]{x1D6FC}=w=1$.

The time dependence of the dispersion coefficient at different values of  $a$,
 $w$ and
 $Da$ is illustrated in figure 12. As seen, for any aspect ratio,
 $K_{2}$ is the same as that of a slit microchannel up to a threshold time. Before this threshold, the solutes have still not reached the vertical walls and, hence, the concentration field is very similar to that established in the flow between two parallel plates. When the solute band feels the presence of the vertical walls, the channel aspect ratio comes into play. Now, a rectangular geometry provides a larger solute dispersion mainly because of the large velocity gradients created near the vertical walls, especially at the corners. These gradients render the dispersion coefficient an increasing function of
 $w$ in the absence of wall adsorption, that is, for
 $Da=0$. Accordingly, the results for a rectangular geometry of large aspect ratio differ significantly from those of a slit geometry. The situation is different when there is adsorption of solutes at the walls. When
 $Da\neq 0$, the velocity gradient is not the only factor determining the behaviour of
 $K_{2}$ because the wall adsorption has an important role as well. Now, the wall adsorption leads to the depletion of solution near the walls, thereby reducing the hydrodynamic dispersion. The shortage of solutes near the vertical walls is more easily compensated for when
 $w$ is small, because of the smallness of the diffusion path, rendering the dispersion coefficient a decreasing function of
 $w$ for
 $Da\neq 0$.
Time dependence of the dispersion coefficient at different values of  $a$ and
 $w$ for (a)
 $Da=0$, (b)
 $Da=1$ and (c)
 $Da=10$ considering
 $l=0.1$,
 $K=5$ and
 $\unicode[STIX]{x1D702}_{\unicode[STIX]{x1D706}}=\unicode[STIX]{x1D6FC}=1$.

The influence of the Debye length on the time dependence of the dispersion coefficient at different values of  $a$ is studied in figure 13. A thinner Debye length, corresponding to a larger value of the Debye–Hückel parameter
 $K$, gives rise to a lower dispersion of solutes. The main reason is that by increasing
 $\text{K }$ the electroosmotic body force is more and more limited to the PEL where the retarding effect of the PEL prevents a significant fluid flow. Accordingly, smaller fluid velocities are obtained for a thinner EDL, leading to a lower dispersion of solutes. Note that the abrupt decrease in the rate of increase of
 $K_{2}$ is the result of the arrival of solutes at the vertical walls.
Time development of the dispersion coefficient at different Debye lengths and initial conditions considering  $w=3$,
 $l=0.1$ and
 $\unicode[STIX]{x1D6FC}=Da=1$. Both
 $K$ and
 $\unicode[STIX]{x1D702}_{\unicode[STIX]{x1D706}}$ are changed simultaneously to keep everything but the Debye length constant.

The variation of the dispersion coefficient with  $\unicode[STIX]{x1D702}_{\unicode[STIX]{x1D706}}$ in the asymptotic limit is shown in figure 14 at different
 $l$. A decrease in the long-term dispersion coefficient is observed by increasing
 $\unicode[STIX]{x1D702}_{\unicode[STIX]{x1D706}}$. The physical reason behind these variations is that by increasing
 $\unicode[STIX]{x1D702}_{\unicode[STIX]{x1D706}}$ a reduction occurs in the density of the PEL fixed charges, leading to a reduction in the electroosmotic body force. Accordingly, the velocity gradients are reduced as a result of smaller fluid velocities, resulting in a smaller dispersion of solutes. It can be seen in figure 14 that the dispersion coefficient is an increasing function of the PEL thickness. The main reason is that the thickening of the soft layer leads to larger fluid velocities that tend to amplify the dispersion. The increasing dependence of the dispersion coefficient on the soft layer thickness gives us a clue for improving the design of DNA microarrays. One important issue scientists are trying to resolve regarding these devices is their long hybridization time. If the inner layer of DNA microarrays is coated with long polyelectrolyte brushes, the consequent increase in dispersivity can lead to a faster movement of targets toward the downstream, where binding sites are located, thereby accelerating the hybridization process (Abdollahzadeh, Saidi & Sadeghi Reference Abdollahzadeh, Saidi and Sadeghi2017).
Variations of the asymptotic value of the dispersion coefficient with  $\unicode[STIX]{x1D702}_{\unicode[STIX]{x1D706}}$ at different values of the soft layer thickness considering
 $K=5$ and
 $w=\unicode[STIX]{x1D6FC}=Da=1$.

Figure 15 shows the effect of the PEL friction factor  $\unicode[STIX]{x1D6FC}$ on the dispersion coefficient. As seen in figure 15(a), the asymptotic value of the dispersion coefficient decreases with
 $\unicode[STIX]{x1D6FC}$ until it tends to a limiting value in the presence of high friction factors. The decreasing dependence of
 $K_{2,asy}$ on
 $\unicode[STIX]{x1D6FC}$ is due to the negative influence of the PEL friction force on the fluid velocity and the reason for
 $K_{2,asy}$ tending to limiting values at high values of
 $\unicode[STIX]{x1D6FC}$ is that, under these conditions, the fluid velocity within the PEL is actually zero because of huge retarding forces therein and no significant change occurs in the velocity field by increasing
 $\unicode[STIX]{x1D6FC}$. It is also visible in figure 15(b) that
 $K_{2}(t)$ for
 $a=0.1$ is lower than that of
 $a=1$ at unsteady conditions whereas the asymptotic values are not dependent on
 $a$. At initial times, the solute band for
 $a=0.1$ is more concentrated in the core where the velocity gradients are low. At later times, however, the solutes are dispersed over the entire cross-section for both cases and, hence, no difference is observed between the results.
Plots of (a)  $K_{2,asy}$ versus
 $\unicode[STIX]{x1D6FC}$ at different
 $l$ and (b)
 $K_{2}(t)$ versus time at different
 $a$ and
 $\unicode[STIX]{x1D6FC}$ while keeping
 $l=0.1$. The results are obtained for
 $K=5,\unicode[STIX]{x1D702}_{\unicode[STIX]{x1D706}}=w=1$ and
 $Da=0.01$.

The plots of  $K_{2,asy}$ versus
 $Da$ and
 $w$ are shown, respectively, in figure 16(a,b). It is shown that
 $K_{2,asy}$ is smaller for a larger
 $Da$. As noted previously, unlike the case with
 $Da=0$ for which the only factor determining the degree of solute dispersion is the distribution of the velocity gradient, the wall adsorption takes part when
 $Da\neq 0$. For low and moderate values of
 $Da$, there is the interplay between the velocity gradient and the wall adsorption that determines the dependence of
 $K_{2,asy}$ on
 $w$. Hence, this dependence is not monotonic and changes with
 $Da$ at low and moderate values of this parameter. At high values of
 $Da$, however, the dominance of the wall adsorption effects renders
 $K_{2,asy}$ a monotonically decreasing function of
 $w$. Under these circumstances, the exact shape of the channel has a limited influence on the dispersion coefficient. Figure 16(b) illustrates that, as concluded previously, unlike the cases with
 $Da\neq 0$ for which the dispersion coefficient tends to that of a slit geometry at high aspect ratios, there is a significant difference between the dispersion coefficients when
 $Da=0$.
Plots of  $K_{2,asy}$ versus (a)
 $Da$ for different channel aspect ratios and (b)
 $w$ for various Damköhler numbers. The dashed lines in (b) denote the results pertaining to a slit geometry. All the results are obtained by considering
 $K=5$,
 $\unicode[STIX]{x1D702}_{\unicode[STIX]{x1D706}}=\unicode[STIX]{x1D6FC}=1$ and
 $l=0.1$.

The axial distribution of the dimensionless mean concentration over the  $X$–
 $Y$ plane is given at different times in figure 17. A comparison is also made in this figure between the analytical results and the predictions of the numerical simulations, revealing a relatively good agreement between the results. Since the accuracy is much higher for larger times, the error should be mainly due to the truncation of the series in (2.48) and can be reduced by increasing the number of terms considered. The error for large times may be attributed to the Debye–Hückel linearization utilized in the development of the analytical solutions. As is visible in figure 17, the solute band is gradually broadened by the hydrodynamic dispersion and the concentration profile gets wider. In addition, because of the band broadening as well as the wall absorption, the maximum value of
 $c_{m}(z,t)$ decreases with time.
Axial distribution of the dimensionless mean concentration over the  $X$–
 $Y$ plane at different times considering
 $K=5$,
 $\unicode[STIX]{x1D702}_{\unicode[STIX]{x1D706}}=w=\unicode[STIX]{x1D6FC}=Da=1$ and
 $a=0.5$. The analytical results, shown by solid lines, are compared with the predictions of numerical simulations, represented by dashed lines.

Shown in figure 18 is the axial distribution of the dimensionless mean concentration over the  $X$–
 $Y$ plane at different
 $Da$,
 $l$,
 $t$ and
 $\unicode[STIX]{x1D702}_{\unicode[STIX]{x1D706}}$. In figure 18(a),
 $c_{m}(z,t)$ is plotted at the time
 $t=1$ for different values of
 $Da$. As seen, the maximum value of
 $c_{m}(z,t)$ decreases with increasing
 $Da$ while, at the same time, the solute band moves faster along the channel. The former is due to the enhanced wall adsorption effects and the latter is because of the fact that the convection coefficient is higher in the presence of a higher reaction rate.
Axial distribution of the dimensionless mean concentration over the  $X$–
 $Y$ plane considering
 $K=5$,
 $w=1$ and
 $\unicode[STIX]{x1D6FC}=1$ for (a)
 $l=0.1$ and
 $t=1$ at different
 $Da$, (b)
 $Da=t=1$ at different
 $l$, (c)
 $Da=1$ and
 $l=0.1$ at different
 $t$ and
 $a$ and (d)
 $Da=t=1$ at different
 $\unicode[STIX]{x1D702}_{\unicode[STIX]{x1D706}}$. All the results correspond to
 $a=1$, except the dashed lines in (c) that are pertinent to
 $a=0.5$.

In figure 18(b), the effect of the soft layer thickness on the distribution of the dimensionless mean concentration is shown. It is observed that the solute band transfers much faster along the channel for a thicker PEL. This is consistent with the results of figure 6(a) in which the convection parameter  $K_{1}$ increases with increasing
 $l$.
The effect of the initial solute distribution on band broadening is studied in figure 18(c). For a better illustration of the movement of the solute band, its centre of mass is evaluated via the formula  $z_{g}=\int _{0}^{\infty }zc_{m}(z,t)\,\text{d}z/\!\int _{0}^{\infty }c_{m}(z,t)\,\text{d}z$. Since, according to figure 5, the convection coefficient for
 $a=0.5$ is higher than that of
 $a=1$ at initial times,
 $z_{g}$ is larger for the former, implying that the solute band moves faster when the solute injection is more concentrated in the central area. However, as
 $K_{1}$ ultimately becomes independent of the initial distribution, the discrepancy between the values of
 $z_{g}$ for different
 $a$ gradually becomes constant and the bands move with the same speed.
The effect of the parameter  $\unicode[STIX]{x1D702}_{\unicode[STIX]{x1D706}}$ on the movement of the solute band is shown in figure 18(d). As is clear from the graphs and the values of
 $z_{g}$ provided, magnifying
 $\unicode[STIX]{x1D702}_{\unicode[STIX]{x1D706}}$ is accompanied by a reduction in the speed of the axial movement of the solute band. This is consistent with our previous deductions that the convection coefficient decreases with increasing
 $\unicode[STIX]{x1D702}_{\unicode[STIX]{x1D706}}$.
For a better illustration of the band broadening, the values of  $c_{m}(z,t)$ are this time plotted versus
 $z-z_{g}$ in figure 19 for the conditions that no adsorption occurs at the walls. It is clearly observed in panel (a) of figure 19 that the band broadening is more intense for thicker PELs while the degree of symmetry of the concentration profile reduces. A higher degree of band broadening is also observed for a thicker EDL in figure 19(b), which is consistent with the results of figure 13 revealing a larger dispersion coefficient for a smaller
 $K$.
Dimensionless mean concentration over the  $X$–
 $Y$ plane versus
 $z-z_{g}$ considering
 $w=1$,
 $\unicode[STIX]{x1D6FC}=a=1$ and
 $Da=0$ for (a)
 $K=5$,
 $\unicode[STIX]{x1D702}_{\unicode[STIX]{x1D706}}=1$ and
 $t=2$ at different
 $l$, (b)
 $l=0.1$,
 $\unicode[STIX]{x1D702}_{\unicode[STIX]{x1D706}}=1$ and
 $t=2$ at different Debye lengths and (c)
 $l=0.15$,
 $\unicode[STIX]{x1D702}_{\unicode[STIX]{x1D706}}=1$ and
 $K=5$ at different times.

Figure 19(c) shows the time development of band broadening inside the channel. At initial times (but not too close to injection where there is significant axial diffusion), due to the non-uniformity of the velocity profile and the dominance of the hydrodynamic dispersion, the solute molecules almost undergo a purely advective motion: the molecules that travel near the central area move faster than those travelling adjacent to the walls, creating a non-uniform concentration field. As time passes, due to the non-uniformity of the concentration distribution, diffusion in both the longitudinal and transverse directions becomes important. The longitudinal diffusion results in additional broadening of the solute band while the transverse diffusional mass flux tends to level out the concentration profile within any cross-section. So, as time passes, the solute band gets wider and more uniform.
The profiles of the integral of the dimensionless solute concentration over  $z$ are shown in figure 20 at different times and adsorption rates. The non-zero gradient of the concentration profile at the walls reflects the first-order reaction occurring on the surface of the microchannel. As shown, the solute concentration near the vertical wall is nearly zero in figures 20(a) and 20(c). This is because the solutes are not totally spread out over the cross-sectional area at small times such as
 $t=0.5$. As the rate of wall absorption is higher for
 $Da=10$, the solute concentration at the mid-planes is lower in figure 20(c). In addition, at initial times, when the solute dispersion is convection dominated, the concentration distributions are highly non-uniform. As observed in figures 20(b) and 20(d), the degree of non-uniformity reduces for
 $t=2$ because of the diffusion effects and the magnitude of the solute concentration is smaller with respect to time
 $t=0.5$ due to the wall adsorption effects.
Profiles of the integral of the dimensionless solute concentration over  $z$ considering
 $w=3$,
 $K=5$ and
 $\unicode[STIX]{x1D6FC}=a=\unicode[STIX]{x1D702}_{\unicode[STIX]{x1D706}}=1$ for (a)
 $Da=1$ and
 $t=0.5$, (b)
 $Da=1$ and
 $t=2$, (c)
 $Da=10$ and
 $t=0.5$ and (d)
 $Da=10$ and
 $t=2$.

The integral of the dimensionless mean concentration over  $y$ with respect to
 $z$ is plotted versus
 $x$ at different times in figure 21. The results of the numerical modelling performed by means of COMSOL Multiphysics are also presented in figure 21. It can be seen that there is a good agreement between the results, especially for times larger than 0.5. As stated previously, for higher times, the solute concentration is more uniform due to the diffusion effects.
Integral of the dimensionless mean concentration over  $y$ with respect to
 $z$ versus
 $x$ considering
 $w=3$,
 $K=5$,
 $\unicode[STIX]{x1D6FC}=a=\unicode[STIX]{x1D702}_{\unicode[STIX]{x1D706}}=1$ and
 $Da=10$. The dashed lines represent the numerical results.

4 Conclusions
The dispersion of a neutral solute band by electroosmotic flow in a PEL-covered rectangular/slit microchannel was studied under the conditions that surface adsorption occurs at the channel walls. The flow was considered to be steady and fully developed and the grafting density was considered to be low so that the same values of permittivity, viscosity and diffusivity can be considered for the inside and outside of the PEL. Utilizing the Debye–Hückel linearization, analytical solutions were obtained for electrical potential, fluid velocity and solute concentration. Special solutions were also obtained for the conditions for which there is no wall adsorption. The solute dispersion was analysed via the generalized dispersion model for arbitrary initial distribution considering three transport factors comprising the exchange, convection and dispersion coefficients. Relaxing the assumption of low electric potentials, finite-element numerical simulations were also performed the results of which were found to be in a good agreement with the predictions of the analytical solutions. Considering an initial solute distribution of square shape, a comprehensive parametric study was then conducted by paying special attention to the influences of the PEL properties, surface adsorption rate and initial solute distribution. It was observed that the exchange coefficient is a function of the time, the channel aspect ratio, the Damköhler number and the solute initial distribution. The convection and dispersion coefficients depend, besides those affecting the exchange coefficient, on the dimensionless PEL thickness, the Debye–Hückel parameter, the PEL friction factor and the ratio of PEL to characteristic Debye lengths. Even though the solute initial distribution significantly affects the transport coefficients at earlier times, its influence vanishes at later times when these coefficients take asymptotic values.
When the solute injection is limited to the core flow, the exchange coefficient increases monotonically from zero to its asymptotic value but a decreasing time dependence with a non-zero initial value was observed when the solute band occupies the whole channel height. For intermediate extents of the solute band, a non-monotonic time dependence was observed for the exchange coefficient. In addition, the long-term exchange coefficient was shown to be an increasing function of the Damköhler number and a decreasing function of the aspect ratio but it tends to limiting values at sufficiently high values of these parameters.
Similar to the exchange coefficient, the time dependence of the convection coefficient is a strong function of the initial solute distribution: it is a decreasing (an increasing) function of time when the solute band is concentrated in the core (occupies the whole channel height), while a non-monotonic trend was observed for intermediate extents of the solute band. At earlier times, the convection coefficient is larger when the solute injection is more restricted to central points. Moreover, higher values of the Damköhler number and the channel aspect ratio are accompanied by larger values of the long-term convection coefficient, whereas the opposite is true for the PEL friction factor and the Debye length ratio. The influence of the dimensionless PEL thickness on the convection coefficient is different for low and high values of the PEL friction factor: an increase in the dimensionless PEL thickness gives rise to a larger convection coefficient for small frictions, whereas a reverse or non-monotonic trend may be observed when PEL friction is significant.
Irrespective of the initial distribution, the dispersion coefficient starts from zero and, in most cases, increases monotonically up to its asymptotic value. A main exception is the cases for which the solute band initially occupies the majority of the channel height for which the dispersion coefficient may take a maximum after which it reduces to its asymptotic value. Furthermore, the long-term dispersion coefficient is an increasing function of the Debye length and the dimensionless PEL thickness and a decreasing function of the Debye length ratio, the PEL friction factor and the Damköhler number. The dependence of the long-term dispersion coefficient on the channel aspect ratio is, however, dependent on the Damköhler number: it is a decreasing function of the aspect ratio when the Damköhler number is large, whereas a non-monotonic variation is observed when the Damköhler number is moderate or small. An interesting phenomenon observed in this respect is that the long-term results for a slit geometry differ significantly from those for a rectangular microchannel of large aspect ratio in the absence of wall adsorption.
Several simplifying assumptions were considered in this paper to allow us to treat the problem analytically. One main assumption was considering the same physical properties such as permittivity, viscosity and diffusivity within and outside of the soft layer. Another important assumption was approximating the wall absorption of solute molecules by a first-order reaction formula. Recent advances in analytical modelling of electroosmotic flow in soft microchannels with high grafting densities (Sadeghi et al. Reference Sadeghi, Azari and Hardt2019) and mass transport in stratified multi-phase flows (Sadeghi Reference Sadeghi2019) have paved the way to extend the present work to cases with high grafting densities and the only remaining obstacle is the discontinuity of solute concentration at the PEL/solution interface. Relaxing the second assumption, however, requires performing of full numerical simulations because of the complicated coupling between solute concentration in the fluid and the concentration of surface-bound solutes.
Acknowledgements
The authors sincerely thank the Iran National Science Foundation (INSF) for their financial support through project no. 940017 during the course of this work.
Declaration of interests
The authors report no conflict of interest.



