Implications
Genomic selection for feed efficiency is possible with an accuracy of around 0.4. It might be possible to obtain higher accuracies through collaborations between research organisations collecting dry matter intake (DMI) data and genotyping cows. Residual feed intake (RFI) (the difference between actual and predicted intake) is the logical choice as a breeding objective if body tissue mobilisation is accounted for properly. Failure to do this may result in a deterioration in fertility by selecting for this trait as RFI is similar to energy balance. So if there is uncertainty in genetic parameters, then including DMI in the breeding objective may be preferable.
Introduction
Feed is a major component of variable costs associated with dairy systems. Therefore in order to maximise profitability, selection to improve feed efficiency is an important breeding objective for the dairy industry. However, to date very few countries include feed efficiency as a selection criterion. One reason is because feed intake is expensive to accurately measure on large numbers of cows. However, this makes feed efficiency traits ideal candidates for genomic selection as long as dry matter intake (DMI) is measured together with other traits such as milk production and live weight in a subset of genotyped animals that are representative of the commercial population. The genomic prediction equation that is derived can then be applied to other animals that have genotypes and no phenotypes (i.e. no individual measurements for DMI).
The objective of this review is to discuss and evaluate prospects for genetic improvement of feed efficiency using genomic selection and evaluate the consequences of selecting for this trait.
Definitions of feed efficiency
Feed efficiency can be calculated in many different ways; all requiring accurate measures of dry matter and nutrient intake. Recently, Berry and Crowley (Reference Berry and Crowley2013) comprehensively reviewed alternative ways of calculating feed efficiency, which they defined as being categorised into: (1) traits that are ratios and (2) residual or regression traits.
Ratio traits include feed conversion ratio such as the ratio of output (e.g. milk yield or weight gain) to feed consumed, or the inverse which is feed conversion efficiency (FCE) (Korver, Reference Korver1988). Ratio traits are popular measures of efficiency in other livestock production systems, for example pig and poultry production (Van der Steen et al., Reference Van der Steen, Prall and Plastow2005).
Residual feed intake (RFI), sometimes referred to as net feed intake, is the difference between actual and predicted DMI (Koch et al., Reference Koch, Swiger, Chambers and Gregory1963; Williams et al., Reference Williams, Pryce, Grainger, Wales, Linden, Porker and Hayes2011; Berry and Crowley, Reference Berry and Crowley2013). RFI is calculated as the residual from a regression model of DMI on various energy sinks, such as milk production and live weight (for maintenance requirements). Additional requirements such as energy required for activity and pregnancy can also be included in the calculation.
RFI is of importance because it conceptually captures variation in activity, protein turnover, digestibility and heat increment of fermentation (Herd et al., Reference Herd, Oddy and Richardson2004) and as such it is often referred to as a measure of metabolic efficiency.
RFI in growing, non-lactating, animals is relatively easy to calculate by correcting DMI for maintenance and growth requirements and is measured in a period that should be relatively stable with regard to body condition score (BCS) change. Conversely, RFI in lactating cows is complicated by additional energy contributed from mobilisation of body tissue to sustain lactation and accretion of body tissue during replenishment. Early lactation is characterised by large changes in body reserves and BCS that is the inverse of the lactation curve (Coffey et al., Reference Coffey, Simm and Brotherstone2002; Berry et al., Reference Berry, Buckley, Dillon, Evans, Rath and Veerkamp2003; Loker et al., Reference Loker, Bastin, Miglior, Sewalem, Schaeffer, Jamrozik and Osborne2011). So, ideally, the model used to calculate RFI in lactating cows should also include an adjustment for body reserves, which is usually achieved by fitting BCS and BCS change as additional covariates. In fact, the only difference between the calculation of energy balance and RFI is that the calculation of RFI often accounts for changes in body reserves, through approximations derived from BCS (Veerkamp, Reference Veerkamp1998). However, a problem with using BCS as a proxy for body reserves, is that it is a subjective assessment of body reserves, either assessed visually or manually. Therefore, it is often difficult to detect small changes in energy reserves or changes over a short time-frame. Furthermore, there is evidence suggesting that although BCS captures variation in sub-cutaneous fat depots, it is poorly correlated to inter- and intramuscular fat (Roche et al., Reference Roche, Friggens, Kay, Fisher, Stafford and Berry2009). Correctly calculating changes in BCS is particularly difficult in early lactation when cows change from negative energy balance to positive energy balance, which generally occurs at around days 40 to 80 post-partum (Veerkamp et al., Reference Veerkamp, Oldenbroek, Van der Gaast and Van der Werf2000; Coffey et al., Reference Coffey, Simm and Brotherstone2002).
Alternatively, RFI can be calculated as energy intake minus predicted energy requirements for example for maintenance, growth, production, etc. There are ‘Feeding Standards’ publications that describe the energy requirements in mathematical terms (e.g. AFRC, 1993; NRC, 2001; CSIRO, 2007). In these publications formulae for energy requirements are based on feeding, comparative slaughter and calorimetry experiments. In a pregnant lactating dairy cow, feed requirements could be calculated from the energy required for maintenance, activity, lactation, and pregnancy. Energy is also required for growth in cows that have not reached maturity, and is also needed to replenish previously mobilised tissue in a mature cow. The energy requirements for lactation can be derived from milk yield and its components, while the other traits require an estimate of live weight and distance walked.
The advantage with using the regression method to calculate RFI (compared with energy intake minus energy requirements) is that it does not assume any partial efficiencies in the conversion of energy into product. For example, there is a partial efficiency assumed in converting energy from feed into energy used for maintenance.
Selection for gross feed efficiency
Published estimates of the heritability of FCE (MJ output in milk/kg intake) in dairy cattle include: 0.37 (Van Arendonk et al., Reference Van Arendonk, Nieuwhof, Vos and Korver1991), 0.26 (Nieuwhof et al., Reference Nieuwhof, Van Arendonk, Vos and Korver1992) and 0.14 to 0.21 (Vallimont et al., Reference Vallimont, Dechow, Daubert, Dekleva, Blum, Barlieb, Liu, Varga, Heinrichs and Baumrucker2011) indicating that selection for FCE in dairy cattle is feasible. However, one of the limitations with selecting for ratio traits is that it is not possible to distinguish between high- and low-yielding cows that have proportionately the same amount of DMI for their milk yield. A better solution is to account for feed costs in a selection index for net profit so that feed requirements, calculated as net income, are subtracted from costs. This can be used to identify high yielding and efficient cows.
Some countries including Australia, New Zealand and the USA have already incorporated gross feed efficiency into their selection indices by including (among other traits) milk production in addition to live weight (or predictions of live weight).
The result of a selection index is single value (usually expressed in net profit) which is the summation of several traits each weighted by their respective index weights. The weights are derived from a model that includes the net profit or loss of selecting for each trait. Included in this calculation are predicted energy requirements derived from live weight and milk production through metabolisable energy equations. The underlying assumption is that predicted energy requirements would be similar to actual energy intake (i.e. calculated from DMI). Live weight is often predicted using linear type traits due to the lack of phenotypic records (Banos and Coffey, Reference Banos and Coffey2012). In Australia a live weight breeding value is currently predicted using chest width, body depth, and stature measurements.
Accounting for feed costs in a selection index slows down the rate of genetic gain in cow size by increasing maintenance requirements at a slower rate than milk production requirements leading to improved feed efficiency. For example, VanRaden (Reference VanRaden2004) showed that the size of USA cattle increased by 0.8 genetic standard deviations between 1990 and 2000 and predicted that selecting for reduced size in the USA index Net Merit, would reverse the genetic trend in size (−0.6 genetic standard deviations over the next decade). The genetic trend in protein yield would remain similar over the two decades (33 and 35 kg for actual 1990 to 2000 and expected genetic trend, respectively). Realised responses to selection for gross efficiency through selection on the Breeding Worth index have also been reported using New Zealand data (Harris et al., Reference Harris, Pryce and Montgomerie2007). In the 10 years before the introduction of the Breeding Worth index (1986–1996), the genetic gain in yield of milk fat plus protein and live weight was 19.7 and 15.5 kg, respectively. In the 10 years after the introduction of the Breeding Worth index, genetic gain in yield of milk fat and protein was even higher (25.1 kg), while the change in live weight had reduced to +3.1 kg.
Although unconstrained selection for production has led to larger cows, it is important to note that not all genetic correlation estimates between live weight and milk yield are positive. For example Veerkamp (Reference Veerkamp1998) reported that the published range was between −0.4 and +0.45. The strength and direction of the correlation depends on lactation stage and negative correlations are more likely to occur in early lactation (Veerkamp et al., Reference Veerkamp, Oldenbroek, Van der Gaast and Van der Werf2000). This is because body reserves are often used to sustain milk yield – indicating the relationship could be mediated by energy balance. Unsurprisingly, the genetic correlation between BCS and live weight is positive (e.g. 0.5; Pryce and Harris, Reference Pryce and Harris2006) indicating that heavier cattle have larger body fat reserves. Therefore, it could actually be advantageous to use measures of frame size to predict live weight provided they are associated with variation in maintenance costs that are independent of body fat reserves. If live weight or body size is not independent of BCS, then selection for reduced live weight in cows that already experience significant negative energy balance during part of the lactation period could increase the risk of health and fertility disorders (Veerkamp, Reference Veerkamp1998). Pryce et al. (Reference Pryce, Harris, Johnson and Montgomerie2006) demonstrated that the correlated response of BCS to selection on Breeding Worth was small and positive. This is because BCS is also a predictor of fertility, so the negative emphasis applied to live weight in Breeding Worth is actually offset by positive selection for fertility.
Selection indices such as Net Merit, Breeding Worth and the Australian Profit Ranking are unlikely to capture all the genetic variation in true feed efficiency. For example, Gibson (Reference Gibson1986) demonstrated that the genetic correlation between predicted and actual FCE was from 0.84 to 0.9 implying that there is likely to be genetic variation in metabolic efficiency that can also be selected for.
Selection for metabolic efficiency
RFI could be a useful selection criterion in breeding indices as it captures at least some of the remaining variation in feed intake not accounted for through selection for gross efficiency.
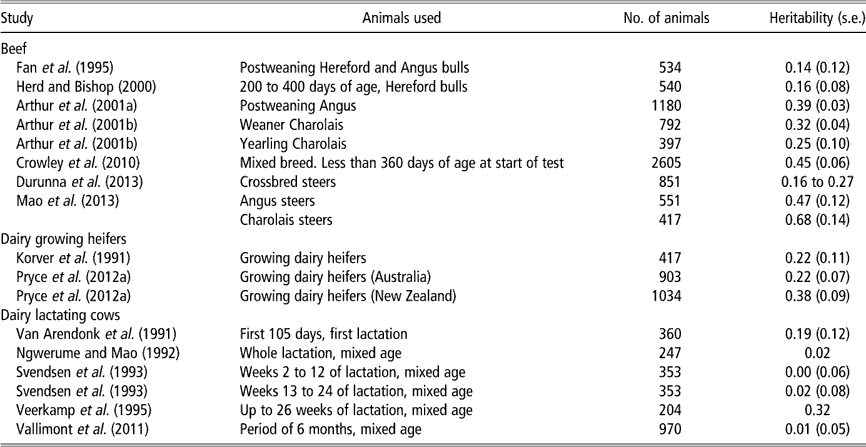
There are several published studies where RFI has been measured in growing dairy heifers and beef cattle (Table 1). In beef cattle, heritability estimates of RFI range from 0.14 to 0.68. The heritability of RFI in growing dairy heifers ranged from 0.22 to 0.38 (Korver et al., Reference Korver, van Eekelen, Vos, Nieuwhof and van Arendonk1991; Pryce et al., Reference Pryce, Arias, Bowman, Davis, Macdonald, Waghorn, Wales, Williams, Spelman and Hayes2012a).
Heritability estimates for residual feed intake in beef and dairy cattle

In lactating dairy cows, Veerkamp et al. (Reference Veerkamp, Emmans, Cromie and Simm1995) estimated that the heritability of RFI was 0.32, when RFI was calculated using a phenotypic adjustment for predicted metabolisable energy requirements (Table 1). When RFI was calculated using partial genetic regressions of energy intake on milk energy yield, metabolic live weight and live weight change, the heritability was only 0.05. However, based on a simulation exercise where RFI was calculated from distributions of feed intake, live weight and live weight change, Veerkamp et al. (Reference Veerkamp, Emmans, Cromie and Simm1995) concluded that their heritability estimate was likely to be biased downwards. The method used to estimate RFI affects the heritability estimated. It is important to correctly account for traits that contribute to predicted intake, especially live weight change. By not fully adjusting for predicted intake requirements, estimates for the heritability of RFI could be inflated. Although phenotypic correlations with the traits included in the calculation of RFI should be zero, genetic correlations might not be, therefore correcting RFI for genetic relationships is also an option. However, Herd and Bishop (Reference Herd and Bishop2000) suggested that using genetically adjusted RFI may result in real variation being ignored in the relationships between RFI and the traits used in the regression.
The range of heritability estimates of RFI in the literature and the different methods used to calculate RFI make it difficult to determine whether there is the magnitude of genetic variation required to make genetic improvement feasible in lactating dairy cattle. This is probably further complicated by dynamic changes in body condition and live weight throughout lactation. However, the heritability estimates in growing heifers and beef cattle (Table 1), that are presumably less affected by weight or BCS change are generally higher and suggest that selection for RFI is possible.
Genomic selection for feed efficiency in growing heifers
Measuring DMI is expensive because it requires specialist equipment to measure individual cow intake and some degree of manual input (at least to feed cows individually and handle feed left as refusals). Therefore, unless very cheap ways of measuring DMI are developed that can be used on commercial farms, the majority of feed intake data will probably continue to come from research herds. This makes the application of genomic selection an attractive way to extend the findings of the research outcomes to the dairy industry. Use of genomic selection is effective provided that: (1) the trait, RFI, is heritable; (2) the genomic predictions have a reliability or accuracy that is acceptable to those using the breeding values; and (3) if RFI breeding values are available on heifers, rather than cows then growing heifers’ RFI needs to be correlated to RFI in lactating cows.
Genomic selection refers to the use of genome-wide genetic markers to predict breeding values of selection candidates (Meuwissen et al., Reference Meuwissen, Hayes and Goddard2001). Genomic selection uses linkage disequilibrium between the genetic markers (commonly single nucleotide polymorphisms (SNPs)) and the actual polymorphisms that cause variation in traits (Hayes et al., Reference Hayes, Lewin and Goddard2012). A linear equation is calculated that predicts the summation of effects of many variants on the genomic estimated breeding value (GEBV) of the animal. There are several methods that have been used to calculate the accuracy of genomic prediction for feed intake and related traits (Table 2). These include genomic restricted maximum likelihood (REML) where a genomic relationship matrix (e.g. VanRaden, Reference VanRaden2009; Yang et al., Reference Yang, Benyamin, McEvoy, Gordon, Henders, Nyholt, Madden, Heath, Martin, Montgomery, Goddard and Visscher2010) is used instead of the pedigree relationship matrix in a REML analysis, here each SNP is assumed to have the same small variance. Bayes R (Erbe et al., 2012) and BayesMulti (Pryce et al., Reference Pryce, Arias, Bowman, Davis, Macdonald, Waghorn, Wales, Williams, Spelman and Hayes2012a) which are extensions of Bayesian SSVS (Verbyla et al., Reference Verbyla, Hayes, Bowman and Goddard2009), have prior knowledge that SNP effects come from a mixture of normal distributions, so they allow for some SNP have larger effects than others.
Accuracy of genomic selection of energy balance, dry matter intake and residual feed intake

The accuracy of genomic prediction is usually calculated by excluding a ‘validation’ subset of the animals from the genomic reference data set (i.e. used to calculate the genomic prediction equation). The correlation between the genomic breeding value and the true breeding value is the accuracy of selection. However, in the absence of the true breeding value (or very reliable breeding values estimated for bulls with large progeny groups), the accuracy can be approximated by calculating the correlation between the phenotype (corrected for fixed effects) and the GEBV; the accuracy is this correlation divided by the square root of the heritability of the trait (de Haas et al., Reference Hayes, Lewin and Goddard2012; Pryce et al., Reference Pryce, Arias, Bowman, Davis, Macdonald, Waghorn, Wales, Williams, Spelman and Hayes2012a; Bolormaa et al., Reference Bolormaa, Pryce, Kemper, Savin, Hayes, Barendse, Reverter, Herd, Zhang, Tier and Goddard2013).
A recent Australian and New Zealand project measured RFI in around 2000 growing Holstein heifers and genotyped them with 625 000 SNP (Pryce et al., Reference Pryce, Arias, Bowman, Davis, Macdonald, Waghorn, Wales, Williams, Spelman and Hayes2012a; Waghorn et al., Reference Waghorn, Macdonald, Williams, Davis and Spelman2012; Williams et al., 2011). A prediction equation for growing heifer RFI was derived in this data set. The accuracy of genomic selection, defined as the correlation between the GEBV for RFI and the RFI phenotype, averaged 0.37 and 0.31 for independent cross-validation data sets (birth cohorts) from Australia and New Zealand, respectively (Pryce et al., Reference Pryce, Arias, Bowman, Davis, Macdonald, Waghorn, Wales, Williams, Spelman and Hayes2012a). There were differences between the genomic prediction methods tested (genomic REML, BayesA and BayesMulti), with the highest accuracy of prediction being estimated using the Bayesian methods (0.4; Table 2).
The accuracies of genomic prediction of RFI in dairy heifers are lower than the accuracies that are commonly reported for yields of milk, fat and protein using phenotypes that are available for proven bulls, where the phenotypes are 100s or 1000s of daughter records. For example, Erbe et al. (Reference Erbe, Hayes, Matukumalli, Goswami, Bowman, Reich, Mason and Goddard2012) estimated accuracies of 0.62 and 0.49 for milk production traits in Holsteins and Jerseys in Australia. In fact, to be comparable to the estimates of Pryce et al. (Reference Pryce, Arias, Bowman, Davis, Macdonald, Waghorn, Wales, Williams, Spelman and Hayes2012a), the realised accuracies of the study of Erbe et al. (Reference Erbe, Hayes, Matukumalli, Goswami, Bowman, Reich, Mason and Goddard2012), after correcting for the heritability, are 0.78 and 0.61, respectively. The difference between the accuracies achieved for production traits versus RFI reflects the heritabilities of the traits and the availability of phenotypic data (and genotyped individuals). These are the main limitations in achieving high accuracies using genomic selection (Daetwyler et al., Reference Daetwyler, Villanueva and Woolliams2008).
Genomic selection for feed efficiency in cows
There are very few estimates of the accuracy of genomic prediction in lactating cows. Verbyla et al. (Reference Verbyla, Calus, Mulder, De Haas and Veerkamp2010) estimated that the accuracy of genomic prediction of energy balance (i.e. a closely related trait to RFI) using 10 randomly assigned cross-validation groups in 527 lactating dairy cows was 0.29 (Table 2). De Haas et al. (Reference De Haas, Calus, Veerkamp, Wall, Coffey, Daetwyler, Hayes and Pryce2012) estimated an accuracy of 0.35 for DMI in Holsteins (in a data set that included growing heifers).
Since it is cheaper to measure feed intake in growing heifers and there is no complication with lactation, it is obviously appealing to measure RFI in growing heifers rather than lactating cows using a genomic selection tool derived from growing heifers. However, as energy is used for different purposes in lactating cows compared with growing heifers, the genetic correlation between RFI in growing heifers and cows is unlikely to be very strong.
One of the few published estimates of the genetic correlation between RFI in growing heifers and lactating dairy cows is 0.58 (Nieuwhof et al., Reference Nieuwhof, Van Arendonk, Vos and Korver1992). In a small population of 74 beef females, Black et al. (Reference Black, Bischoff, Mercadante, Marquezini, Dilorenzo, Chase and Lamb2013) failed to find a significant correlation when RFI was evaluated in growing heifers and repeated as 3-year-old lactating cows. However, Arthur et al. (Reference Arthur, Renand and Krauss2001b) found that RFI in Charolais weaners and yearlings was genetically correlated (0.75±0.12). In dairy cattle, Pryce et al. (2012b and 2013) demonstrated that selection for RFI derived from measurements made in young growing heifers should lead to improvements in RFI in lactating cows. One hundred and eight Holstein heifers from Australia that were divergent for RFI were retested to determine if the difference was maintained during their first lactation. The difference in RFI between the high and low efficiency groups in growing heifers, tested at approximately 6 months of age, was 1.43kg/d. As first lactation cows the difference between the two RFI groups was 0.43 kg/d (P<0.05; Pryce et al., 2012b). Furthermore, Pryce et al. (2013) used genomic prediction equations derived from RFI phenotypes in growing heifers to predict multiparous lactating cows. The accuracies of genomic prediction were 0.27, i.e. around 68% of the accuracy achieved by validating the genomic prediction equation in growing heifers. Thus, Pryce et al. (2013) have unequivocally demonstrated that GEBVs for RFI estimated in growing heifers can be used to select for feed efficiency in lactating cows, while Pryce et al. (2012b) have shown that growing heifers that are divergent for RFI are still divergent for RFI in lactation.
Combining data from other countries
The value of a GEBV for RFI is determined by its accuracy which is how well the estimated breeding value predicts the true breeding value. As demonstrated by Daetwyler et al. (Reference Daetwyler, Villanueva and Woolliams2008), increasing the size of the reference population will increase the accuracy of the GEBV. For example, if it assumed that genomic predictions are based on 600 000 informative genetic markers for a trait with a heritability of 0.4, then a reference population of 25 000 individuals (from a population with an effective population size of 100) would be required to achieve an accuracy of 0.8. This is obviously challenging for expensive-to-measure traits such as RFI and DMI. One strategy would be to use additional records for RFI by collaborating with research organisations that also have RFI and DMI phenotypes on genotyped animals. To investigate this further, a collaboration was initiated between Australia, UK and the Netherlands that included a total of 1801 animals of which 843 were growing heifers (Australia), and 359 and 599 were lactating first lactation heifers from the UK and the Netherlands, respectively (de Haas et al., Reference De Haas, Calus, Veerkamp, Wall, Coffey, Daetwyler, Hayes and Pryce2012). In this analysis, DMI was studied as the phenotype instead of RFI. The authors demonstrated that a multi-trait model can adequately cope with traits measured in different environments and at different life stages and can lead to increases in the accuracy of up to 5.5% compared with univariate models within country (i.e. from on average 0.33 within country to 0.35 using a three-country reference population). An increase in accuracy was realised in all three countries. The average accuracy for a multi-trait model, where DMI was considered to be a different trait in each country averaged 0.35 (Table 2).
The success of the de Haas et al. (Reference De Haas, Calus, Veerkamp, Wall, Coffey, Daetwyler, Hayes and Pryce2012) study has encouraged the start of a new collaboration, called the global dry matter initiative (gDMI). Here, a total of nine countries have contributed genotypes and daily DMI data collected on lactating cows and growing heifers. The hypothesis is that by sharing data, the accuracy of genomic prediction for the member countries will be higher than those estimated within country.
Combining data from other breeds (beef)
There has been a lot of interest in genomic selection for RFI in beef breeds. The accuracies are similar to those estimated in dairy populations of similar sizes (Table 2). For example, in a data set of 721 Canadian beef steers of composites of three breeds, the accuracy of genomic prediction of RFI averaged 0.43 to 0.48 (Mujibi et al., Reference Mujibi, Nkrumah, Durunna, Stothard, Mah, Wang, Basarab, Plastow, Crews and Moore2011; Table 2). Using a larger data set of about 4000 mixed breed beef animals from Australia that had genotypes and phenotypes the accuracy of genomic prediction of RFI and DMI were similar and averaged 0.43 and 0.32, respectively (Bolormaa et al., Reference Bolormaa, Pryce, Kemper, Savin, Hayes, Barendse, Reverter, Herd, Zhang, Tier and Goddard2013).
Higher accuracies might be achieved by combining beef and dairy data sets in the same way as has been achieved through multi-country for dairy (e.g. gDMI). This has been attempted by Khansefid et al. (Reference Khansefid, Pryce, Miller and Goddard2013). These authors used a multi-breed beef data set consisting of 5614 cattle (842 Holstein heifers, 2009 Australian beef cattle and 2763 Canadian beef cattle) that had 606 096 SNP genotypes each. There was a promising increase in accuracy when animals were about the same age when phenotyped regardless of breed but, there was only a very small improvement in accuracy by combining dairy and beef data (Khansefid et al., Reference Khansefid, Pryce, Miller and Goddard2013). This is likely to be because of differences in linkage disequilibrium phases between SNPs and causative mutations across dairy and beef breeds (Khansefid et al., Reference Khansefid, Pryce, Miller and Goddard2013). Whole-genome sequence data may improve the accuracy across breed and even allow genomic prediction of combined beef and dairy for Bos taurus breeds at least (Hayes et al., Reference Hayes, Lewin and Goddard2012). This is because the accuracy is no longer limited by linkage disequilibrium between SNP and causative mutations, because the causal mutations are in the data set. However this does assume that the same underlying mutations affecting RFI are segregating in beef and dairy breeds, and this is certainly questionable.
Impact of selecting for RFI on other traits
Relationships with other traits need to be quantified before a trait can be included as a new trait in the breeding objective, preferably by estimating genetic correlations.
Fertility
Fertility of dairy cattle has declined since the 1980s, partly because breeding objectives have focussed on milk yield traits at the expense of health and fertility traits. As previously mentioned, cows that are apparently more efficient could simply be mobilising body reserves if BCS is not included in the prediction of RFI, or if BCS does not capture all the variation in body tissue mobilisation. This could have detrimental effects on fertility because there would be an indirect correlation between RFI and fertility that is actually due to body energy reserves required for re-breeding rather than efficiency. Genetic correlations between BCS and fertility are unfavourable (e.g. Pryce et al., Reference Pryce, Coffey and Simm2001; Berry et al., Reference Berry, Buckley, Dillon, Evans, Rath and Veerkamp2003; Dechow et al., Reference Dechow, Rogers, Klei, Lawlor and VanRaden2004; Bastin et al., Reference Bastin, Loker, Gengler, Sewalem and Miglior2010). BCS is generally visually or manually assessed by trained operators and only gives an approximate indication of a cow’s (sub-cutaneous) energy reserves (Roche et al., Reference Roche, Friggens, Kay, Fisher, Stafford and Berry2009). Therefore, subtle changes in body reserves are unlikely to be detected by using BCS (or BCS change). This has implications for RFI and the consequences of selecting on it.
There is limited data available on genetic correlations between RFI and fertility. In beef, Johnston et al. (Reference Johnston, Barwick, Corbet, Fordyce, Holroyd, Williams and Burrow2009) reported indirect evidence of a negative genetic correlation (−0.6) between fertility (age at puberty) in heifers and RFI measured in their paternal half-brothers for Brahman, but not for Brahman crosses (where the genetic correlation is 0.02). Vallimont et al. (Reference Vallimont, Dechow, Daubert, Dekleva, Blum, Liu, Varga, Heinrichs and Baumrucker2012) used a data set of 970 Holsteins and found unfavourable genetic correlations between RFI and three measures of fertility (daughter pregnancy rate, cow conception rate and heifer conception rate). Again low RFI (i.e. efficient) cows have poorer fertility.
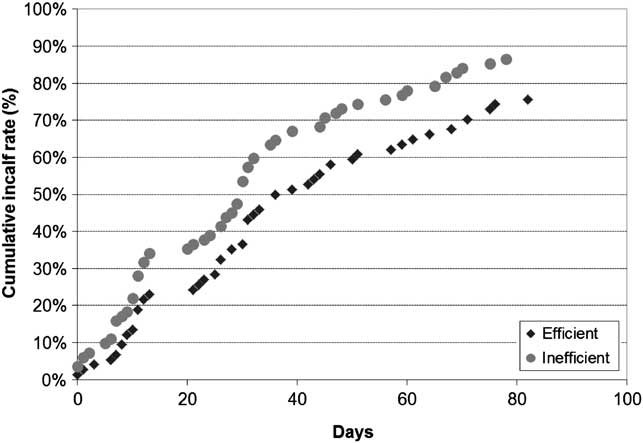
Pryce (unpublished) used a Cox proportional hazards regression model fitted to 6-week in calf rate in 157 lactation records of two lines of cows that were either high RFI (inefficient) or low RFI (efficient) as growing heifers. The difference between the lines was close to significant (P=0.054); the actual difference in 6-week in calf rate was around 10% (Figure 1). Even though the lines were established based on calf RFI, when body tissue mobilisation would have been expected to have a negligible impact on the RFI calculation, there appears to be an effect in lactating cows. However, the data set is too small to determine conclusively whether selection for RFI will have a detrimental effect on fertility. Nevertheless, unfavourable trends do exist between RFI and fertility. It is not clear whether this is due to BCS, or whether, after accounting for body reserves properly, a relationship still exists. Regardless of the reason, if RFI is to be included as part of a selection index for overall genetic merit, then genetic correlations with other traits are necessary so that the consequences of selecting on the index can be properly assessed before implementation.
Cumulative in-calf rate of cows that were identified as efficient (low RFI) or inefficient (high RFI) as calves.

Methane
Ruminants produce enteric methane as part of their fermentation processes, and the accumulation of methane in the earth’s atmosphere is linked to climate change. Enteric methane energy output per unit gross energy intake or milk energy output is negatively related to levels of milk production, energy metabolisability, and the efficiency of metabolisable energy utilisation for lactation (Yan et al., Reference Yan, Mayne, Gordon, Porter, Agnew, Patterson, Ferris and Kilpatrick2010). This supports the findings of Jones et al. (Reference Jones, Warkup, Williams and Audsley2008) who estimated that genetic improvement in UK dairy cows in the last 20 years had reduced methane emissions per unit product by about 1.3% per year, and will continue to decline over the next 15 years albeit at a slightly slower rate per year. This improvement in efficiency of dairy cows has largely been achieved though selection on production.
Selecting for reduced methane production directly may be difficult, because it is even more difficult and expensive to measure than DMI. However, selection for RFI, has been reported to lead to reductions in methane emissions (Hegarty et al., Reference Hegarty, Goopy, Herd and McCorkell2007). Similar results were reported by Nkrumah et al. (Reference Nkrumah, Okine, Mathison, Schmid, Li, Basarab, Price, Wang and Moore2006), in 27 steers they estimated a phenotypic correlation of 0.44 (P<0.05) between RFI and methane production. In dairy cattle, de Haas et al. (2011) suggested that by selecting for more efficient cows, methane production could be reduced by up to 26% over a 10-year time frame. Recently, using divergent lines of Angus cattle (high RFI and low RFI), Jones et al. (Reference Jones, Phillips, Naylor and Mercer2011) reported that phenotypic differences may not be maintained across diets that there may be an interaction with diet, as average group methane emissions between the two lines differed when the animals were fed pasture of high nutritive characteristics, but not summer pasture with lower nutritive characteristics. Developments in methane measurement technologies may soon provide sufficient phenotypic records from individual animals, which are not yet available to allow selection on this trait at present.
Feeding behaviour
There may also be an association between feeding behaviour and feed efficiency. For example, Lin et al. (Reference Lin, Macleod and Pryce2013) and Green et al. (Reference Green, Jago, Macdonald and Waghorn2013) conducted genetic and phenotypic analyses, respectively, of feeding behaviour in growing dairy heifers from Australia and New Zealand. Lin et al. (Reference Lin, Macleod and Pryce2013) found that time spent feeding was genetically correlated with both DMI and RFI in 842 growing heifers (0.48±0.12 and 0.27±0.15, respectively) in Australia and that eating rate is phenotypically associated with RFI, 0.23±0.04, which suggests that heifers that eat slowly have improved feed efficiency. This is supported by the work of Green et al. (Reference Green, Jago, Macdonald and Waghorn2013) who reported significant (phenotypic) differences between extreme animals for RFI and time spent eating. Results from 813 beef cattle have also shown that RFI is correlated to feeding duration where phenotypic and genetic correlations were 0.49 and 0.57, respectively (Nkrumah et al., Reference Nkrumah, Crews, Basarab, Price, Okine, Wang, Li and Moore2007).
Feed efficiency in the breeding objective
Breeding objectives in Australia, New Zealand and the USA include gross feed efficiency by including live weight or live weight predicted using type traits as a breeding objective; however, variation in the difference between predicted and actual feed intake is not currently captured.
A multi-trait selection index will achieve the same outcome, of higher profit per unit of feed regardless of whether DMI or RFI is used in the breeding objective, provided correlations between the traits are accurately estimated. If DMI is used as the breeding objective, then it would replace live weight in the index, while RFI should be included in addition to live weight. This is because DMI captures the feed required for maintenance and milk production, while RFI captures the variation that is independent of live weight and milk yield traits. RFI is straightforward to include in a selection index, as it is independent of the other traits. DMI would have the same economic value as RFI, except the economic values of other traits in the index, such as milk, fat and protein would need to be adjusted to avoid double-counting because feed costs are already included in estimating their economic values.
To be part of the breeding objective, genetic correlations between the new trait and all other traits in the index are required so that consequences of selection can be examined before changes are made to the breeding objective. RFI is phenotypically independent of the regressors that are used to predict it, however genetic correlations with these traits may still exist. Genetic correlations between DMI and other traits of economic importance have been estimated (Veerkamp and Brotherstone, Reference Veerkamp and Brotherstone1997; Koenen and Veerkamp, Reference Koenen and Veerkamp1998; Veerkamp, Reference Veerkamp1998; Vallimont et al., Reference Vallimont, Dechow, Daubert, Dekleva, Blum, Barlieb, Liu, Varga, Heinrichs and Baumrucker2011), however the data sets used in these studies are small and have generally focussed on relationships with milk yield and live weight. Larger data sets exist in which genetic parameters could be estimated (provided the phenotypes are available). Notably, the very large data set of the gDMI consortium measured in nine countries assembled by Berry et al. (unpublished).
One of the main risks with including either RFI or DMI in the breeding objective is being able to quantify responses to selection. Without a complete set of genetic correlations between all traits under selection, it is possible that unfavourable responses to selection will arise.
Attempts have been made to quantify the effect of including RFI and DMI in the breeding objective. Hayes et al. (Reference Hayes, van der Werf and Pryce2011) examined replacing live weight with GEBVs for RFI in the Australian Profit Ranking index and they found that this index would improve the rate of annual gain for profitability by 3.8%. Bell et al. (Reference Bell, Eckard, Haile-Mariam and Pryce2013) extended this study as a phenotypic analysis that included greenhouse gas emissions and considered DMI instead of RFI and live weight. They concluded that improving production efficiencies associated with herd survival, feed intake, somatic cell count and fertility would improve net income and reduce emissions intensity per cow and per kg milk-solids in Australian dairy systems. In both studies, genetic correlations were approximated from breeding values between sires.
If the genetic correlations between breeding objective traits are known, then the breeding objective could be extended to include RFI, which would account for variation in the difference between predicted and actual feed intake. However, if there is a risk that changes in body tissue mobilisation would only be partially accounted for then BCS breeding values should also be estimated and included in the breeding objective.
Live weight could be used to partially capture variation in gross efficiency while RFI could be used to capture the variation in metabolic efficiency. However, DMI would account for both variation in metabolic and gross efficiency and would therefore logically replace live weight in the breeding objective. Again, ideally BCS breeding values would also be estimated, as selection for reduced DMI is likely to result in a reduction in BCS because genetic correlations are generally positive (see review of Veerkamp, Reference Veerkamp1998).
Conclusions
FCE is an expensive trait to measure and therefore lends itself to genomic selection. Currently the accuracy of genomic prediction of both RFI and DMI is around 0.4. An increase in accuracy of genomic breeding values for these traits is desirable to improve the value proposition of including these traits in breeding objectives. International collaboration is an appealing way of achieving this. If genetic correlations with other traits are robust and body tissue mobilisation is accounted for properly, then RFI is a logical breeding goal choice. If there is uncertainty in either of these, then DMI may be a less risky trait to include in the breeding objective.
Acknowledgements
This review is based on an invited presentation at the 63rd Annual Meeting of the European Association for Animal Production (EAAP) held in Bratislava, Slovakia, August 2012. Jennie Pryce would like to acknowledge the American Association of Animal Science for a travel grant to attend EAAP. Members of gDMI are thanked for useful discussions. The authors are especially grateful to Mike Coffey (Scottish Rural University College, Edinburgh, UK) and Matthew Bell (University of Nottingham, Nottingham, UK) for their contributions. The Australian authors would also like to acknowledge the Gardiner Foundation, Melbourne, Australia and the Dairy Futures Co-operative Research Centre for funding DEPI’s research activities in FCE.