1. Introduction
Optimal switching theory treats the problem of finding an optimal sequence of switching times for a stochastic process with different regimes. In the classical formulation of optimal switching theory, the performance of a switching strategy is calculated as the expected value of the sum of its future (discounted) revenues, and a strategy is optimal if no other strategy performs (strictly) better. Most studies of Markovian stochastic optimization problems rely on the dynamic programming principle, so that the value function is expected to satisfy the corresponding Hamilton–Jacobi–Bellman equation. However, use of the dynamic programming principle requires a finite value function, which is not always the case for optimal switching problems exhibiting mean reversion. One way to guarantee a finite value function is to impose a finite time horizon; see, e.g., [Reference Dai, Yang, Zhang and Zhu9] and [Reference Dai, Zhang and Zhu8] for studies of trend-following strategies in this setting. While a finite horizon is justifiable in many applications, the assumption leads to (coupled) parabolic variational inequalities which lack explicit solutions. Another common approach is to impose large discount rates as in, e.g., [Reference Bayraktar and Egami3], [Reference Brekke and Øksendal6], and [Reference Duckworth and Zervos10]. One should note here that, from a financial point of view, these large discount rates do not necessarily represent the loss of value due to depreciation of one unit of currency, but should rather be viewed as a way to model the opportunity cost of an investment, or, alternatively, to model the utility of the optimizer.
In the present paper we propose a scheme based on renewal theory to study optimal strategies in two-state switching problems with infinite value. Since the value is infinite, optimality of a strategy cannot be defined in terms of the value function. Instead, we define optimality in terms of the growth rate of the expected value of the corresponding value function. The scheme is suitable for perpetual problems which exhibit time homogeneity, thereby allowing the search for optimal strategies to take place in the subclass consisting of time-homogeneous strategies. Given such a time-homogeneous strategy, renewal theory allows us to calculate the limiting growth rate, as the horizon tends to infinity, of the value function in the finite horizon problem. A strategy is then referred to as optimal if it yields the maximal limiting growth rate.
The maximization of long-term growth rates has been studied in various stochastic optimization problems. In the seminal paper, Kelly [Reference Kelly13] introduced the exponential rate of growth of capital as a measure of the performance of a gambler’s strategy. The fraction of wealth that should be bet in order to maximize the exponential rate of growth is now known as the Kelly strategy or the Kelly criterion. In [Reference Browne and Whitt7], the long-term growth rate of a portfolio choice problem under incomplete information about the underlying model is optimized, and in [Reference Akian, Sulem and Taksar1] a portfolio problem with transaction costs is studied with a similar performance criterion. In [Reference Beneš and Karatzas4] and [Reference Karatzas12], stationary versions of the stochastic control problem to track a Brownian motion by a process of finite variation were considered. An optimal switching problem arising in connection with pairs trading has been studied in [Reference Zeng and Lee16], where renewal theory was used to determine optimal stationary strategies.
In the current paper we consider the maximization of long-term growth rates of two-state switching problems; here it is natural to distinguish between two different quantities. Firstly, we consider switching problems in which the objective is to maximize the growth rate of the expected value of the underlying strategy; these are connected with a problem in two-dimensional multiplicative renewal theory. To the best of our knowledge, the renewal theory approach to such problems has not been used before. One contribution of the current paper is to show that the growth rate for a given strategy can be determined using exponential martingale theory. Secondly, we also consider switching problems in which the objective is to maximize the expected growth rate generated by the underlying strategy as in [Reference Zeng and Lee16]; these are closely connected with classical additive renewal theory, in which the long-term expected growth rate is simply given as the quotient of the expected performance over one cycle and the expected length of a cycle. This additive version of these switching problems is typically more explicit than the multiplicative version; moreover, the additive version serves as a bound for the multiplicative case.
The paper is organized as follows. In Section 2 we introduce ideas by discussing a switching problem in connection with a trading problem in the presence of a mean-reverting exchange rate. In Section 3 we describe the general procedure of our scheme from a renewal theory point of view. In Section 4 we return to the example with a mean-reverting exchange rate, and in Section 5 we study switching problems appearing in trend-following models under incomplete information. Finally, in Section 6 we make a few concluding remarks about the renewal theory approach to optimal switching.
2. A motivating example: trading in a mean-reverting exchange rate
In this section we introduce and discuss a motivating example of an agent trying to maximize her profits from trading in a mean-reverting exchange rate. This example naturally leads to a multiplicative and an additive version of a problem in two-dimensional renewal theory, which are studied in Section 3.
2.1. A switching problem in connection with mean-reverting exchange rates
Assume that the exchange rate between domestic currency and foreign currency is given by  $U(t)=\textrm{e}^{X(t)}$
, so that the cost of buying one unit of foreign currency at time t is U(t). Here, X is a mean-reverting Ornstein–Uhlenbeck process satisfying
 \begin{equation*}\textrm{d} X(t)=-\beta X(t)\,\textrm{d} t +\sigma \textrm{d} W(t)\end{equation*}
for some constants  $\beta>0$
and
 $\sigma>0$
and a standard Brownian motion W. Moreover, assume that a multiplicative transaction cost (slippage cost)
 ${\varepsilon} \in (0,1)$
is paid each time foreign currency is bought, whereas domestic currency can be bought free of charge.
Remark 1. The assumption that the level of mean reversion of X is 0 is made without loss of generality. Indeed, if instead  $U(t)=\textrm{e}^{X(t)}$
with
 \begin{equation*}\textrm{d} X(t)=(\alpha-\beta X(t))\,\textrm{d} t +\sigma \textrm{d} W(t),\end{equation*}
then the cost  $\tilde U(t)\,:\!=\textrm{e}^{-\alpha/\beta}U(t)$
of buying
 $\textrm{e}^{-\alpha/\beta}$
units of foreign currency is of the form specified above. Consequently, this more general setup is included in the analysis after a simple scaling argument. Similarly, the assumption of asymmetric slippage costs is imposed only for notational simplicity and can easily be relaxed.
We consider an agent who has an initial wealth 1 in the domestic currency, and who wishes to maximize her profit by trading in the foreign currency. The agent follows a trading strategy given by a sequence  $0=\!:\,\gamma_0\leq \tau_1\leq \gamma_1\leq \tau_2\leq\gamma_2\leq\cdots$
of stopping times (with respect to X), with the interpretation that the agent has all her capital invested in domestic currency between
 $\gamma_{k-1}$
and
 $\tau_k$
, and all her capital in foreign currency between
 $\tau_k$
and
 $\gamma_k$
. Denoting by
 $n(T)=\max \{k\,{:}\,\gamma_k\leq T\}$
the number of completed cycles before time T, the expected outcome, measured in domestic currency, of this strategy is
 \begin{align*}
J(\{(\tau_k,\gamma_k)\}_{k=1}^\infty,T) =\ &
\textrm{E}\bigg[1_{\{\tau_{n(T)+1}>T\}}(1-{\varepsilon})^{n(T)}\prod_{k=1}^{n(T)} \frac{U(\gamma_k)}{U(\tau_k)} \\
&\ \ +1_{\{ \tau_{n(T)+1}\leq T\}}(1-{\varepsilon})^{n(T)+1}\frac{U(T)}{U(\tau_{n(T)+1})}\prod_{k=1}^{n(T)} \frac{U(\gamma_k)}{U(\tau_k)}
\bigg].
\end{align*}
Here, the first term in the expected value corresponds to the situation in which the agent has her capital in domestic currency at T, and the second term corresponds to the case when all capital is in foreign currency.
Using standard methods involving dynamic programming, the problem of finding an optimal strategy can be reduced to the study of a related system of coupled variational inequalities. Since the only time dependence is through the time left to T, one expects switching boundaries that flatten out as the time horizon T increases. Due to the parabolic nature of these variational inequalities, however, there is little hope of finding an explicit solution, and one has to resort to numerical methods to determine these boundaries and their limits (if they exist). Also note that a perpetual version of the above switching problem would have an infinite value. Indeed, for any pair (a, b) with  $a<b$
and
 $b-a>\ln \frac{1}{1-{\varepsilon}}$
, the strategy given recursively by
 \begin{align}
\gamma_0 & = 0, \nonumber \\
% \begin{equation}
\tau^{ab}_k & \,:\!=\inf\{t\geq \gamma^{ab}_{k-1}\,:\,X(t)\leq a\},\\[-20pt]\nonumber\end{align}
 \vspace*{-12pt}
\begin{align}\hspace*{-6.3pt}
\gamma^{ab}_k & \,:\!=\inf\{t\geq \tau^{ab}_{k}\,:\,X(t)\geq b\},
% \end{equation}
\end{align}
 $k\geq 1$
, gives a multiplicative reward
 $(1-{\varepsilon})\textrm{e}^{b-a}>1$
over a cycle of the process X from a to b and back to a, and since the number of such cycles is infinite, the value of the perpetual problem would be infinite.
As a remedy to the problem with an infinite value function, we instead suggest looking for a strategy that maximizes the growth rate of the expected value. Utilizing the time-homogeneous nature of the problem, it suffices to optimize over time-homogeneous strategies of the form  $\{(\tau^{ab}_k,\gamma^{ab}_k)\}_{k=1}^\infty$
, where
 $\tau^{ab}_k$
and
 $\gamma^{ab}_k$
are defined as in (1) and (2). For such a strategy, define the corresponding value
 $V^{ab}(T)$
of the switching problem with horizon T by
 \begin{align*}
V^{ab}(T) &\,:\!=
\textrm{E}\bigg[\mathbf{1}_{\{\tau^{ab}_{n^{ab}(T)+1}>T\}}(1-{\varepsilon})^{n^{ab}(T)}\prod_{k=1}^{n^{ab}(T)} \frac{U(\gamma^{ab}_k)}{U(\tau^{ab}_k)} \bigg] \\
& \,\qquad +\textrm{E}\bigg[\mathbf{1}_{\{ \tau^{ab}_{n^{ab}(T)+1}\leq T \}}(1-{\varepsilon})^{n^{ab}(T)+1}\frac{U(T)}{U(\tau^{ab}_{n^{ab}(T)+1})}\prod_{k=1}^{n^{ab}(T)} \frac{U(\gamma^{ab}_k)}{U(\tau^{ab}_k)}\bigg] \\
&= \textrm{E}\Big[\mathbf{1}_{\{\tau^{ab}_{n^{ab}(T)+1}>T\}}((1-{\varepsilon})e^{b-a})^{n^{ab}(T)}\Big]\\
& \qquad + \textrm{E}\Big[\mathbf{1}_{\{\tau^{ab}_{n^{ab}(T)+1}\leq T\}} ((1-{\varepsilon})e^{b-a})^{n^{ab}(T)}(1-{\varepsilon})e^{X(T)-a} \Big],
\end{align*}
where  $n^{ab}(T)=\max \{k\,:\,\gamma^{ab}_k\leq T\}$
. Due to the multiplicative nature of the problem, it is reasonable to believe that the value
 $V^{ab}(T)$
grows exponentially in T, and we define
 $\Lambda^{ab}\,:\!=\lim_{T\to\infty}\frac{\ln V^{ab}(T)}{T}$
to be the asymptotic growth rate (if it exists). The optimal growth rate of the expected value is then defined as
 $\Lambda\,:\!=\sup_{a<b} \Lambda^{ab},$
and solving the switching problem amounts to finding both
 $\Lambda$
and a pair (a, b) such that
 $\Lambda=\Lambda^{ab}$
.
2.2. The expected growth rate
As a related problem, one may also consider the problem of maximizing the expected growth rate. In the exchange rate example, the expected growth rate of a time-homogeneous strategy  $\{(\tau^{ab}_k,\gamma^{ab}_k)\}_{k=1}^\infty$
is
 \begin{align}
\notag
\lambda^{ab}(T) & \,:\!=
\frac{1}{T}\textrm{E}\bigg[\sum_{k=1}^{n^{ab}(T)} (\ln (1-{\varepsilon})+X(\gamma^{ab}_k)-X(\tau^{ab}_k)) \\
\notag
&
\quad\qquad + \mathbf{1}_{\{ \tau^{ab}_{n^{ab}(T)+1}\leq T \}}(\ln (1-{\varepsilon})+X(T)-X(\tau^{ab}_{n^{ab}(T)+1}))\bigg] \\
%\notag
& = \frac{\ln (1-{\varepsilon})+b-a}{T}\textrm{E}\left[n^{ab}(T) \right]
+\frac{1}{T}\textrm{E}\Big[\mathbf{1}_{\{ \tau^{ab}_{n^{ab}(T)+1}\leq T \}} \left(\ln (1-{\varepsilon})+X(T)-a\right)\Big],
\end{align}
and we define  $\lambda^{ab}\,:\!=\lim_{T\to\infty}\lambda^{ab}(T)$
(again, if it exists). To solve the problem of maximizing the expected growth rate, we need to determine both
 $\lambda\,:\!= \sup_{a<b} \lambda^{ab}$
and a pair (a, b) such that
 $\lambda=\lambda^{ab}$
.
In both problems described above, if the difference  $b-a$
is large, each cycle of the process X yields a large reward (a multiplicative reward
 $(1-{\varepsilon})e^{b-a}$
in the first case, and an additive reward
 $\ln (1-{\varepsilon})+b-a$
in the second case), but, on the other hand, it will take a long time to complete each cycle. Hence, the agent faces a trade-off between size of rewards and time between them when constructing an optimal strategy. In the sections below we give the solution of the above problems using renewal theory.
Remark 2. We assume that all money at each time point is either in domestic currency or in foreign currency. This assumption is no restriction in the first problem described above (maximization of the growth rate of the expected value) since an optimal strategy would automatically be of this type. However, in the second problem (maximization of the expected growth rate) this is a simplifying assumption and a full treatment of the problem, allowing for any fraction of the wealth being invested in the two currencies, would yield a different (and larger) expected growth rate.
3. Some background on renewal theory
In this section we provide details of two problems in two-dimensional renewal theory. For the multiplicative version, we have not been able to find appropriate references in the existing literature, and we thus provide a full proof of the main result, Theorem 1, based on martingale theory. We also discuss the additive version, which is well understood (see [Reference Gut and Janson11] or [Reference Asmussen2]), but for the convenience of the reader we state the result that we need in Theorem 2.
3.1. The multiplicative version
Assume that  $\{(\Delta_k,Y_k)\}_{k=1}^\infty$
forms an independent and identically distributed (i.i.d.) sequence of two-dimensional random variables (we allow for dependence within a pair
 $(\Delta_k,Y_k)$
) with
 $\Delta_k> 0$
and
 $Y_k>0$
almost surely,
 $\textrm{E}[\Delta_k]<\infty$
and
 $1<\textrm{E}[ Y_k ]<\infty$
, and set
 $T_0=0$
and
 $T_k\,:\!=\sum_{i=1}^k \Delta_i$
. With the interpretation that
 $Y_k$
represents a multiplicative reward between
 $T_{k-1}$
and
 $T_k$
, the number
 $n(T)=\max\{k\,:\,T_k\leq T\}$
represents the number of rewards received until time T, and
 $\prod_{k=1}^{n(T)}Y_k$
represents the total (multiplicative) reward until time T. Moreover, the growth rate of the expected reward up to time T is defined by
 \begin{equation*}\Lambda(T)=\frac{\ln\big(\textrm{E}\big[\prod_{k=1}^{n(T)}Y_k\big]\big)}{T}.\end{equation*}
To determine  $\Lambda\,:\!=\lim_{T\to\infty}\Lambda(T)$
, i.e. the long-term growth rate of the expected reward, define
 $r> 0$
as the unique value such that
 \begin{equation}
\textrm{E}[Y_k\textrm{e}^{-r \Delta_k}]=1.
\end{equation}
Note that the existence of a positive r satisfying (4) is clear since we assume that  $\textrm{E}[Y_k]> 1$
and
 $\Delta_k>0$
. Also note that the process M defined by
 $M_0=1$
and
 \begin{equation*}M_n=\textrm{e}^{-r T_n}\prod_{k=1}^nY_k, \qquad n\geq 1,\end{equation*}
is a discrete-time martingale.
Theorem 1. The long-term growth rate of the expected reward,  $\Lambda\,:\!=\lim_{T\to\infty}\Lambda(T)$
, exists and satisfies
 $\Lambda=r$
, where r is defined in (4).
Proof. We first claim that
 \begin{equation}
\lim_{T\to\infty}\frac{\textrm{E}\big[\prod_{k=1}^{n(T)}Y_k\big]}{\textrm{e}^{aT}}=
\left\{\begin{array}{ll}0 & \quad \mbox{if }a>r,\\
\infty & \quad \mbox{if }a<r.\end{array}\right.
\end{equation}
To prove (5), approximate  $(\Delta_k,Y_k)$
by
 $(\Delta_k^C,Y_k^C)\,:\!=(\Delta_k\wedge C,Y_k\vee \frac{1}{C})$
, where
 $C>0$
is a large constant (to be further specified below), and define
 $r_C\geq 0$
so that
 $\textrm{E}\big[Y_k^C\textrm{e}^{-r_C \Delta_k^C}\big]=1.$
Then
 $r_C$
is non-increasing in C,
 $r_C\geq r$
, and
 $r_C\to r$
as
 $C\to\infty$
. Consider the martingale
 $M^C$
defined by
 $M^C_0=1$
and
 \begin{equation*}M^C_n=\textrm{e}^{-r_C T_n^C}\prod_{k=1}^nY^C_k,\qquad n\geq 1,\end{equation*}
where  $T^C_n=\sum_{k=1}^n\Delta^C_k$
,
 $n\geq 1$
. For a given constant
 $a>r$
, choose C large enough so that
 $a>r_C\geq r$
. Then, with
 $\tau(T)\,:\!=n(T)+1$
,
 \begin{eqnarray*}
\textrm{E}\Big[\prod_{k=1}^{n(T)}Y_k\Big]\ &\leq&\ \textrm{E}\Big[\prod_{k=1}^{n(T)}Y^C_k\Big]\\[3pt]
&\leq&\ C\textrm{E}\Big[\prod_{k=1}^{\tau(T)}Y^C_k\Big]\\[3pt]
&=&\ C\textrm{E}\big[M^C_{\tau(T)}\textrm{e}^{r_C T^C_{\tau(T)}}\big]\\[3pt]
&\leq&\ C\textrm{E}\big[M^C_{\tau(T)}\textrm{e}^{r_C(T+C)}\big]\\[3pt]
&\leq&\ C\textrm{e}^{r_C(T+C)},
\end{eqnarray*}
where the last inequality follows by optional sampling ( $\tau(T)=\min\{k\,:\,T_k>T\}$
is a stopping time and
 $M^C$
is a lower-bounded martingale, hence a supermartingale if time
 $n=\infty$
is included). Since
 $a>r_C$
, this proves the first part of (5).
To prove the second part of (5), let  $D>1$
be a large constant, and define
 $Y^D_k\,:\!=Y_k\wedge D$
. Let
 $r_D$
be the constant defined by
 $\textrm{E}\big[Y_1^D\textrm{e}^{-r_D \Delta_1}\big]=1,$
and note that
 $r_D\leq r$
. Let the martingale
 $M^D$
be defined by
 $M^D_0=1$
and
 \begin{equation*}M^D_n=\textrm{e}^{-r_DT_n}\prod_{k=1}^n Y_k^D,\qquad n\geq 1.\end{equation*}
For a given  $a<r$
, we take D large enough so that
 $a<r_D\leq r$
. Then, again considering the stopping time
 $\tau(T)\,:\!=n(T)+1$
,
 \begin{eqnarray*}
\textrm{E}\Big[\prod_{k=1}^{n(T)}Y_k\Big]\ &\geq&\ \textrm{E}\Big[\prod_{k=1}^{n(T)}Y_k^D\Big]\\
&\geq&\ \frac{1}{D}\textrm{E}\Big[\prod_{k=1}^{\tau(T)}Y_k^D\Big]\\
&\geq&\ \frac{\textrm{e}^{r_DT}}{D}\textrm{E}\big[M^D_{\tau(T)}\big]=\frac{\textrm{e}^{r_DT}}{D},
\end{eqnarray*}
where the equality comes from an appropriate version of the optional sampling theorem (see, e.g., [Reference Asmussen2, page 362, Corollary 4.1]). Since  $r_D>a$
, this finishes the proof of (5).
Finally, we check that (5) implies
 \begin{equation}
\lim_{T\to\infty}\Lambda(T)=r.
\end{equation}
To do that, let  $a>r$
and note that (5) implies that
 \begin{equation*}\textrm{E}\Big[\prod_{k=1}^{n(T)}Y_k \Big]\leq \textrm{e}^{aT}\end{equation*}
for  $T\geq T_0$
for some
 $T_0$
. Consequently, for large T,
 \begin{equation*}\ln \textrm{E}\Big[\prod_{k=1}^{n(T)}Y_k \Big]\leq aT,\end{equation*}
which implies
 \begin{equation*}\limsup_{T\to\infty} \frac{\ln \textrm{E}\left[\prod_{k=1}^{n(T)}Y_k \right]}{T}\leq a.\end{equation*}
Since  $a>r$
was arbitrary, we find that
 \begin{equation}
\limsup_{T\to\infty} \frac{\ln \textrm{E}\left[\prod_{k=1}^{n(T)}Y_k \right]}{T}\leq r.
\end{equation}
A similar argument gives
 \begin{equation*}\liminf_{T\to\infty} \frac{\ln \textrm{E}\left[\prod_{k=1}^{n(T)}Y_k \right]}{T}\geq r,\end{equation*}
which together with (7) proves (6). This completes the proof.\hfill $\square$
3.2. The additive version
Assume that  $\{(\Delta_k,Z_k)\}_{k=1}^\infty$
forms an i.i.d. sequence of two-dimensional random variables such that
 $\Delta_k> 0$
almost surely,
 $\textrm{E}[\Delta_k]<\infty$
, and
 $\textrm{E}[\vert Z_k\vert ]<\infty$
. Setting
 $T_0=0$
and
 $T_k\,:\!=\sum_{i=1}^{k}\Delta_i$
, and with the interpretation that
 $Z_k$
represents an additive reward between time
 $T_{k-1}$
and
 $T_k$
, the number
 $n(T)=\max\{k\,:\,T_k\leq T\}$
represents the number of rewards that have been received until time T, and
 $\sum_{k=1}^{n(T)}Z_k$
represents the total reward until time T. We denote by
 \begin{equation*}\lambda(T) \,:\!=\frac{1}{T}\textrm{E}\Big[\sum_{k=1}^{n(T)}Z_k\Big]\end{equation*}
the growth rate of the expected reward up to time T.
The following result is the so-called renewal reward theorem (see, e.g., [Reference Ross15, Theorem 3.6.1]).
Theorem 2. The long-term growth rate of the expected reward  $\lambda\,:\!=\lim_{T\to\infty}\lambda(T)$
exists and is given by
 \begin{equation*}\lambda=\frac{\textrm{E}[Z_k]}{\textrm{E}[\Delta_k]}.\end{equation*}
Remark 3. Note that Theorems 1 and 2 also hold if the first pair  $(\Delta _1,Y_1)$
(
 $(\Delta_1,Z_1)$
, respectively) has a distribution different from, but independent of, the one common for
 $(\Delta _k,Y_k)$
(
 $(\Delta _k,Z_k)$
), where
 $k\geq 2$
. This situation arises, for example, if we start observing the process at a time different from a renewal time, and results in a so-called delayed renewal reward process.
3.3. Comparison between the additive version and the multiplicative version
In the examples in Sections 2, 4, and 5 we consider both the additive versions and the multiplicative versions of two trend-following problems. In these examples, we have the relation  $Y_k=\textrm{e}^{Z_k}$
, where
 $Z_k$
represents the additive reward and
 $Y_k$
represents the multiplicative reward during the kth period.
Proposition 1. Assume that  $Y_k=\textrm{e}^{Z_k}$
. Then the additive growth rate
 $\lambda$
and the multiplicative growth rate
 $\Lambda$
satisfy
 $\lambda\leq \Lambda$
.
Proof. It is immediate from Jensen’s inequality that
 \begin{equation*}\lambda(T)=\frac{1}{T}\textrm{E}\Big[\sum_{k=1}^{n(T)}Z_k\Big]\leq \frac{\ln\big(\textrm{E}\big[\Pi_{k=1}^{n(T)}Y_k\big]\big)}{T} =\Lambda(T)\end{equation*}
for all T, and hence  $\lambda\leq\Lambda$
.\hfill $\square$
4. Optimal currency trading
In this section we continue to study the motivating example of Section 2. Thus we assume that an exchange rate is given by  $U(t)=\textrm{e}^{X(t)}$
, where X is a mean-reverting Ornstein–Uhlenbeck process satisfying
 $\textrm{d} X(t)=-\beta X(t)\,\textrm{d} t +\sigma \textrm{d} W(t)$
for some constants
 $\beta>0$
and
 $\sigma>0$
, and that a multiplicative transaction cost
 ${\varepsilon}\in (0,1)$
is paid each time foreign currency is bought. Moreover, a trader following the strategy (a, b) makes the multiplicative profit
 $Y^{ab}=(1-{\varepsilon})\textrm{e}^{b-a}$
for each cycle of X from a to b and back to a again.
4.1. Maximizing the growth rate of the expected value
We first continue the study of the multiplicative version introduced in Section 2.1 above. As before, denote by  $\Delta^{ab}$
the cycle time from a to b and back to a again. By Theorem 1 and the remark following Theorem 2, the growth rate of the expected value for the strategy (a, b) is given by
 $\Lambda^{ab}$
, which is implicitly defined by the relation
 \begin{equation}
\textrm{E}_a\big[\textrm{e}^{-\Lambda^{ab} \Delta^{ab}}\big]=\frac{1}{1-\varepsilon}\textrm{e}^{-(b-a)}.
\end{equation}
The optimal growth rate is then obtained by optimizing  $\Lambda^{ab}$
over strategies (a, b), i.e.
 $\Lambda\,:\!=\sup_{(a,b)}\Lambda^{ab}.$
We also introduce the maximal symmetric growth rate as
 $\Lambda^{sym}\,:\!=\sup_{b}\Lambda^{-b,b},$
and note that
 $\Lambda\geq \Lambda^{sym}$
.
In Lemma 1 below we provide conditions under which, for a given distance  $k=b-a$
and
 $L>0$
, the function
 \begin{equation}
f(a)\,:\!= \textrm{E}_{a}\big[\textrm{e}^{-L \Delta^{a,a+k}}\big]
\end{equation}
attains its maximum for  $a=-k/2$
, i.e. for a symmetric strategy
 $({-}b,b)$
.
Lemma 1. For any  $L\geq \beta,$
the function f in (9) attains its maximum for
 $a=-k/2$
.
Proof. For a given  $L>0$
(we will restrict to
 $L\geq\beta$
below), let
 $\Psi\,:\,{\mathbb R}\to[0,\infty)$
be the increasing fundamental solution of
 \begin{equation*}\frac{\sigma^2}{2}\Psi''-\beta x\Psi'-L\Psi=0,\end{equation*}
see [Reference Borodin and Salminen5, pages 18–19]. The function  $\Psi$
is then unique if we also let
 $\Psi(0)=1$
. Moreover, the corresponding decreasing fundamental solution is given by
 $\Phi(x)=\Psi(-x)$
.
By independence,
 \begin{equation*}\textrm{E}_a\big[\textrm{e}^{-L \Delta^{a,a+k}}\big]=\textrm{E}_a\big[\textrm{e}^{-L \tau_{a+k}}\big]\textrm{E}_{a+k}\big[\textrm{e}^{-L \tau_a}\big],\end{equation*}
where  $\tau_a$
and
 $\tau_{a+k}$
are the first hitting times of the levels a and
 $a+k$
, respectively. Therefore,
 \begin{equation*}f(a)=\frac{\Psi(a)}{\Psi(a+k)}\frac{\Phi(a+k)}{\Phi(a)}=
\frac{\Psi(a)\Psi(-a-k)}{\Psi(a+k)\Psi(-a)}.\end{equation*}
Introducing  $v(x)\,:\!=\ln\Psi(x)$
, we thus want to prove that
 \begin{equation}
v(a+k)-v(a) + v(-a)-v(-a-k)\geq 2 (v(k/2)-v(-k/2));
\end{equation}
by symmetry, it suffices to prove (10) for all  $a\geq -k/2$
.
However, by Lemma 2 below, the function v ′ is convex provided  $L\geq \beta$
. Therefore,
 \begin{equation}
v'(x+a+k/2) + v'(x-a-k/2)\geq 2v'(x).
\end{equation}
Integrating (11) over the region  $-k/2\leq x\leq k/2$
gives (10), completing the proof.\hfill $\square$
Lemma 2. Assume that  $L\geq \beta$
. Then the function v′ is convex.
The proof of Lemma 2 is given in the Appendix.
A consequence of Lemma 1 is that if there exists at least one strategy (a, b) for which  $\Lambda^{ab}\geq \beta$
, then
 $\Lambda=\Lambda^\textrm{sym}$
. In particular, if
 $\Lambda^\textrm{sym}>\beta$
, then
 $\Lambda=\Lambda^\textrm{sym}$
. In view of this, we now restrict our attention to symmetric strategies of the form
 $(-b,b)$
. Whether the equality
 $\Lambda=\Lambda^\textrm{sym}$
holds or not for
 $\Lambda < \beta$
is left for future studies.
Consider now the function f(L, b) defined by
 \begin{equation*}f(L,b)=\frac{\int_0^{\infty} u^{\delta-1}\exp\{-\alpha bu-u^2/2\}\,\textrm{d} u}{\int_0^{\infty} u^{\delta-1}\exp\{\alpha bu-u^2/2\}\,\textrm{d} u}-\sqrt{\frac{1}{1-\varepsilon}}\textrm{e}^{-b},\end{equation*}
where  $\alpha=\sqrt{2\beta}/\sigma$
and
 $\delta=L/\beta$
.
Theorem 3. Given  $b>\frac{1}{2}\ln\frac{1}{1-{\varepsilon}},$
there is a unique
 $L=L(b)$
such that
 $f(L,b)=0,$
and L(b) has a maximum at some point in
 $\big(\frac{1}{2}\ln\frac{1}{1-{\varepsilon}},\infty\big)$
. Denote the point at which L(b) is maximal by
 $b^*$
. Then the strategy
 $(-b^*,b^*)$
is the optimal symmetric strategy, and
 $\Lambda^\textrm{sym}=L(b^*)$
is the corresponding optimal symmetric growth rate. Moreover, if
 $L(b^*)\geq \beta,$
then
 $\Lambda=\Lambda^\textrm{sym}=\break L(b^*)$
.
Proof. Denoting by  $\tau_b$
the first hitting time of b, it is well known (see, e.g., [Reference Borodin and Salminen5, pages 18–19]) that
 \begin{equation*}\textrm{E}_x\left[\textrm{e}^{-L\tau_b}\right]=\left\{\begin{array}{ll}
\frac{\Psi(x)}{\Psi(b)} &\quad x\leq b,\\[5pt]
\frac{\Psi(-x)}{\Psi(-b)} &\quad x\geq b,\end{array}\right.\end{equation*}
where
 \begin{equation*}\Psi(x)=\frac{\int_0^{\infty} u^{\delta-1}\exp\{\alpha xu-u^2/2\}\,\textrm{d} u}{\int_0^{\infty} u^{\delta-1}\textrm{e}^{-u^2/2}\,\d u}.\end{equation*}
By independence,
 \begin{equation*}\textrm{E}_{-b}\big[\textrm{e}^{-L \Delta^{-b,b}}\big]=\textrm{E}_{-b}\big[\textrm{e}^{-L\tau_b}\big]\textrm{E}_b\big[\textrm{e}^{-L \tau_{-b}}\big]\end{equation*}
and relation (8), which implicitly defines the growth rate  $\Lambda^{-b,b}$
associated with a strategy
 $(-b,b)$
, therefore simplifies to
 $f(\Lambda^{-b,b},b)=0$
. Since
 \begin{equation*}f(L,b)=\textrm{E}_{-b}\big[\textrm{e}^{-L\tau_b}\big]-\sqrt{\frac{1}{1-\varepsilon}}\textrm{e}^{-b},\end{equation*}
f is strictly decreasing in L. Since  $f(0,b)>0$
and
 $f(\infty,b)<0$
for
 $b>\frac{1}{2}\ln\frac{1}{1-{\varepsilon}}$
, there exists a unique
 $L=L(b)$
such that
 $f(L(b),b)=0$
.
Also note that L(b) is strictly positive on  $\big(\frac{1}{2}\ln\frac{1}{1-{\varepsilon}},\infty\big)$
. It is straightforward to check that
 $f\big(0,\frac{1}{2}\ln\frac{1}{1-{\varepsilon}}\big)=0$
and that
 $L\big(\frac{1}{2}\ln\frac{1}{1-{\varepsilon}}\big)=0$
. Moreover, for any
 $L>0$
,
 \begin{eqnarray*}
\textrm{e}^b\textrm{E}_{-b}\big[\textrm{e}^{-L\tau_b}\big]\ &=&\ \textrm{e}^b\frac{\Psi(-b)}{\Psi(b)}\leq \textrm{e}^b\frac{\Psi(0)}{\Psi(b)}\\[4pt]
&=&\ \frac{\int_0^{\infty} u^{\delta-1}\textrm{e}^{-u^2/2}\,\textrm{d} u}{\textrm{e}^{-b}\int_0^{\infty} u^{\delta-1}\exp\{\alpha bu-u^2/2\}\,\textrm{d} u}\\[4pt]
&\leq&\ \frac{\int_0^{\infty} u^{\delta-1}\textrm{e}^{-u^2/2}\,\textrm{d} u}{\textrm{e}^{-b}\int_{2\alpha^{-1}}^{\infty} u^{\delta-1}\exp\{\alpha bu-u^2/2\}\,\textrm{d} u}\\[4pt]
&\leq&\ \frac{\int_0^{\infty} u^{\delta-1}\textrm{e}^{-u^2/2}\,\textrm{d} u}{\textrm{e}^{b}\int_{2\alpha^{-1}}^{\infty} u^{\delta-1}\textrm{e}^{-u^2/2}\textrm{d} u}\to 0
\end{eqnarray*}
as  $b\to\infty$
, which implies that
 $L(b)\to 0$
as
 $b\to\infty$
. Hence, by continuity, L(b) attains its maximum at some point
 $b^*\in\big(\frac{1}{2}\ln\frac{1}{1-{\varepsilon}},\infty\big)$
, which finishes the proof of the first part.
Finally, the last statement is an immediate consequence of Lemma 1, which completes the proof.\hfill $\square$
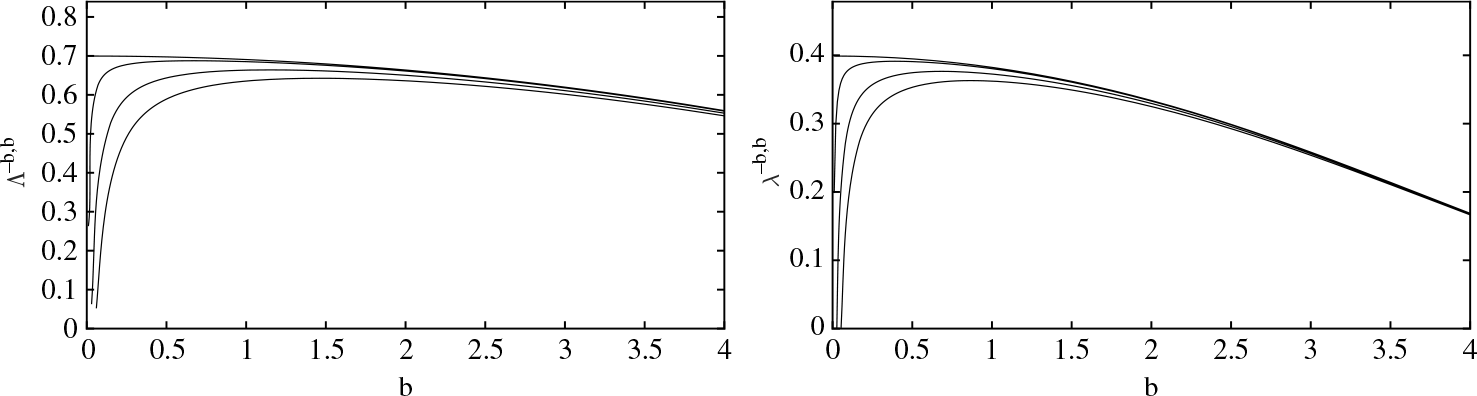
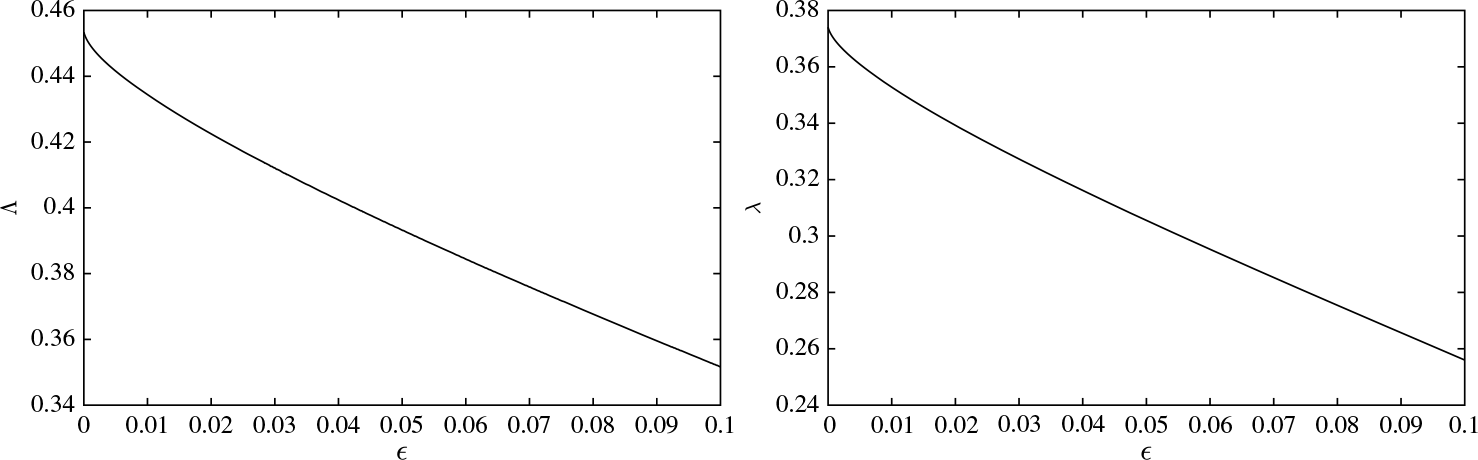
For a graphical illustration of how the symmetrical growth rate  $\Lambda^{-b,b}$
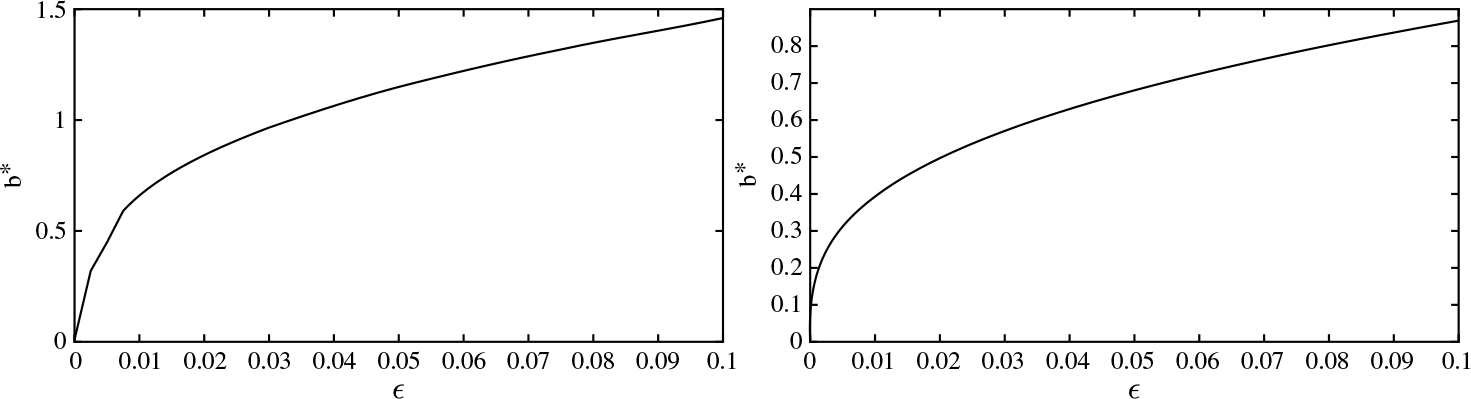
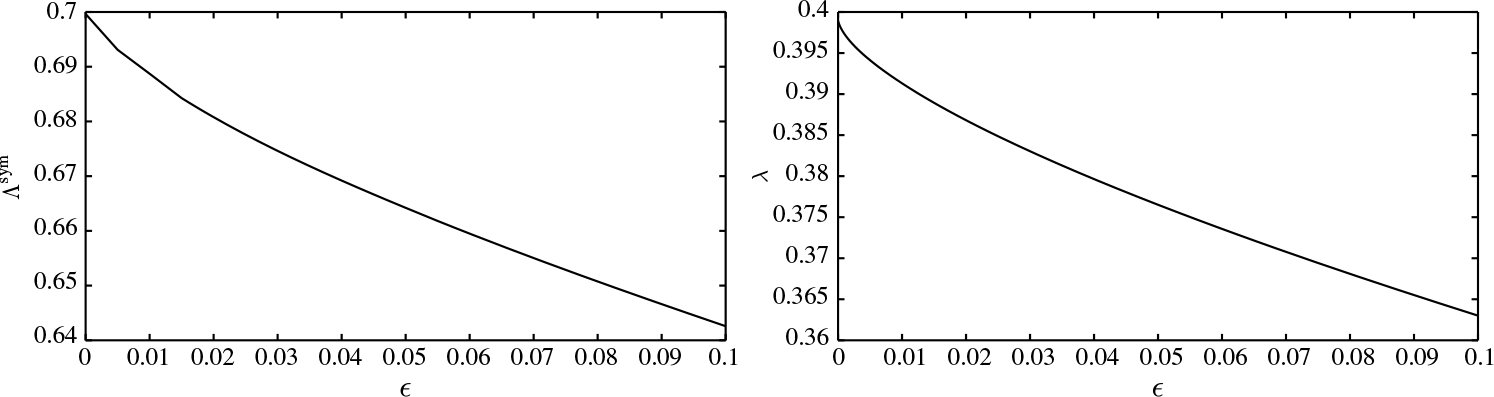
varies with b for different transaction costs, see Figure 1 (left). Figures 2 (left) and 3 (left) show how the optimal threshold
 $b^*$
and the optimal growth rate
 $\Lambda$
vary with the slippage cost
 ${\varepsilon}$
, respectively.
A plot of  $\Lambda^{-b,b}$
(left) and
 $\lambda^{-b,b}$
(right) for
 $\varepsilon =[0, 0.01, 0.05, 0.10]$
. The parameters are
 $\beta =0.5$
and
 $\sigma=2$
. Note that
 $\Lambda^\textrm{sym} \geq \beta$
in this setting and hence
 $\Lambda=\Lambda^\textrm{sym}$
.

The optimal threshold  $b^*$
for the multiplicative version (left) and for the additive version (right) as a function of the slippage cost
 ${\varepsilon}$
. The remaining parameters are as in Figure 1.


4.2. Maximizing the expected growth rate
We now continue the study of the additive version suggested in Section 2.2. Denote by  $\Delta^{ab}$
the time it takes for the process X, started at a, to reach b and then return to a. Then
 $\textrm{E}[\Delta^{ab}]=\textrm{E}_a[\tau_b] + \textrm{E}_b[\tau_a]$
. Next, let
 \begin{equation*}u(x)\,:\!=\frac{2}{\sigma^2}\int_x^b\int_{-\infty}^y \frac{\varphi(y)}{\varphi(z)}\,\textrm{d} z\,\textrm{d} y,\end{equation*}
where  $\varphi(y)=\exp\left\{\beta y^2/\sigma^2\right\},$
and note that
 \begin{equation*}\left\{\begin{array}{ll}
\frac{\sigma^2}{2}u''-\beta xu'+1=0, & \quad x<b,\\
u(b)=0.\end{array}\right.\end{equation*}
It is then straightforward to check that  $u(x)=\textrm{E}_x[\tau_b]$
(with a similar result for
 $\textrm{E}_x[\tau_a]$
). Consequently,
 \begin{eqnarray}
\textrm{E}[\Delta^{ab}]\ &=&\ \frac{2}{\sigma^2}\int_a^b\int_{-\infty}^y \frac{\varphi(y)}{\varphi(z)}\,\textrm{d} z\,\textrm{d} y +
\frac{2}{\sigma^2}\int_a^b\int^{\infty}_y \frac{\varphi(y)}{\varphi(z)}\,\textrm{d} z\,\textrm{d} y\\[-25pt]\nonumber\end{eqnarray}
 \begin{eqnarray}
\notag
&\ \ \ \ \ =\ &\frac{2}{\sigma^2}\int_a^b\int_{-\infty}^{\infty} \frac{\varphi(y)}{\varphi(z)}\,\textrm{d} z\,\textrm{d} y=\frac{2\sqrt{\pi}}{\sigma \sqrt{\beta}}
\int_a^b \varphi(y)\,\textrm{d} y,
\end{eqnarray}
where we used that
 \begin{equation*}\int_{-\infty}^{\infty} \textrm{e}^{-x^2}\,\textrm{d} x=\sqrt{\pi}.\end{equation*}
By (3) and Theorem 2, the long-term expected growth rate of a strategy (a, b) is given by
 \begin{equation}
\lambda^{ab}=\frac{\ln((1-{\varepsilon})e^{b-a})}{\textrm{E}[\Delta^{ab}]}=\frac{\ln(1-{\varepsilon})+b-a}{\textrm{E}[\Delta^{ab}]}.
\end{equation}
Theorem 4. Let  $b^*$
be the unique positive solution of
 \begin{equation}
2\int_0^b \varphi(y)\,\textrm{d} y=(2b+\ln (1-{\varepsilon}))\varphi(b),
\end{equation}
and set
 \begin{equation*}\lambda\,:\!= \frac{\sigma \sqrt{\beta}}{2\sqrt{\pi} \varphi(b^*)}.\end{equation*}
Then the strategy  $(a,b)\,:\!=(-b^*,b^*)$
is optimal in (13), and
 $\lambda$
is the corresponding optimal expected growth rate.
Proof. It is clear from (12) that for a given distance  $k>0$
between a and b the mean cycle time
 $\Delta^{ab}=\Delta^{b-k,b}$
is minimized at
 $b=k/2$
. Consequently, the quotient
 $\lambda^{ab}$
in (13) is maximized for
 $a=-b$
, and we are thus left to maximize
 \begin{equation*}
\lambda(b)\,:\!=\lambda^{-b,b}=\frac{\sigma \sqrt{\beta}(2b+\ln(1-{\varepsilon}))}{4\sqrt{\pi} \int_0^b
\varphi(y)\,\textrm{d} y }
\end{equation*}
over  $b\geq 0$
. Note that
 $\lambda(0+)=-\infty$
,
 $\lambda(\infty)=0$
, and
 $\lambda(b)> 0$
for all
 $b> \frac{1}{2}\ln\frac{1}{1-{\varepsilon}}$
, so by continuity,
 $\lambda(b)$
has a maximum. Moreover, the first-order condition
 $\lambda'(b)=0$
gives the equation (14). Equation (14) has a unique positive solution since the function
 \begin{equation*}f(b)\,:\!=2\int_0^b \varphi(y)\,\textrm{d} y-(2b+\ln (1-{\varepsilon}))\varphi(b)\end{equation*}
satisfies  $f(0)>0$
,
 $f'(b)\geq 0$
for
 $b\in\big(0,\frac{1}{2}\ln\frac{1}{1-{\varepsilon}}\big)$
and
 $f'(b)<0$
for
 $b\in\big(\frac{1}{2}\ln\frac{1}{1-{\varepsilon}},\infty\big)$
with
 $f'(b)\to-\infty$
as
 $b\to\infty$
. Hence the solution of (14) gives the maximal expected growth rate.
Finally, the maximal expected growth rate is given by
 \begin{equation*}\lambda(b^*)=\frac{\sigma \sqrt{\beta}(2b^*+\ln(1-{\varepsilon}))}{4\sqrt{\pi} \int_0^{b^*} \varphi(y)\,\textrm{d} y }=
\frac{\sigma \sqrt{\beta}}{2\sqrt{\pi} \varphi(b^*)},\end{equation*}
where (14) is used for the second equality.\hfill $\square$
Remark 4. As  ${\varepsilon}\downarrow 0$
we have
 $b^*\downarrow 0$
, and the maximal expected growth rate tends to
 $\lambda=\frac{\sigma \sqrt{\beta}}{2\sqrt{\pi}}$
. In the limit, switching will thus happen infintely many times in any finite time interval when the underlying process is at 0, and the obtained expected growth rate is closely connected with the concept of local time.
For a graphical illustration of how the expected growth rate  $\lambda^{-b,b}$
varies with b for different slippage costs, see Figure 1 (right). For the dependence in the optimal strategy on the slippage cost, see Figure 2 (right), and for an illustration of how the maximal expected growth rate decays, see Figure 3 (right).
5. Trend-following trading
In this section we apply our scheme to a more involved problem with an asset price which exhibits trends. More precisely, we model the asset price by the stochastic differential equation  $\textrm{d} S(t) = \mu(t)S(t)\,\textrm{d} t + \sigma S(t)\,\textrm{d} W(t),$
where
 $\sigma>0$
is a constant, W is a Brownian motion, and the drift
 $\mu(t)$
is a continuous-time Markov chain, independent of W and taking values in
 $\{\mu_1,\mu_2\}$
, where
 $\mu_1<0<\mu_2$
. We denote by
 $\lambda_i>0$
the intensity with which the Markov chain
 $\mu$
jumps from state
 $\mu_i$
to
 $\mu_{3-i}$
,
 $i=1,2$
, and denote by
 $\pi=\textrm{P}(\mu(0)=\mu_2)$
the initial probability that
 $\mu$
starts in the second state.
Following [Reference Dai, Yang, Zhang and Zhu9] and [Reference Dai, Zhang and Zhu8], we assume that the model, including the value of all parameters  $\sigma$
,
 $\mu_1$
,
 $\mu_2$
,
 $\lambda_1$
,
 $\lambda_2$
, and
 $\pi$
, is known to the agent, but the current state
 $\mu(t)$
is not directly observable. However, through continuous observations of the asset price S, information about the drift
 $\mu$
may be inferred. In fact, by filtering theory, see [Reference Liptser and Shiryaev14, Theorem 9.1], the conditional probability
 $\Pi_t\,:\!=\textrm{P} [\mu(t)=\mu_2\mid \mathcal F^S_t]$
and the asset price satisfy
 \begin{equation*}
\textrm{d} \Pi(t) = (\lambda_1(1-\Pi_t)-\lambda_2\Pi_t)\,\textrm{d} t +\omega\Pi_t(1-\Pi_t)\, \textrm{d}\hat W_t
\end{equation*}
and  $\textrm{d} S(t)=\hat \mu(t) S(t)\,\textrm{d} t +\sigma S(t)\,\textrm{d} \hat W(t),$
where
 $\omega\,:\!=(\mu_2-\mu_1)/\sigma$
,
 $\hat\mu(t)\,:\!=\mu_1+(\mu_2-\mu_1)\Pi_t$
, and the innovation process
 \begin{equation*}\hat W(t)\,:\!=\frac{1}{\sigma}\int_0^t (\mu(s)-\hat\mu(s))\,\textrm{d} s + W(t)\end{equation*}
is a standard Brownian motion. Thus, in terms of the innovation process, we have
 \begin{eqnarray*}
S(t)\ &=&\ S(0)\exp\left\{\int_0^t\hat\mu(s)\,\textrm{d} s-\frac{\sigma^2}{2}t+\sigma \hat W(t)\right\}\\
&=&\ S(0)\exp\left\{\int_0^t\mu_1+(\mu_2-\mu_1)\Pi(s)\,\textrm{d} s-\frac{\sigma^2}{2}t+\sigma \hat W(t)\right\}.
\end{eqnarray*}
We assume that any amount can be invested in the asset, and we consider an investor who at each instant has all her money invested either in a bank account with zero interest rate or in the asset. Moreover, a proportional transaction cost  ${\varepsilon}\in(0,1)$
is charged each time stocks are bought, but nothing when they are sold.
Remark 5. As in the exchange rate example of Sections 2 and 4, the asymmetry in the transaction cost is of no significance and is only imposed for notational convenience. Furthermore, the assumption that the bank account pays no interest is also made only for notational convenience. In fact, after a change of numeraire, the more general case of a non-zero interest rate can be reduced to our setting.
Being a time-homogeneous problem, we consider strategies of the following form. If the current estimate  $\Pi$
for the probability of the larger drift drops below some level a, then the agent switches her position from the asset to the bank account; the first time the estimate exceeds some level b (with
 $a<b$
), she switches back to the asset again. The multiplicative gain over the first such cycle is then
 \begin{eqnarray*}
Y_1^{ab}\ &=&\ (1-{\varepsilon})\exp\left\{\int_0^{\tau_a}\mu(t)\,\textrm{d} t -\frac{\sigma^2}{2}\tau_a+\sigma W_{\tau_a}\right\}\\
&=&\ (1-{\varepsilon})\exp\left\{\int_0^{\tau_a}\mu_1+(\mu_2-\mu_1)\Pi(t)
\,\textrm{d} t -\frac{\sigma^2}{2}\tau_a+\sigma \hat W_{\tau_a}\right\},
\end{eqnarray*}
where  $\tau_a\,:\!=\inf\{t\geq 0\,:\,\hat\mu(t)= a\}$
.
5.1. Maximizing the growth rate of the expected return
In the multiplicative version we look for  $\Lambda=\Lambda^{ab}$
satisfying
 \begin{equation*}\textrm{E}_a[\exp\{-\Lambda \tau_b\}] \textrm{E}_b\left[\exp\left\{\int_0^{\tau_a}\hat \mu(t)\,\textrm{d} t -\frac{\sigma^2}{2}\tau_a+\sigma \hat W(\tau_a)-\Lambda \tau_a\right\}\right]=\frac{1}{1-{\varepsilon}},\end{equation*}
cf. Theorem 1. By a Girsanov change of measure, this is equivalent to finding  $\Lambda$
such that
 \begin{equation}
\textrm{E}_a[\exp\{-\Lambda \tau_b\}] \tilde{\textrm{E}}_b\left[\exp\left\{\int_0^{\tau_a}\hat \mu(t)\,\textrm{d} t -\Lambda \tau_a\right\}\right]=\frac{1}{1-{\varepsilon}},
\end{equation}
where  $\Pi$
now satisfies
 \begin{equation*}\textrm{d}\Pi(t)=(\lambda_1(1-\Pi_t)-\lambda_2\Pi_t+\sigma\omega\Pi(t)(1-\Pi(t)))\,\textrm{d} t +\omega\Pi_t(1-\Pi_t)\, \textrm{d}\tilde W(t)\end{equation*}
and  $\tilde W$
is a Brownian motion under a new measure
 $\tilde {\mathbb P}$
.
We have not been able to find explicit expressions for the two expected values on the left-hand side of (15). Instead, the optimization problem is solved numerically. To treat the first expected value in (15), note that for each fixed  $b\in(0,1)$
, the function
 $u(\pi)\,:\!=\textrm{E}_\pi[\exp\{-\Lambda \tau_b\}]$
is the unique solution of the ordinary differential equation
 \begin{equation}
\left\{\begin{array}{ll}
\frac{\omega^2\pi^2(1-\pi)^2}{2}u'' + (\lambda_1-(\lambda_1+\lambda_2)\pi)u'-\Lambda u=0,\quad &\quad \pi\in(0,b),\\[3pt]
u(b)=1,\\[3pt]
\lambda_1 u'(0)=\Lambda u(0)\end{array}\right.
\end{equation}
(here, the boundary condition at  $\pi=0$
is obtained by inserting
 $\pi=0$
in the ordinary differential equation). However, rather than solving the system (16) for each b and
 $\Lambda$
, we instead solve
 \begin{equation*}
\left\{\begin{array}{ll}
\frac{\omega^2\pi^2(1-\pi)^2}{2}v'' + (\lambda_1-(\lambda_1+\lambda_2)\pi)v'-\Lambda v=0, &\quad \pi\in(0,1),\\[3pt]
v(0)=1,\\[3pt]
\lambda_1 v'(0)=\Lambda v(0)\end{array}\right.
\end{equation*}
for different  $\Lambda$
and note that
 $u(x)=\frac{v(x)}{v(b)}$
. A similar remark applies to the second factor on the left-hand side of (15).
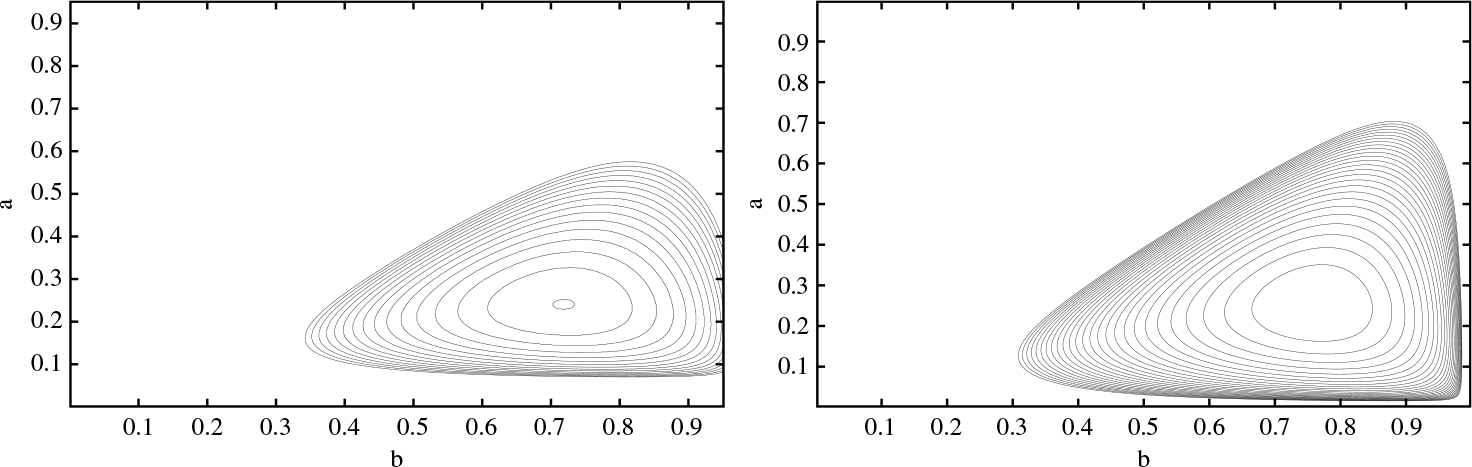
For a graphical illustration of the level curves of the function  $\Lambda=\Lambda^{ab}$
, see Figure 4 (left). For an illustration how the optimal
 $\Lambda$
depends on the slippage cost
 ${\varepsilon}$
, see Figure 5 (left).
Level curves of  $\Lambda=\Lambda^{ab}$
(left) and of
 $\lambda=\lambda^{ab}$
(right). Here the parameters are
 $\mu_1=-1$
,
 $\mu_2=1$
,
 $\lambda_1=\lambda_2=2$
,
 $\sigma=0.2$
, and
 ${\varepsilon}=0.01$
.

The optimal growth rate  $\Lambda$
(left) and the optimal expected growth rate
 $\lambda$
(right) as a function of the slippage cost
 ${\varepsilon}$
. The remaining parameters are as in Figure 4.

5.2. Maximizing the expected rate of return
In view of Theorem 2, in order to maximize the expected rate of return we need to find  $a<b$
which maximizes
 \begin{align}
\lambda=\lambda^{ab}&\,:\!=\frac{\ln(1-{\varepsilon}) +\textrm{E}_b\big[ \int_0^{\tau_a}\hat \mu(t)\,\textrm{d} t -\frac{\sigma^2}{2}\tau_a\big]}{\textrm{E}_b[\tau_a]+\textrm{E}_a[\tau_b]} \notag\\[3pt]
& =
\frac{\ln(1-{\varepsilon})+\int_a^b\int_x^1\frac{\mu_1-\frac{\sigma^2}{2}+(\mu_2-\mu_1)y}{\alpha(y)}\exp\big\{\int_x^y\frac{\beta(z)}{\alpha(z)}\,\textrm{d} z\big\}\,\textrm{d} y\,\textrm{d} x}
{\int_a^b\int_x^1\frac{1}{\alpha(y)}\exp\big\{\int_x^y\frac{\beta(z)}{\alpha(z)}\,\textrm{d} z\big\}\,\textrm{d} y\,\textrm{d} x + \int_a^b\int_0^x\frac{1}{\alpha(y)}\exp\big\{\int_x^y\frac{\beta(z)}{\alpha(z)}\,\textrm{d} z\big\}\,\textrm{d} y\,\textrm{d} x} \notag\\[3pt]
& =
\frac{\ln(1-{\varepsilon})+\int_a^b\int_x^1\frac{\mu_1-\frac{\sigma^2}{2}+(\mu_2-\mu_1)y}{\alpha(y)}\exp\big\{\int_x^y\frac{\beta(z)}{\alpha(z)}\,\textrm{d} z\big\}\,\textrm{d} y\,\textrm{d} x}
{\int_0^1\frac{1}{\alpha(y)}\int_a^b\exp\big\{\int_x^y\frac{\beta(z)}{\alpha(z)}\,\textrm{d} z\big\}\,\textrm{d} x\,\textrm{d} y },
\end{align}
where  $\beta(z)=\lambda_1-(\lambda_1+\lambda_2)z$
and
 $\alpha(z)=\omega^2z^2(1-z)^2/2$
. We cannot find any symmetries, so we believe that the optimization problem is inherently two-dimensional.
For a graphical illustration of the optimization in (17), see Figure 4 (right) and Figure 5 (right), in which the level curves of  $\lambda^{ab}$
and the optimal growth rate
 $\lambda=\lambda({\varepsilon})$
are plotted.
6. Discussion
The purpose of the current paper is to introduce a renewal theory approach to switching problems. A full mathematical treatment would also need theoretical results connecting the approach introduced here with the standard techniques based on dynamic programming. We end this article by listing a few theoretical issues that, in our opinion, deserve further attention.
• For the corresponding switching problems with finite horizon, the standard approach using the dynamic programming principle would lead to a coupled system of variational inequalities. As the time left to maturity tends to infinity, would the optimal switching boundaries of that problem converge to the optimal strategy for the corresponding perpetual problem, where optimality is defined in terms of growth rates?
• Could it be the case that, as
 $T\to\infty$
, there exists a sequence of optimal strategies for the finite-horizon problem with a limiting growth rate strictly exceeding the optimal time-homogeneous one? We do not believe this, but we have also not been able to rule this out.
• As mentioned in the remark at the end of Section 2, we implicitly assume that all money is invested in only one of the two possible assets at each time. A full treatment of the additive versions, which are equivalent to problems in which the agent maximizes the logarithmic utility, should allow for the agent to invest in both assets simultaneously.

Appendix A. Proof of Lemma 2
First, note that  $\phi \,:\!=v'=\Psi'/\Psi> 0$
and
 \begin{eqnarray*}
\phi' &=& \frac{\Psi''}{\Psi}-\bigg(\frac{\Psi'}{\Psi}\bigg)^2> 0
\end{eqnarray*}
(in fact, this last expression is  $\alpha^2$
times the variance of a distribution with density
 $C u ^{\delta-1}\exp\{\alpha x u-u^2/2\}\,\textrm{d} u$
for
 $u>0$
, where
 $C=\big(\int_0^\infty u ^{\delta-1}\exp\{\alpha x u-u^2/2\}\,\textrm{d} u\big)^{-1}$
is a normalizing constant). Furthermore,
 $\phi$
satisfies the ordinary differential equation (ODE)
 \begin{equation*}\frac{\sigma^2}{2}\phi'+\frac{\sigma^2}{2}\phi^2-\beta x\phi-L=0.\end{equation*}
Now assume that  $L>\beta$
(the case
 $L=\beta$
then follows by continuity).
Claim 1:  $\phi>\frac{2\beta x}{\sigma^2}$
.
To see that Claim 1 holds, first note that there is nothing to prove for  $x\leq 0$
. Therefore, let
 $x_0=\inf\big\{x>0\,:\, \phi(x)\leq \frac{2\beta x}{\sigma^2}\big\}$
and assume that
 $x_0<\infty$
. Then, by construction,
 $\phi(x_0)=2\beta x_0/\sigma^2$
and
 $\phi'(x_0)\leq 2\beta/\sigma^2$
. On the other hand, using the ODE we find that
 \begin{equation*}\frac{\sigma^2}{2}\phi'(x_0)=-\frac{\sigma^2}{2}\phi^2(x_0)+\beta x_0\phi(x_0)+L=L>\beta,\end{equation*}
which is a contradiction. Consequently,  $x_0=\infty$
, which proves the claim.
Claim 2:  $\phi'< \frac{2\beta}{\sigma^2}$
.
To see that Claim 2 holds, note that if  $\smash{\phi'\geq \frac{2\beta}{\sigma^2}}$
at some point, then there must exist a point
 $x_0$
with
 $\phi'(x_0)=\frac{2\beta}{\sigma^2}$
and
 $\phi\leq \frac{2\beta}{\sigma^2}$
in a left neighborhood of
 $x_0$
. At that point,
 $\phi''(x_0)\geq 0$
; on the other hand, differentiating the ODE gives that
 \begin{align*}
\frac{\sigma^2}{2}\phi'' & = -\sigma^2\phi \phi' +\beta x_0\phi'+\beta \phi\\
& = \bigg(\beta x_0-\frac{\sigma^2}{2}\phi\bigg)\phi' + \bigg(\beta - \frac{\sigma^2}{2}\phi'\bigg)\phi \\
& =\bigg(\beta x_0-\frac{\sigma^2}{2}v\bigg)\phi' <0
\end{align*}
at  $x_0$
by Claim 1. This is a contradiction, which proves Claim 2.
Now assume that there exists a point with  $\phi''<0$
. Then there must exist a point
 $x_0$
with
 $\phi''(x_0)=0$
and
 $v''\geq 0$
in a left neighborhood of
 $x_0$
. Consequently,
 $\phi'''(x_0)\leq 0$
. On the other hand, differentiating the ODE once more yields
 \begin{equation*}\frac{\sigma^2}{2} \phi''' = 2\beta \phi' + \beta x_0\phi''-\sigma^2(\phi')^2-\sigma^2\phi \phi''=
(2\beta -\sigma^2\phi')\phi'>0\end{equation*}
at  $x_0$
by Claim 2, which is a contradiction. Therefore
 $\phi ''\geq 0$
, which completes the proof of Lemma 2.
Acknowledgements
Since the completion of a first draft of the current paper, our coauthor Martin Vannestål tragically passed away. In sorrow, we dedicate this work to his memory.