I. INTRODUCTION
Ultrafine-grained (UFG) metals possess an exceptional combination of mechanical properties including considerable ductility and higher strength as compared to their coarse grained counterparts.Reference Valiev and Langdon1–Reference Estrin and Vinogradov4 While the strength increase is a result of the high fraction of grain boundaries impeding dislocation motion as described by the Hall–Petch relationship, the high ductility is generally associated with an enhanced strain rate sensitivity.Reference Wheeler, Maier, Durst, Göken and Michler5–Reference Sabirov, Barnett, Estrin and Hodgson10 This research was motivated by the need to provide a better understanding of the relationship between this enhanced strain rate sensitivity and the material microstructure.
UFG metals are commonly produced by the severe plastic deformation technique of equal-channel angular pressing (ECAP).Reference Valiev and Langdon1,Reference Iwahashi, Wang, Horita, Nemoto and Langdon11–Reference Iwahashi, Furukawa, Horita, Nemoto and Langdon15 ECAP-processed Al has a shear/torsion textureReference Beyerlein and Tóth16–Reference Oh-ishi, Zhilyaev and McNelley18 and consists primarily of ultrafine grains separated by high-angle grain boundaries (HAGBs).Reference Kawasaki, Horita and Langdon19 But it may also contain “supergrains” (defined by DavidsonReference Davidson, Allison, Jones, Larsen and Ritchie20 as groups of grains in which the slip planes in adjacent grains are oriented within 15° of each other) and “deformation bands”Reference Oh-ishi, Zhilyaev and McNelley18,Reference Zhilyaev, Swisher, Oh-ishi, Langdon and McNelley21 (referred to as “microstructure bands” here to avoid confusion with measured surface deformations). These different microstructures each play a role in affecting the mechanical behavior of the material.Reference Kammers, Wongsa-Ngam, Langdon and Daly22 This work builds on the room temperature experiments carried out by the authors in Ref. Reference Kammers, Wongsa-Ngam, Langdon and Daly22 by relating strain rate sensitivity apparent at elevated temperatures to the underlying microstructure.
This research appears to be the first to relate full-field microscale elevated temperature strain rate sensitivity to the underlying microstructure in ECAP-processed UFG aluminum. The elevated temperature strain rate sensitivity of ECAP-processed aluminum and aluminum alloys was investigated in earlier experimental workReference Wheeler, Maier, Durst, Göken and Michler5–Reference Chinh, Szommer, Csanádi and Langdon7 and the results showed that the enhanced strain rate sensitivity arises from deformation mechanisms active at the grain boundaries, including varying contributions from grain boundary (GB) sliding and thermally activated diffusion processes. Here, the effects of the ECAP-processed microstructure on strain rate sensitivity are characterized through a combination of scanning electron microscopy (SEM), digital image correlation (DIC), and electron backscatter diffraction (EBSD).
II. EXPERIMENTAL PROCEDURE
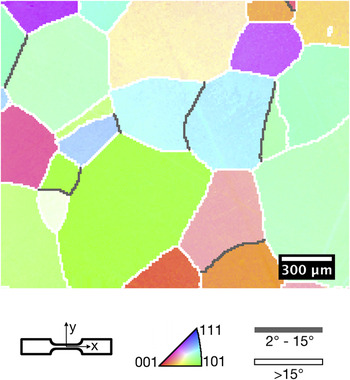
ECAP-processed high purity (99.99%) aluminum was investigated in this work. The coarse-grained starting material was purchased in 10 mm diameter × 65 mm long extruded rods from ESPI Metals (Ashland, OR). The rods were first annealed in air at 773 K for 1 hReference Kawasaki, Horita and Langdon19 to achieve an average grain size of approximately 500 μm (measured as the grain diameter by EBSD). An inverse pole figure map of the material following annealing is shown in Fig. 1. ECAP processing was carried out using a 90° channel angle die possessing an outer arc of curvature of 20°. The rods were lubricated with a molybdenum disulfide (MoS2) lubricant and then processed at room temperature at a pressing rate of ∼7 mm/s through four ECAP passes following route BC in which the rods are rotated by 90° in the same sense between each ECAP pass.Reference Valiev and Langdon1,Reference Nakashima, Horita, Nemoto and Langdon23–Reference Oh-ishi, Horita, Furukawa, Nemoto and Langdon25 Flat dogbone-shaped tensile test specimens with a gage cross-section of 2 mm × 1 mm and length of 8 mm were fabricated by electro-discharge machining (EDM). The tensile directions were aligned with the ECAP pressing axis and the specimens were cut from the central parts of the billets to avoid the presence of any nonuniform deformation at either end of each billet. Following standard ECAP processing naming conventions,Reference Valiev and Langdon1,Reference Iwahashi, Wang, Horita, Nemoto and Langdon11–Reference Iwahashi, Furukawa, Horita, Nemoto and Langdon15 the tension specimens were cut from the billet so that their flat faces were parallel to the flow plane (Y plane) of the billet in the final pass.
Inverse pole figure map of the initial coarse-grained microstructure following annealing at 773 K for 1 h.

Surface preparation began with polishing, followed by the deposition of alignment markers, EBSD, and the application of a DIC tracking pattern. Polishing was performed with diamond suspensions and a final abrasive of Buehler MasterMet 2 non-crystallizing colloidal silica suspension. 500 nm diameter and 500 nm tall platinum alignment markers were then applied with a focused ion beam (FIB) to enable alignment of each EBSD field of view (FOV) and DIC FOV. EBSD was performed, followed by plasma cleaning and surface patterning by self-assembly of 40 nm diameter gold nanoparticles as described in Ref. Reference Kammers and Daly26.
Tests were performed using an in situ tension–compression stage (Kammrath and Weiss) equipped with a 1 kN load cell and mounted in a FEI Quanta 200 3D FIB/SEM chamber. Experiments were carried out at 200 °C and at strain rates that jumped between 2.5 × 10⁻⁵ s−1 and 3.0 × 10⁻³ s−1. Note that these were not instantaneous jump tests, as the displacement was held constant for 7 min between load steps to capture images for DIC. Initial loading occurred at 2.5 × 10⁻⁵ s−1 to a strain of 2.5% to ensure that the microstructure within the FOVs had plastically deformed. Following this, the specimens were loaded at alternating strain rates, starting with the high strain rate. The strain rate was alternated after strain steps of 2.5% until a final macroscopic strain of 17.5% was achieved. Four of these load steps are presented here out to a macroscopic strain of 12.5%.
DIC was performed on the test images (2048 × 1768 pixels) with a step size of 3 pixels and a subset size containing between 3 × 3 speckles and 5 × 5 speckles on average. Single image scans were used to avoid blurring of integrated images caused by stress relaxation. As a result, horizontal displacement shifts (as described in Refs. Reference Sutton, Li, Joy, Reynolds and Li27–Reference Kammers and Daly29) needed to be removed from the DIC data, leading to blank lines visible in the displacement and strain fields. Lagrangian strain was calculated from local quadratic fitting of 15 × 15 datum point subsets of the distortion correctedReference Sutton, Li, Joy, Reynolds and Li27–Reference Sutton, Li, Garcia, Cornille, Orteu, McNeill, Schreier and Li30 displacement fields.
III. REPRESENTATIVE MICROSTRUCTURES INVESTIGATED
The FOVs investigated in these 200 °C experiments were selected to contain distinct representative microstructures created by ECAP processing. EBSD analysis of 135,000 μm2 of the ECAP-processed microstructure across seventeen tension specimens revealed that the ECAP material consisted of 40% UFG microstructure, 36% supergrains, and 24% microstructure bands. Note that the bands in the banded microstructure are considered supergrains, but are not included in the percentage of supergrains.
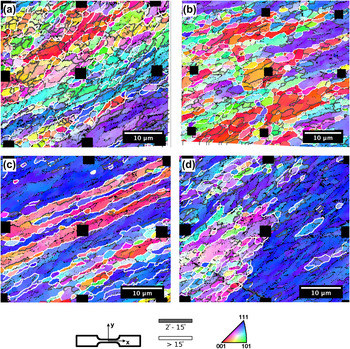
The microstructure details for the four FOVs are provided in Table I and inverse pole figure maps are shown in Fig. 2. The FOVs denoted by “S1-1” and “S2-1” were composed primarily of ultrafine grains separated by a large fraction of HAGBs. The FOV “S3-1” was composed of microstructure bands, whereas “S3-2” consisted of a large supergrain region and a region of ultrafine-grains with orientations similar to the supergrain region. In the FOV labels, the first digit is the ECAP specimen number and the second digit is the FOV number. Thus, S3-1 and S3-2 were from the same tensile specimen with the FOVs spaced approximately 200 μm apart.
Microstructural characteristics for the four FOVs investigated.

Inverse pole figure maps of the FOVs investigated in the 200 °C strain rate jump tension tests. These FOVs are composed of UFG regions, microstructure bands, and supergrains common in the ECAP-processed microstructure. Areas (a) S1-1 and (b) S2-1 are composed primarily of ultrafine grains, whereas (c) S3-1 is composed of microstructure bands and (d) S3-2 contains a large supergrain region and a large area of ultrafine grains.

All the FOVs had a high percentage of HAGBs. This was particularly true in S2-1 (984 μm HAGB length:1563 μm total GB length), S3-1 (677 μm HAGB length:916 μm total GB length), and S3-2 (505 μm HAGB length:830 μm total GB length), where over half of the grain boundaries were HAGBs. Slightly less than half (748 μm HAGB length:1543 μm total GB length) of the grain boundaries in S1-1 were HAGBs. In addition, all the FOVs had similar inclination of the grain boundaries from ECAP processing. This angle preference was centered about the predicted grain inclination angle of 26.6° for a cubic element passed through a single ECAP pass.Reference Iwahashi, Furukawa, Horita, Nemoto and Langdon15,Reference Zhu and Lowe31 There were also large areas of grains with orientations near  $\left\{ {111} \right\}\left\langle {\bar 211} \right\rangle$, denoted with purple in the inverse pole figure maps. This orientation, while present in the initial coarse-grained microstructure in Fig. 1, was prevalent in the ECAP-processed material.
IV. EXPERIMENTAL RESULTS AND DISCUSSION
A. Macroscopic observations
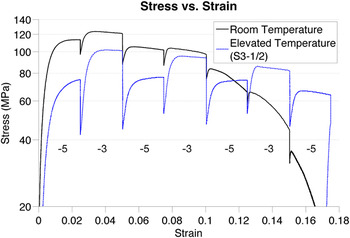
The macroscopic response of UFG Al at 200 °C was significantly different from the room temperature response. At 200 °C, the material possessed a lower yield strength (59.1 ± 6.9 MPa versus 93.0 ± 11.2 MPa) and a 3x greater steady-state strain rate sensitivity (m = 0.057 ± 0.012 versus m = 0.018 ± 0.007). Note that the strain rate sensitivity was calculated with the equation  $m = {{\delta \ln \sigma } \mathord{\left/ {\vphantom {{\delta \ln \sigma } {\delta \ln \dot \varepsilon }}} \right. \kern-\nulldelimiterspace} {\delta \ln \dot \varepsilon }}$, where σ is the engineering stress calculated from the stage mounted load cell and
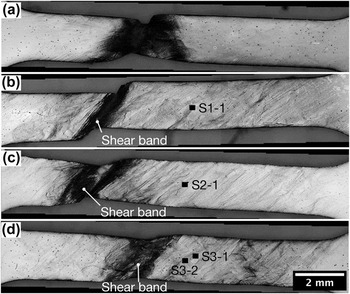
 $\dot \varepsilon$ is the strain rate input into the stage control software. Thus, this value represents the macroscopic strain rate sensitivity of the material. Figure 3 shows the stress–strain curves for strain rate jump tests at room temperature and 200 °C. The room temperature stress–strain curve, which followed the same loading procedure as the 200 °C tests, did not show strain hardening for any load steps except for the initial loading. This can be explained by the failure of the room temperature specimen by a narrow neck that formed shortly after the macroscopic yield strength was reached, as is evident in Fig. 4(a). The neck formed during the first high strain rate load step. The second high strain rate load step from 7.5 to 10% strain resulted in a significant narrowing of the gage section in the necked region. This explains the small increase in flow stress that occurred upon the high strain rate loading, as shown in Fig. 3. An angled crack, which may have formed during the high strain rate step, grew during the subsequent low strain rate step from 10 to 12.5% strain. This is observed as a steep drop in the stress–strain curve during this load step at a macroscopic strain of approximately 11%.
Macroscopic stress–strain curve calculated from load cell and grip displacement data, displaying differences in the strain rate sensitivity at room temperature and 200 °C. Work hardening is not apparent in the room temperature experiment with the exception of the initial load step. Work hardening is present in all low strain rate load steps of the 200 °C experiments except the last. Segments labeled “−5” and “−3” were loaded at 2.5 × 10⁻⁵ s−1 and 3 × 10⁻³ s−1, respectively.

Post-test gage sections for (a) room temperature specimen and (b–d) 200 °C specimens: (b) S1-1, (c) S2-1, and (d) S3-1/2. The 200 °C gage sections (b), (c), and (d) show similar shear band formation and plastic deformation across the entire gage section, whereas the room temperature gage section has a narrow necked region and minimal surface deformation visible away from the neck. All the specimens were subjected to the same load profile. The black rectangles mark the locations of the FOVs. Note that the rectangles are approximately 500% larger than the actual FOV size.

Shear bands, marked in Figs. 4(b)–4(d), were more prevalent than necking at 200 °C and propagated more quickly at high applied strain rate. As shown in Fig. 3 for specimen S3-1/2, strain hardening (defined here as a continuous increase in flow stress throughout the load step) was apparent throughout the first three low strain rate load steps of the 200 °C test. However, a shear band which formed early in the loading grew rapidly during the third high strain rate load step, after which work hardening was no longer apparent. S1-1 showed a narrow shear band with no observable necking, whereas S2-1 and S3-1/2 show a combination of necking and wider shear banding. The cause of this is not known for S2-1, but for S3-1/2, the wider shear band probably resulted from the additional localized deformation at the right of the gage section.
At 200 °C, it is likely that diffusion at low strain rates improved ductility through the recovery of dislocations and the initiation of diffusion deformation mechanisms which allowed plastic deformation to spread over a wider area of the gage section. This can be seen in Fig. 4, where plastic deformation is visible in the gage sections of the 200 °C specimens [Figs. 4(b)–4(d)], and not the gage section of the room temperature specimen [Fig. 4(a)].
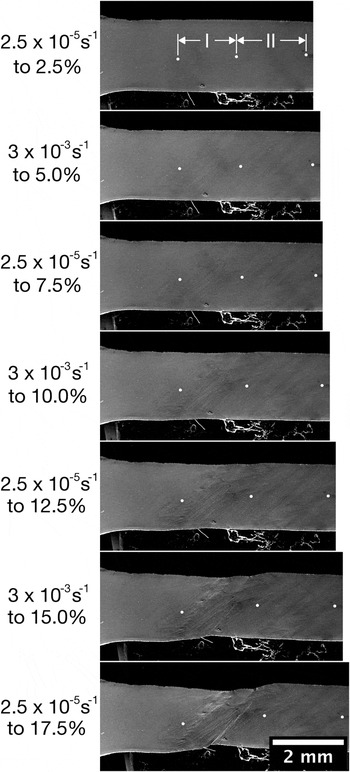
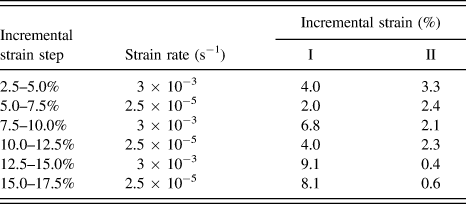
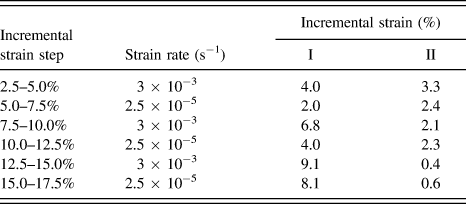
To provide the reader with context on what is occurring on the macroscopic scale when viewing the DIC results, an example of shear band formation with increasing load is shown in Fig. 5 for specimen S2-1. Please note the “I” and “II” areas of the gage section as shown in the top image of Fig. 5. Table II provides measurements of the incremental strain in area I that eventually developed a shear band and area II where the DIC FOV was located. Even during the early load step from 2.5 to 5% macroscopic strain, strain began to localize more strongly in area I which would eventually develop a shear band. A large jump in the incremental strain of area I, corresponding to rapid growth of the developed shear band, occurred during the load step from 7.5 to 10% macroscopic strain. This shear band growth during the high strain rate load step from 7.5 to 10% was observed in the gage sections outside of the DIC FOVs in all the 200 °C strain rate sensitivity tests. The growth of the shear band corresponded to a drop in the mean axial strain during this load step in the DIC FOVs, located away from the shear band, as shown in line graphs at the bottom of Figs. 6–9 which will be discussed in more detail in the following paragraphs. However, even after this drop at high strain rate, strain localization returns to the DIC FOVs at low strain rate. Strain localization nearly disappeared in the DIC FOV at the high strain rate load step from 12.5 to 15% (not presented here) yet returned in the following low strain rate load step (strain values were just above the noise threshold and are not presented here).
Surface deformation throughout loading of S2-1. Strain increments (2.5–5.0%), (7.5–10.0%), and (12.5–15.0%) were at a strain rate of 3 × 10⁻³ s−1. Strain increments (5.0–7.5%), (10.0–12.5%), and (15.0–17.5%) were at a strain rate of 2.5 × 10⁻⁵ s−1. Data presented in the DIC strain fields are from macroscopic incremental strains ranging from 2.5 to 12.5%.

Tabular data corresponding to the images in Fig. 5. Even in the incremental strain step from 2.5–5%, strain more favorably localized in area I suggesting that a shear band was already formed although it was not visible on the surface. After the shear band was visible to the eye, strain nearly exclusively localized there.
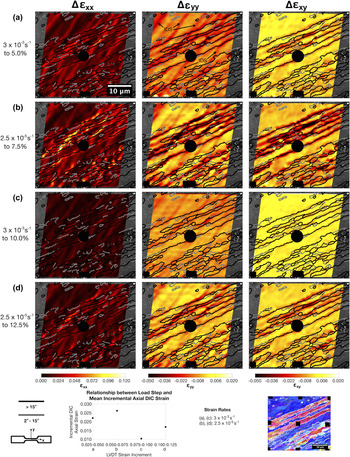
Strain fields for S1-1 (200 °C). Rows (a) and (c) show the incremental strain fields for a strain rate of 3 × 10⁻³ s−1. Rows (b) and (d) show the incremental strain fields for a strain rate of 2.5 × 10⁻⁵ s−1. Image size: 2048 × 1768 pixels. Image resolution: 22.0 nm/pixel. DIC parameters 25 × 25 pixel subset size, 3 pixel step size.

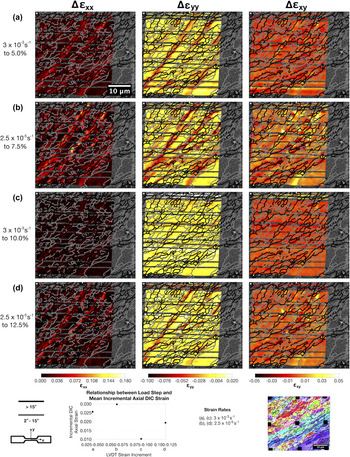
Strain fields for S2-1 (200 °C). Rows (a) and (c) show the incremental strain fields for a strain rate of 3 × 10⁻³ s−1. Rows (b) and (d) show the incremental strain fields for a strain rate of 2.5 × 10⁻⁵ s−1. Image size: 2048 × 1768 pixels. Image resolution: 22.7 nm/pixel. DIC parameters 25 × 25 pixel subset size, 3 pixel step size.

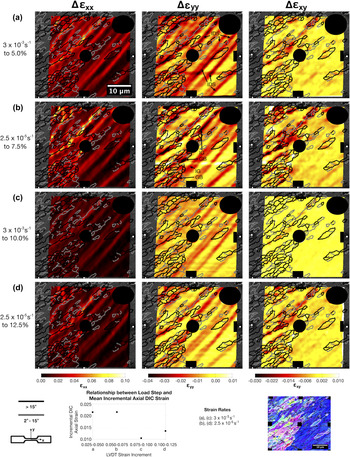
Strain fields for S3-1 (200 °C). Rows (a) and (c) show the incremental strain fields for a strain rate of 3 × 10⁻³ s−1. Rows (b) and (d) show the incremental strain fields for a strain rate of 2.5 × 10⁻⁵ s−1. The black areas cover failed correlation resulting from the Pt markers. Image size: 2048 × 1768 pixels. Image resolution: 20.8 nm/pixel. DIC parameters 25 × 25 pixel subset size, 3 pixel step size.

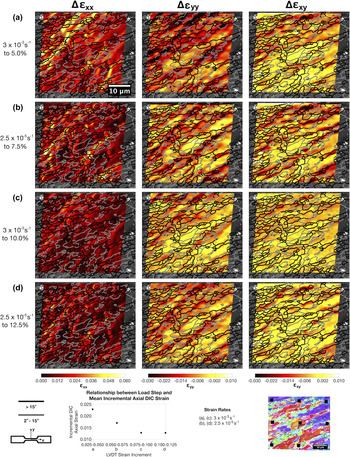
Strain fields for S3-2 (200 °C). Rows (a) and (c) show the incremental strain fields for a strain rate of 3 × 10⁻³ s−1. Rows (b) and (d) show the incremental strain fields for a strain rate of 2.5 × 10⁻⁵ s−1. The black areas cover failed correlation resulting from the Pt markers. Image size: 2048 × 1768 pixels. Image resolution: 20.8 nm/pixel. DIC parameters 25 × 25 pixel subset size, 3 pixel step size.

B. General DIC observations
While the macroscopic material responses were quite different at 200 °C and room temperature, the microscale strain localization showed many similarities. In both cases, the following behavior was observed.
(i) Dislocation slip was active in larger grains, supergrains, and microstructure bands on the slip system best aligned with the final pass ECAP theoretical shear plane and possessing the highest Schmid factor.
(ii) 80% of strain localization by length occurred on HAGBs (mean misorientation of 29.5° ± 14.1°) angled at near 26.6° from horizontal (mean trace angle of 22.5° ± 18.1°), which is the predicted grain inclination angle for a single ECAP pass. Details on these calculations are provided in the following paragraph.
(iii) In the banded microstructure of S3-1, shear strain (εxy) localized nearly exclusively at the HAGBs separating microstructure bands. Sharp shear offsets resulting from GB sliding were also apparent at these boundaries during low strain rate load steps.
C. Dependence of strain localization on strain rate
Incremental strain localization was measured to determine the impact of microstructure on strain rate sensitivity. Incremental strain fields are shown in Figs. 6–9 for each FOV at macroscopic strain increments of (2.5–5%), (5–7.5%), (7.5–10%), and (10–12.5%) as determined by linear variable differential transformer (LVDT). These coincide to two high strain rate load steps and two low strain rate load steps, as shown in Fig. 3. In Figs. 6–9, the bottom center plot shows the DIC-calculated mean incremental strain for the entire FOV incurred during each load step. The mean strain response of S2-1 (Fig. 7) dropped with each load increment, except for the last load increment during which it remained nominally constant. In S1-1, S3-1, and S3-2, the mean strain increased with each low strain rate load step. In each test, the mean strain in the first two load steps was near the applied strain of 2.5%. After the second load step, the mean DIC FOV strain dropped to approximately 1% as a result of strain localization preferentially occurring at shear bands.
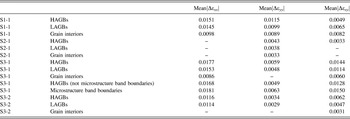
Grain boundaries (particularly HAGBs) exhibited the greatest strain rate sensitivity, and the incremental mean strain decreased (increased) when moving from a low to high strain rate (high to low strain rate) as demonstrated in Table III. Relationships between strain localization and the underlying microstructure were determined by first removing all strain data below the noise threshold and manually selecting visible strain localization in each strain component of each test. This yielded a binary image where strain localization was black and the remainder of the FOV was white. The binary image was then imported into Matlab where the black highlighted strain was thinned to lines 200 nm wide and used to select EBSD data that was aligned with the DIC FOV. Strain localization which was aligned within 15° of a GB trace and contained a GB was defined to be at that GB. Otherwise the strain localization was assigned to the grain where it was contained. Once the localization was assigned to the GB or grain, relationships between the strain localization and microstructural characteristics from the EBSD data could be studied. An example demonstrating this procedure can be found in the Supplemental Figure S1.
Mean of the absolute value of the change in strain that occurs when switching between strain rates. A “–” is marked in entries where strain rate sensitivity, defined as a decrease (increase) when moving from a low to high strain rate (high to low strain rate), was not observed in all strain rate changes. Strain rate sensitivity is most prominent at microstructure band boundaries, followed by HAGBs, LAGBs, and grain interiors.

The greatest change in mean strain magnitude generally occurred at HAGBs, followed by low-angle grain boundaries (LAGBs) and grain interiors. This is true even in S2-1 in which strain rate sensitivity is not easily visible in the strain fields of Fig. 7. This is demonstrated in Table III where strain rate sensitivity is presented as the mean of the absolute values of the change in incremental strain when moving between strain rates. Boundaries between microstructure bands in S3-1 showed even greater strain rate sensitivity than HAGBs. The microstructure band GB incremental strain always exhibited strain rate sensitivity, with changes in mean incremental strain being of a greater magnitude than at HAGBs, LAGBs, or within grains. Other microstructural characteristics such as the difference in adjacent grain size, angle between the highest Schmid factor slip directions and plane normals, and crystalline orientation were investigated, but there were no apparent relationships to the strain rate sensitivity.
At high strain rates (strain increments of 0.025–0.050% and 0.075–0.100%), lower strain localization occurred at grain boundaries with magnitudes near the same level as dislocation slip. This is best observed in Figs. 6 and 8 where strain localization was nearly absent from the second high strain rate load step. Dislocation slip was identified as strain localization aligned with a  $\left\{ {111} \right\}$ plane trace. To further confirm that it was dislocation slip, the DIC in-plane displacement measurements were compared to the calculated in-plane displacement components for the
 $\left\langle {\bar 110} \right\rangle$ directions on the aligned
 $\left\{ {111} \right\}$ plane. At low strain rates, diffusion-based deformation mechanisms allowed for significant strain localization. We propose that diffusion-based deformation mechanisms are active as in other worksReference Wheeler, Maier, Durst, Göken and Michler5,Reference Chinh, Szommer, Csanádi and Langdon7 due to the fact that high strain localization occurred at HAGBs at low strain rates in these elevated temperature tests. The same behavior was not witnessed in room temperature experiments where diffusion is less likely. Again, Figs. 6 and 8 demonstrate the return of strain localization in the final low strain rate load step. Additional strain fields and plots of the strain fields' cumulative distribution can be found in Supplemental Figures S2–S5.
Intragranular dislocation slip, which was active in all observed supergrains and often apparent in the transverse (εyy) strain fields, as labeled “IDS” in the first εyy strain fields in Figs. 8 and 9, exhibited low strain rate sensitivity. In turn, the small strain rate sensitivity in supergrains caused by dislocation slip limited the strain rate sensitivity at neighboring grain boundaries. The reader should note that dislocation slip can appear in different strain fields or be nearly unobservable in the DIC strain fields depending on the orientation of the active slip system. Slip occurring directly into the sample surface, which is highly unlikely in uniaxial tension, will probably not be measured by two-dimensional DIC. Slip occurring on a slip plane perpendicular to the surface and in a direction which lies in the sample face plane will appear as primarily shear strain. For slip to be most apparent in εyy, slip must be occurring primarily in the y-direction. In S3-2, which contained a supergrain, active dislocation slip caused the mean εyy to continually decrease in magnitude. This is due to the fact that, as observed in tests on coarse-grained aluminum, dislocation slip shows limited strain rate sensitivity. Thus, a region of microstructure such as supergrains that deformed by dislocation slip showed little strain rate sensitivity. Once shear bands formed outside of the DIC FOV, strain more favorably localized there, causing the strain localization from slip to decrease in magnitude.
The small strain rate sensitivity in supergrains from dislocation slip in S3-2 limited the strain rate sensitivity at the neighboring grain boundaries as specified by “IG/GB” for intragranular/grain boundary in Fig. 9(b). The highlighted strain localization appears similarly in each strain component, meaning that the deformation is occurring in the same direction and possesses a similar magnitude at grain boundaries and slip bands. This resulted in the strain rate sensitivity at HAGBs in εyy, where strain localization from slip was most apparent, to be the lowest of any test. This is probably the result of several grain boundaries being elongated and parallel to the traces of the slip planes active in the neighboring supergrain. Since plastic deformation occurred on these grain boundaries to accommodate slip, which showed little strain rate sensitivity, the strain rate sensitivity of these grain boundaries was similarly small.
The fact that dislocation slip showed little strain rate sensitivity and remained active at high strain rate can explain shear band formation in tests at 200 °C. Recovery of dislocations during the low strain rate load steps permitted easier dislocation slip at high strain rate. This phenomenon, in combination with the favorable alignment of active slip systems with the plane of maximum resolved shear stress, encouraged shear banding. Cooperative diffusion along grain boundaries, many of which had orientations similar to that of the shear bands, was probably also a contributing factor.
V. CONCLUSIONS
The strain rate sensitivity of UFG high purity aluminum was examined at room temperature and 200 °C for strain rates alternating between 2.5 × 10⁻⁵ s−1 and 3.0 × 10⁻³ s−1. The results presented here are the first full-field, quantitative investigations of the effect of microstructure on strain rate sensitivity. This work yielded the following conclusions:
(1) High strain localization was visible in the gage section of the 200 °C specimens as shear bands. These shear bands grew at a faster rate at high strain rate, whereas at low strain rate, strain localization was distributed across the gage section.
(2) At room temperature, the specimens failed by necking. Little plastic deformation was apparent outside of the neck. At 200 °C, plastic deformation was apparent across the entire length of the gage section.
(3) Even after shear bands were visible in the gage section, strong strain localization occurred at the grain boundaries at low strain rate. This was apparent in the DIC strain fields, where little localization was apparent at the second high strain rate load step, but strain localization returned at the following low strain rate load step.
(4) The greatest strain rate sensitivity was observed at HAGBs, particularly those separating microstructure bands, due to diffusion deformation mechanisms that are more active at 200 °C during the low strain rate load steps. Intragranular strain localization displayed the lowest strain rate sensitivity.
(5) Strain rate sensitivity was reduced by the presence of supergrains because of the relatively high activity of dislocation slip in these structures.
(6) Dislocation slip in supergrains can limit the strain rate sensitivity in neighboring regions of ultrafine grains separated by HAGBs. This was observed in S3-2 where the grain boundaries were elongated and parallel to the traces of slip planes active in neighboring supergrains, causing significant plastic deformation in these boundaries to accommodate slip.
Supplementary Material
To view supplementary material for this article, please visit http://dx.doi.org/jmr.2015.58.
ACKNOWLEDGMENTS
This work was supported by the National Science Foundation under Grant No. 092753 and by the Rackham Graduate School Non-Traditional Student Fellowship from the University of Michigan. The authors would like to acknowledge Sara Nitz for her sample preparation work and experimental assistance. Portions of this work were performed at the Electron Microbeam Analysis Laboratory (EMAL) at the University of Michigan and at the Lurie Nanofabrication Facility (LNF), a member of the National Nanotechnology Infrastructure Network, which is supported in part by the National Science Foundation. This work was also supported in part by the National Science Foundation of the United States under Grant No. DMR-1160966.