Introduction
Palmer amaranth (Amaranthus palmeri S. Watson) is the most problematic weed in the United States (Van Wychen Reference Van Wychen2016). It is highly competitive, with immense fecundity, and has the ability to replenish the soil seedbank in one generation (Mahoney Reference Mahoney2020; Webster and Grey Reference Webster and Grey2015). Amaranthus palmeri is an obligate cross-pollinator that has high genetic variation (Chandi et al. Reference Chandi, Milla-Lewis, Jordan, York, Burton, Zuleta, Whitaker and Culpepper2013). Its pollen can move long distances, with previous researching illustrating resistance traits being transferred up to 300 m from the source plant (Sosnoskie et al. Reference Sosnoskie, Webster, Kichler, MacRae, Grey and Culpepper2012). Along with intense herbicide selection pressure, these characteristics have favored the evolution of A. palmeri populations with resistance to several sites of action (SOA), with some populations expressing multiple resistance (Heap Reference Heap2019; Ward et al. Reference Ward, Webster and Steckel2013). The first case of herbicide-resistant A. palmeri was reported in South Carolina in 1989 to the microtubule assembly inhibitor trifluralin (Heap Reference Heap2019). To date, 28 states have reported herbicide-resistant A. palmeri, with 16 reporting resistance to two or more herbicide SOAs, and 3 of those 16 reporting resistance to four or more SOAs. Rapid occurrence and spread of herbicide resistance in this weed continue to be of great concern for the agricultural community. Recently, A. palmeri populations in the midsouthern and midwestern United States resistant to POST applications of protoporphyrinogen oxidase (PPO) inhibitors have been documented, with resistance confirmed through genetic and metabolic pathways (Giacomini et al. Reference Giacomini, Umphres, Nie, Mueller, Steckel, Young, Scott and Tranel2017; Salas et al. Reference Salas, Burgos, Rangani, Singh, Refatti, Piveta, Tranel, Mauromoustakos and Scott2017; Varanasi et al. Reference Varanasi, Brabham and Norsworthy2018a, Reference Varanasi, Brabham, Norsworthy, Nie, Young, Houston, Barber and Scott2018b).
In North Carolina (NC), A. palmeri resistant to the acetolactate synthase (ALS) inhibitor chlorimuron was first reported in 1995, followed by reports of resistance to glyphosate in 2005 (Heap Reference Heap2019). Whitaker (Reference Whitaker2009) screened 290 A. palmeri populations collected from NC in 2005 for resistance to glyphosate and thifensulfuron-methyl and reported that 49 (17%) and 52 (18%) populations were resistant to these herbicides, respectively. In the most recent screening of 134 A. palmeri populations collected in 2010 predominantly from the NC Coastal Plain, Poirier et al. (Reference Poirier, York, Jordan, Chandi, Everman and Whitaker2014) reported more than 95% of populations were resistant to the ALS inhibitor thifensulfuron-methyl or glyphosate, with 95% of those populations being resistant to both herbicides. Research to date has shown glyphosate resistance in tested A. palmeri populations from NC can be attributed to overexpression of 5-enolpyruvylshikimate-3-phosphate synthase (Chandi et al. Reference Chandi, Milla-Lewis, Giacomini, Westra, Preston, Jordan, York, Burton and Whitaker2012; Chaudhari et al. Reference Chaudhari, Jordan, York, Jennings, Cahoon, Chandi and Inman2017), but the mechanism conferring ALS resistance has yet to be defined in any population from the state. Further research is needed to define this mechanism. In addition to glyphosate and thifensulfuron-methyl, these populations were screened with fomesafen (PPO inhibitor) and glufosinate (glutamine synthetase inhibitor), and no resistance was detected.
While the research by Poirier et al. (Reference Poirier, York, Jordan, Chandi, Everman and Whitaker2014) was informative, a more current resistance screen is needed due to the recent reported resistance to PPO inhibitors in the midsouthern and midwestern United States and the potential for rapid evolution of herbicide-resistant A. palmeri populations. Additionally, a baseline survey is needed for 4-hydroxphenylpyruvate dioxygenase (HPPD) inhibitors for future resistance monitoring as the release of HPPD-tolerant cotton (Gossypium hirsutum L.) and soybean [Glycine max (L.) Merr.] cultivars approaches (Wechsler Reference Wechsler2018). Early detection and characterization of herbicide-resistant populations is critical to mitigate the spread of resistance and maintain the efficacy of current herbicide technologies long-term through adequate stewardship programs (Burgos et al. Reference Burgos, Tranel, Streibig, Davis, Shaner, Norsworthy and Ritz2013). Therefore, the objectives of this research were to (1) quantify the frequency of ALS- and glyphosate-resistant A. palmeri populations from the NC Coastal Plain, (2) elucidate the genetic mutations that confer resistance to ALS-inhibiting herbicides in resistant populations, and (3) determine the presence of and characterize glufosinate-, HPPD-, and PPO-resistant populations.
Materials and Methods
Plant Materials
In September to November 2016, seed from A. palmeri populations were collected from fields before crop harvest predominantly in the NC Coastal Plain, the state’s primary row crop–producing region (USDA-NSS 2018). Field samplings were not predetermined and were done at random when enough females were present in a field for collection. The sampling region was selected to ensure it overlapped with the area sampled in previous resistance screenings completed in NC by Whitaker (Reference Whitaker2009) and Poirier et al. (Reference Poirier, York, Jordan, Chandi, Everman and Whitaker2014) to allow for inferences about changes in herbicide-resistance frequencies over time. Generally, 10 to 15 female plants were selected from a random 10 by 10 m area within a field. Seeds were collected from each female plant and pooled to represent the variability of the population in each field. In all, 110 populations were collected from the following cropping systems: 12 in cotton, 27 in peanut (Arachis hypogaea L.), 50 in soybean [Glycine max (L.) Merr.], and 21 in sweetpotato [Ipomoea batatas (L.) Lam.]. Herbicides applied during the season were not determined for any field. Plant material was transported to the Method Road Greenhouse Complex (Raleigh, NC), where it was air-dried, threshed, and cleaned. Cleaned seed was stored at 4 C until testing.
Herbicide-Resistance Bioassay
In the greenhouse, approximately 30 seeds cell−1 were sown into 50-cell trays (Greenhouse Megastore, Danville, IL) containing potting soil mix (SunGro® Fafard 4P Mix, Agawam, MA) and watered daily. The greenhouse was maintained at 35 ± 5 C with metal-halide lighting (400 µmol m−2 s−1; Hubbell Lighting, Greenville, SC) supplementing natural light for 14 h daily. After emergence, plants were thinned to 1 plant cell−1, with 10 continuous cells equaling one replication. As resistance to glyphosate and thifensulfuron-methyl has been shown to be common throughout the state (Poirier et al. Reference Poirier, York, Jordan, Chandi, Everman and Whitaker2014), five plants were used per replication to conserve space and resources. Each experiment consisted of five replications and was repeated in time.
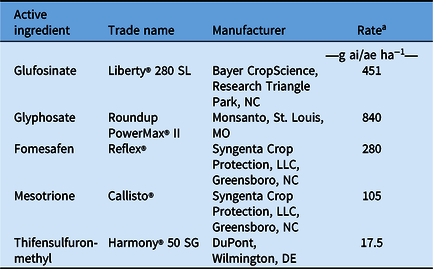
In separate experiments, A. palmeri at the 2- to 4-leaf stage was treated with fomesafen, glyphosate, glufosinate-ammonium, mesotrione, or thifensulfuron-methyl at the rates shown in Table 1. Nontreated plants from each population were included in all experiments. Herbicides (excluding mesotrione) and rates were similar to those previously used by Poirier et al. (Reference Poirier, York, Jordan, Chandi, Everman and Whitaker2014) when screening NC A. palmeri populations for herbicide resistance. Per label recommendations, a nonionic surfactant (0.25% v/v; Induce® adjuvant, Helena Chemical, Collierville, TN) was included with fomesafen and thifensulfuron-methyl. A liquid solution of urea ammonium nitrate (32% N) at 4.7 L ha−1 was included with thifensulfuron-methyl. Mesotrione treatments included 1% (v/v) crop oil concentrate (Agri-Dex, Helena Chemical) and 4.7 L ha−1 urea ammonium nitrate. Herbicides were applied with a CO2-pressurized backpack sprayer (8002EVS nozzle, TeeJet® Technologies, Spray Systems Co., Wheaton, IL) calibrated to deliver 187 L ha−1 at 207 kPa.
Herbicide treatments used for Amaranthus palmeri resistance screening.

a Based on the product labels, all herbicides were applied at a full label rate. Thifensulfuron-methyl rate was based on sulfonylurea-tolerant soybean.
At 3 wk after treatment, injury was visually estimated on a scale 0% to 100% (0 = no visible injury and 100 = plant death) and survivors were counted. Visual estimates of percent control included foliar chlorosis and necrosis and plant stunting. Survival percentage was determined by counting the number of survivors (i.e., plants with functional green leaves and apical meristems) and dividing by the number of plants treated per replication. Data were subjected to ANOVA using PROC GLIMMIX in SAS (SAS v. 9.4, SAS Institute, Cary, NC). Amaranthus palmeri population and experimental run were considered fixed variables, with replication considered as random. Differences between experimental runs were not detected (P > 0.05), and results were pooled across runs. Populations completely controlled with the tested rates in both experimental runs were considered the control group (i.e., no resistant individuals). Dunnett’s procedure (α = 0.05) was utilized to determine significant difference for survival frequencies. For the PPO-inhibitor screen, a known resistant population from Arkansas was included (Salas et al. Reference Salas, Burgos, Rangani, Singh, Refatti, Piveta, Tranel, Mauromoustakos and Scott2017).
Analysis comparing glyphosate resistance by collected cropping system was also done to determine whether any bias existed for selecting resistant individuals by cropping system. For instance, glyphosate treatments later in the season are common in cotton and soybean production, but not in peanut and sweetpotato; thus, survivors in peanut and sweetpotato may have survived glyphosate treatment occurring earlier in the season. For this analysis, cropping system was considered to be a fixed variable, allowing for survival frequency to be compared across systems.
Kompetitive Allele Specific PCR (KASP) Assays for Amaranthus palmeri Surviving ALS and PPO Inhibitors
Plants surviving following the fomesafen or thifensulfuron-methyl application were transplanted into 15-cm-diameter pots filled with the same growth media. While ALS-resistant A. palmeri is not new to NC (Heap Reference Heap2019), research to date has not determined what genetic mechanisms may be contributing to this resistance in the state. After allowing regrowth for approximately 2 wk, 100 mg (±5 mg) of young leaf tissue was clipped from each plant and placed in a 96-well plate. Plates were then placed in an airtight container with silica gel mesh desiccant (Silica gel 6-12 mesh desiccant Grade H Type II, VWR International, Radnor, PA) for 3 d until fully desiccated. A stainless-steel bead was added to each tube, and tubes were capped and placed in a −80 C freezer for 1 to 2 d. Tissues were then ground (Geno/Grinder 2000, SPEX SamplePrep., Metuchen, NJ) at 1,600 strokes min−1 for 1 to 2 min and then placed back in the −80 C freezer overnight. The following morning, DNA was extracted following the sbeadex plant kit (NAP41615, LGC Biosearch Technologies, Middlesex, UK) protocol using an oKtopure™ robotic platform (LGC Biosearch Technologies). Concentration of DNA was then determined using the Quant-IT PicoGreen dsDNA Assay Kit (Thermo Fisher Scientific, Waltham, MA), and concentrations were adjusted to approximately 5 to 10 ng µl−1. Using an Apricot liquid handler (Personal Pipettor, Apricot Designs, Covina, CA), 3 µl of molecular biology reagent-grade water (Sigma-Aldrich, St Louis, MO) was pipetted into 384-well polymerase chain reaction (PCR) plates and spun to ensure the water was at the well bottom. The handler was then used to transfer 2 µl of extracted DNA solution to the 384-well plates, and the plates were spun. Plates were then dried at 65 C for 1 h. At least 2 blank wells per 96-well plate were included.
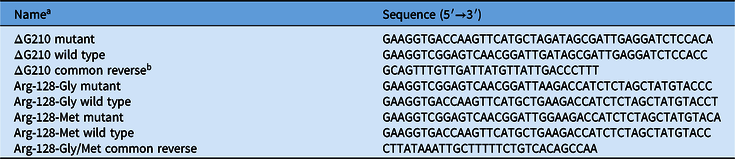
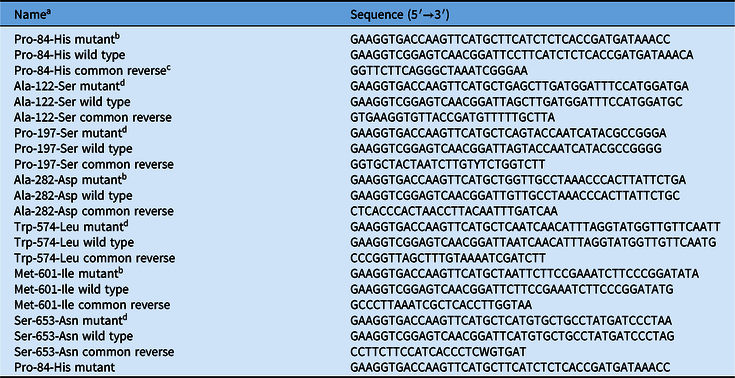
Genomic DNA sequences surrounding the known mutations conferring resistance to PPO inhibitors in A. palmeri were developed based on Giacomini et al. (Reference Giacomini, Umphres, Nie, Mueller, Steckel, Young, Scott and Tranel2017) and Salas et al. (Reference Salas, Burgos, Rangani, Singh, Refatti, Piveta, Tranel, Mauromoustakos and Scott2017) for the ΔG210 and R198 mutations, respectively (Table 2). Primers for the ALS mutations were developed from Larran et al. (Reference Larran, Palmieri, Perotti, Lieber, Tuesca and Permingeat2017). Seven total mutations (Table 3) were identified, including the four previously reported (Heap Reference Heap2019) and three others found by Larran et al. (Reference Larran, Palmieri, Perotti, Lieber, Tuesca and Permingeat2017). While the latter have not been confirmed as resistance-conferring mutations to date, they were included in order to determine whether our surviving populations also possess these mutations.
Primers used for Kompetitive Allele Specific PCR (KASP) assays to detect reported mutations conferring resistance to protoporphyrinogen oxidase inhibitors in surviving Amaranthus palmeri plants following an application of fomesafen at 280 g ha−1.

a Abbreviations: ΔG210, Gly-210 deletion; Arg-128-Gly, arginine to glycine substitution; Arg-128-Met, arginine to methionine substitution.
b Common reverse primers amplify the region of interest for both mutant and wild-type sequences.
Primers used for Kompetitive Allele Specific PCR (KASP) assays to detect reported mutations conferring resistance to acetolactate synthase (ALS) inhibitors in surviving Amaranthus palmeri plants following an application of thifensulfuron-methyl at 17.5 g ha−1.

a Abbreviations: Pro-84-His, proline to histidine substitution; Ala-122-Ser, alanine to serine substitution; Pro-197-Ser, proline to serine substitution; Ala-282-Asp, alanine to aspartic acid substitution; Trp-574-Leu, tryptophan to leucine substitution; Met-601-Ile, methionine to isoleucine substitution; Ser-653-Asn, serine to asparagine substitution.
b Mutations reported by Larran et al. (Reference Larran, Palmieri, Perotti, Lieber, Tuesca and Permingeat2017) in ALS-resistant A. palmeri populations.
c Common reverse primers amplify the region of interest for both mutant and wild-type sequences.
d Known resistance-conferring mutations.
KASP assays were completed according to the LGC group (LGC 2019). Resistant, wild-type, and common primer final concentrations were 0.16, 0.16, and 0.32 µM, respectively. Following the 34-base thermocycling procedure, fluorescence was read using a PHERAstar Plus (BMG Labtech, Cary, NC), and data were analyzed using the KlusterCaller software (LGC Biosearch Technologies). Additional cycles (3 per run) were completed as needed to ensure clustering.
Herbicide Dose–Response Bioassay
A dose–response bioassay was performed on populations with the highest survival following the fomesafen and mesotrione resistance screening. Populations from Edgecombe (EDG16) and Halifax counties (HAL16) (2% and 10% survival, respectively) were included in the fomesafen bioassay, while Bladen County (BLA16) and EDG16 populations (17% and 8% survival, respectively) were included in the mesotrione assay. Adequate plant numbers from the initial herbicide-resistance bioassay allowed for progeny to be collected from only the BLA16 survivors following the mesotrione resistance bioassay and included in the dose–response study. Two populations that were 100% controlled in the initial herbicide-resistance bioassay (DUP16 and NAS16) were used as field-collected “susceptible populations.” A documented PPO- and HPPD-susceptible A. palmeri population (SS) was also included in the dose–response bioassay (Chaudhari et al. Reference Chaudhari, Jordan, York, Jennings, Cahoon, Chandi and Inman2017). Dose–response bioassays for glyphosate and thifensulfuron-methyl were not conducted, as these have been well defined in previous work (Chaudhari et al. Reference Chaudhari, Jordan, York, Jennings, Cahoon, Chandi and Inman2017; Poirier et al. Reference Poirier, York, Jordan, Chandi, Everman and Whitaker2014; Whitaker Reference Whitaker2009). Amaranthus palmeri seeds were planted in 10-cm square pots (Greenhouse Megastore) containing potting soil mix (SunGro® Fafard 4P Mix) and watered daily. Seedlings were thinned to 3 plants pot−1. When plants reached the 4- to 6-leaf stage, fomesafen and mesotrione were applied as previously described with 280 and 105 g ai ha−1, respectively, considered as 1X rates. Herbicide rates (nine total) for fomesafen ranged from 0.1 to 631 g ha−1 (1/2,919 to 2.25X rate), while mesotrione rates ranged from 0.8 to 210 g ha−1 (1/128 to 2X rate). A nontreated control was included in each replication. Unfortunately, the BLA16 progeny population had poor germination, and all rates could not be tested. As such, mesotrione was screened for this population at 0.25X, 0.5C, and 1X rates to compare mortality against the original field population to determine resistance heritability. Four replications of 1 plant pot−1 were screened at the 0.25X and 0.5X rates, while six replications were screened at the 1X rate.
The experiment was a randomized complete block design with four replications and was repeated two and three times for fomesafen and mesotrione, respectively. At 2 (fomesafen bioassay) and 3 wk (mesotrione bioassay) after treatment, survivors were counted, and the aboveground tissue was harvested. Aboveground tissue samples were placed in a brown paper bag and dried for 3 to 4 d at 65 C. Percent dry biomass reduction compared with the nontreated control was calculated from these samples. Survival and biomass reduction data were fit in SigmaPlot v.14 (Systat Software, San Jose, CA) to a four-parameter logistic model
 $$y = c + \left( {d - c} \right) / \left( {1 + {{\left( {{x}\over{m}} \right)}^{\left( { - b} \right)}}} \right)$$
where y is the percent biomass reduction relative to the nontreated control or survival, c is the minimum value, d is the maximum value, m is the point in the curve halfway between the minimum and maximum values, and b is the hillslope. The dose needed to kill 50% of the population (LD50) or reduce the biomass by 50% (GR50) was calculated using Equation 1.
Results and Discussion
Herbicide-Resistance Bioassay and Genetic Assays
Glufosinate Bioassay
All A. palmeri populations were controlled 100% by glufosinate (data not shown). Poirier et al. (Reference Poirier, York, Jordan, Chandi, Everman and Whitaker2014) observed similar results with 134 A. palmeri populations collected predominantly from the NC Coastal Plain during 2010. In 2018, glufosinate-tolerant cotton and soybean cultivars accounted for approximately 65% and 20% of all U.S. plantings, respectively (Unglesbee Reference Unglesbee2018; USDA 2018). When considering the large genetic diversity in A. palmeri and extensive gene flow between populations, one can deduce that great stewardship is required to reduce selection pressure, contain the dispersal of emerging resistant genotypes, and maintain those SOAs that are still effective long-term (Chandi et al. Reference Chandi, Milla-Lewis, Jordan, York, Burton, Zuleta, Whitaker and Culpepper2013; Franssen et al. Reference Franssen, Skinner, Al-Khatib, Horak and Kulakow2001; Powles and Yu Reference Powles and Yu2010). However, the data suggest that with proper herbicide rate and application timing, glufosinate can effectively manage resistant biotypes within these populations that escape other herbicide SOAs as discussed later. Additionally, while no survivors were observed following glufosinate applications, the data can be utilized as a benchmark for future screenings of A. palmeri from the region.
Glyphosate and Thifensulfuron-Methyl Bioassay
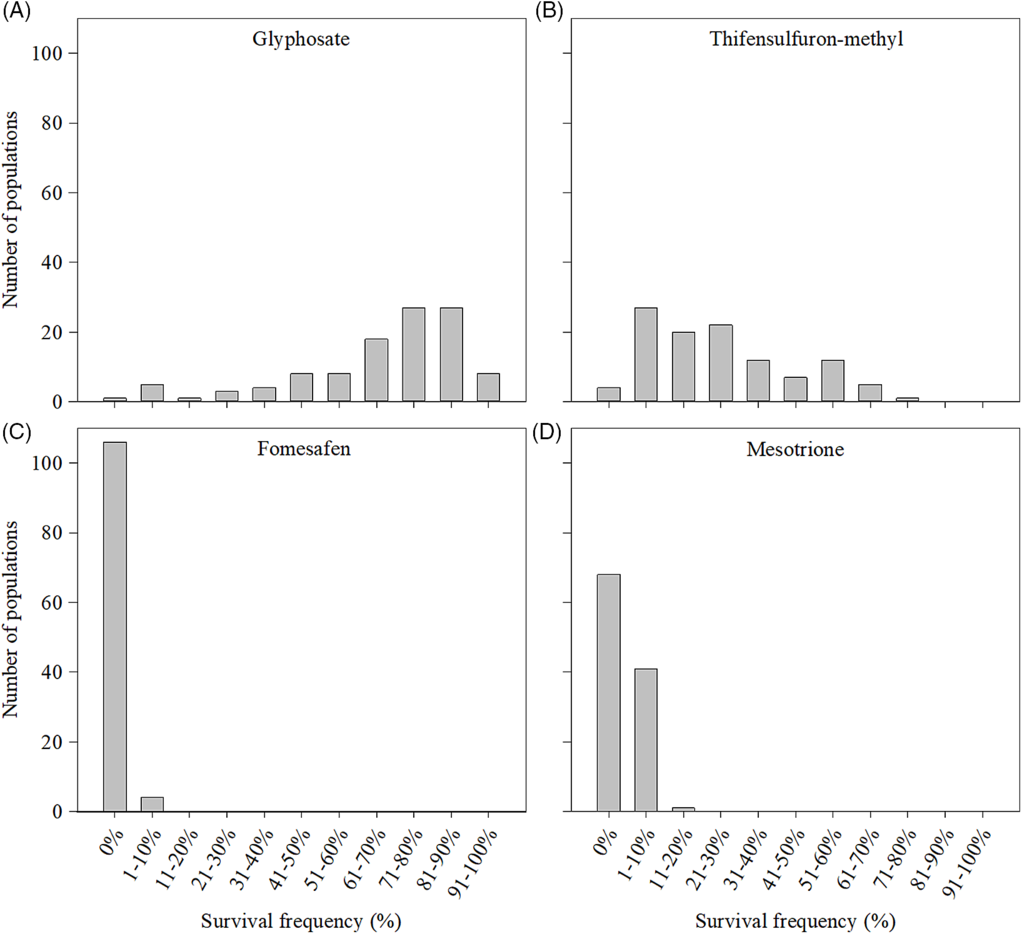
Amaranthus palmeri survival frequency from glyphosate treatment differed across populations (P < 0.0001; F = 15.6) with only one population being completely controlled by glyphosate (Figure 1A). Of the 110 populations tested, 9 had relatively low survival (1% to 30%), with 20 having moderate survival (31% to 60%). However, six of the nine low-survival populations (2% to 14% range) were not significantly different from the control (P > 0.05), suggesting lack of genetic homogeneity, thus causing high error variance. Most populations (72) had high survival (61% to 90%), with the remaining eight populations surviving at >90%. Overall, 80 of the 110 populations, or roughly 73%, had survival greater than 60%. The authors acknowledge that sampling plants in the fall may bias survival in those plants from cotton and soybean fields, as glyphosate was most likely used. The survival frequencies from glyphosate treatment differed significantly among cropping systems (P < 0.0001; F = 39.3), being highest in soybean (83%), followed by cotton and sweetpotato (70% and 69%, respectfully), then peanut (62%). Thus, a high number of survivors were found in populations from every cropping system. This is expected, because glyphosate-resistant cotton, corn (Zea mays L.), and soybean cultivars are widely grown in rotation by farmers across this region of NC (USDA-NSS 2018). Crop rotation may be practiced, but in the majority of cases, the base chemical weed control across crops contains glyphosate. Therefore, there is generally no relief from glyphosate selection pressure. Amaranthus palmeri allowed to produce seed at the end of the season, like those selected for this research, may occur in many systems, thus adding seed to the soil seedbank that may remain viable for years after burial (Sosnoskie et al. Reference Sosnoskie, Culpepper and Webster2011).
Survival frequencies for the 110 screened Amaranthus palmeri populations from the North Carolina Coastal Plain following an application of (A) glyphosate (840 g ha−1), (B) thifensulfuron-methyl (17.5 g ha−1), (C) fomesafen (280 g ha−1), and (D) mesotrione (105 g ha−1). All herbicides were applied at a full label rate. Thifensulfuron-methyl rate was based on sulfonylurea-tolerant soybean. Plants were designated survivors if the plants had functional green leaves and apical meristems.

Resistance to ALS inhibitors was high, as indicated by high survival frequencies following thifensulfuron-methyl across populations, with only four populations being completely controlled. Most survival fell into the low to moderate categories (Figure 1B); although 37 populations (2% to 16% range) were not significantly different from the control (P > 0.05), again suggesting genetic heterogeneity within these populations. Excluding those, 32 populations had low survival, with 31 categorized as moderately resistant, all of which had significantly more survivors than the designated control. While survival was relatively low compared with glyphosate survival, the rate applied was four times the manufacturer’s recommended rate for non-sulfonylurea-tolerant soybean, suggesting that these survivors are resistant (Anonymous 2012). The remaining six populations had high survival of 61% to 80%.
The survival and resistance observed in the tested populations were like those reported by Poirier et al. (Reference Poirier, York, Jordan, Chandi, Everman and Whitaker2014), who sampled in the same general region. Those researchers designated resistance in a population if any survivors were present following glyphosate and thifensulfuron-methyl at 840 g ae ha−1 and 17.5 g ha−1, respectively, which were the same rates evaluated in our study. Poirier et al. (Reference Poirier, York, Jordan, Chandi, Everman and Whitaker2014) determined that 98% and 97% of the 134 tested A. palmeri populations contained individuals resistant to glyphosate and thifensulfuron-methyl, respectively. Comparing our populations under the same metrics, 99% and 96% were resistant to these herbicides, respectively. These data suggest that resistance to glyphosate and thifensulfuron has remained relatively similar from 2010 to 2016. Whitaker (Reference Whitaker2009) screened 290 A. palmeri populations collected from NC in 2005 for resistance to glyphosate and thifensulfuron-methyl and reported that 49 (17%) and 52 (18%) populations were resistant to these herbicides, respectively. These data illustrate how in a 5- to 10-yr period there was a rapid and widespread incidence of glyphosate- and ALS-resistant A. palmeri occurring in NC.
KASP Assay for Thifensulfuron-Methyl Survivors
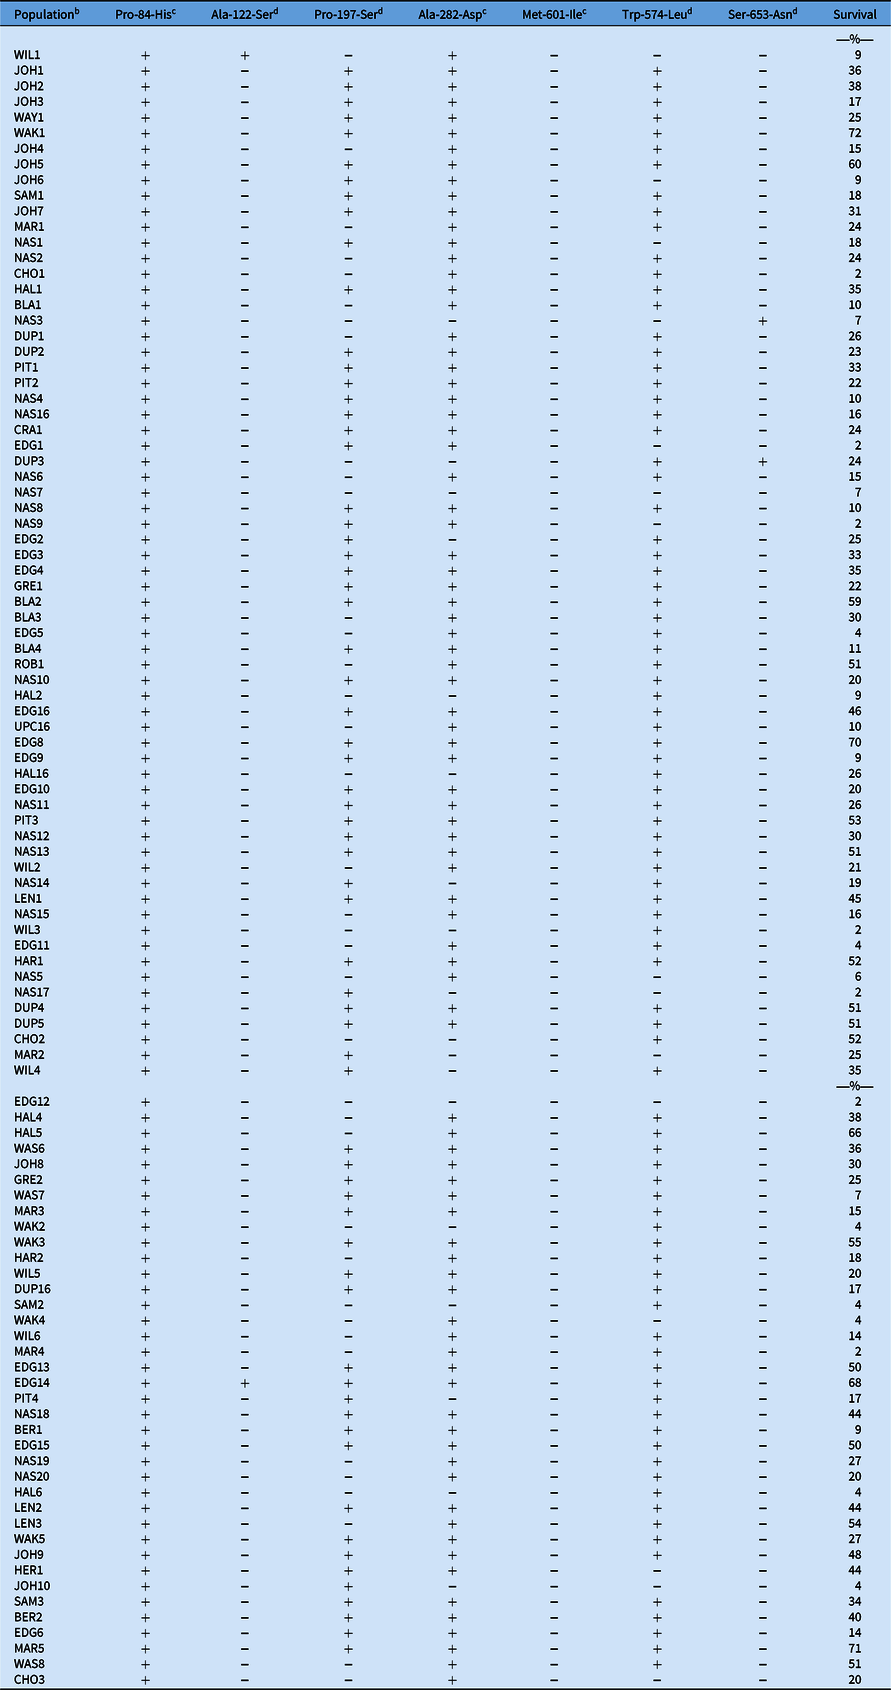
Analysis for mutation in the ALS gene was examined in 104 populations of A. palmeri with survivors as adequate tissue from 2 was not available. Of the total 1,167 plants surviving following the thifensulfuron-methyl application within these populations, 83% possessed at least one of the four known ALS resistance–conferring mutations (Table 4). The Trp-574-Leu mutation (53%) was the most common of the known mutations, followed by the Pro-197-Ser mutation (34%). The Pro-84-His mutation reported by Larran et al. (Reference Larran, Palmieri, Perotti, Lieber, Tuesca and Permingeat2017) was present in all of our tested samples, while the Met-601-Ile mutation was found in none. The authors noted these mutations may represent natural genetic variation and were observed outside the ALS conserved regions previously associated with target-site resistance. The third mutation reported by Larran et al. (Reference Larran, Palmieri, Perotti, Lieber, Tuesca and Permingeat2017), Ala-282-Asp, was more common in the surviving A. palmeri plants; however, it was generally associated with other known mutations. A total of 382 plants had the Ala-282-Asp mutation, but only 57 in total (5% of total survivors) had that mutation alone. Further research is needed to determine the level of resistance, if any, conferred by this mutation. Only 9% of the survivors did not possess any mutation, suggesting the resistance may be conferred by a different mutation or differing metabolism. Interestingly, no amplification was detected in 34% of survivors for the Ser-653-Asn mutation, suggesting the wild-type or known mutation was not present. Further, 2% of survivors were determined to have no known resistance-conferring mutation, but also had no amplification for the Ser-653-Asn mutation, suggesting another amino acid substitution may be conferring resistance to thifensulfuron-methyl. Other mutations (Ala-122-Thr and Pro-197-Ala) have more recently been determined to confer resistance, illustrating that other potential mutations have yet to be discovered (Heap Reference Heap2019). Further research is required to quantify the level of resistance, if any, conferred by the Ala-282-Asp mutation as well as the possibility of a new mutation at the Ser-653 site.
Mutations detected in the acetolactate synthase (ALS) enzyme and percent survival of Amaranthus palmeri following an application of thifensulfuron-methyl at 17.5 g ha−1. a

a Abbreviations: Pro-84-His, proline to histidine substitution; Ala-122-Ser, alanine to serine substitution; Pro-197-Ser, proline to serine substitution; Ala-282-Asp, alanine to aspartic acid substitution; Trp-574-Leu, tryptophan to leucine substitution; Met-601-Ile, methionine to isoleucine substitution; Ser-653-Asn, serine to asparagine substitution. Positive sign (+) means the mutation was present, while the minus sign (−) denotes that the mutation was not detected.
b County codes: BER, Bertie; BLA, Bladen; CHO, Chowan; CRA, Craven; DUP, Duplin; EDG, Edgecombe; GRE, Greene; HAL, Halifax; HAR, Harnett; HER, Hertford; JOH, Johnston; LEN, Lenoir; MAR, Martin; NAS, Nash; PIT, Pitt; ROB, Robeson; SAM, Sampson; UPC, Upper Coastal Plain Research Station; WAK, Wake; WAS, Washington; WAY, Wayne; WIL, Wilson.
c Mutations reported by Larran et al. (Reference Larran, Palmieri, Perotti, Lieber, Tuesca and Permingeat2017) in ALS-resistant A. palmeri populations.
d Known resistance-conferring mutations.
Fomesafen Bioassay
The resistance to ALS inhibitors and glyphosate has created limited PRE and POST herbicide control options for A. palmeri in crops such as cotton, peanut, and soybean (NCSU 2019). Growers have increased their reliance on PPO-inhibiting herbicides, such as fomesafen, in these crops to manage the resistant biotypes. While 106 of the 110 populations were completely controlled with fomesafen, 4 populations had 1% to 10% survivors (Figure 1C). Three of the populations were from Edgecombe County while the remainder was from Halifax County. Three of the four populations had very low survival of 1% to 2%, yet one population (EDG16), was in the 10% range. The populations with 2% (HAL16) and 10% survival were statistically different from the susceptible control (P = 0.0222 and < 0.0001, respectively). Survivors for the four populations (1% to 10%) were less than the Arkansas resistant standard (36% survival; P < 0.0001). While this is seemingly very low survival, when one considers the immense fecundity of A. palmeri, these frequencies can quickly increase if selection pressure remains high. Research in NC documented the average seed production from A. palmeri in competition with corn, cotton, peanut, and soybean was approximately 51,000, 534,000, 443,000, and 273,000 seeds plant−1, respectively (Mahoney Reference Mahoney2020). Additionally, plants in the greenhouse are generally considered more susceptible to herbicides than field-established plants, suggesting more control may be observed in this setting compared with a production field. The fact that survivors were present following a field use rate of fomesafen in the greenhouse at the proper application timing (with respect to weed size) is concerning and suggests these populations may be in the early stage of resistance development.
KASP Assay for Fomesafen Survivors
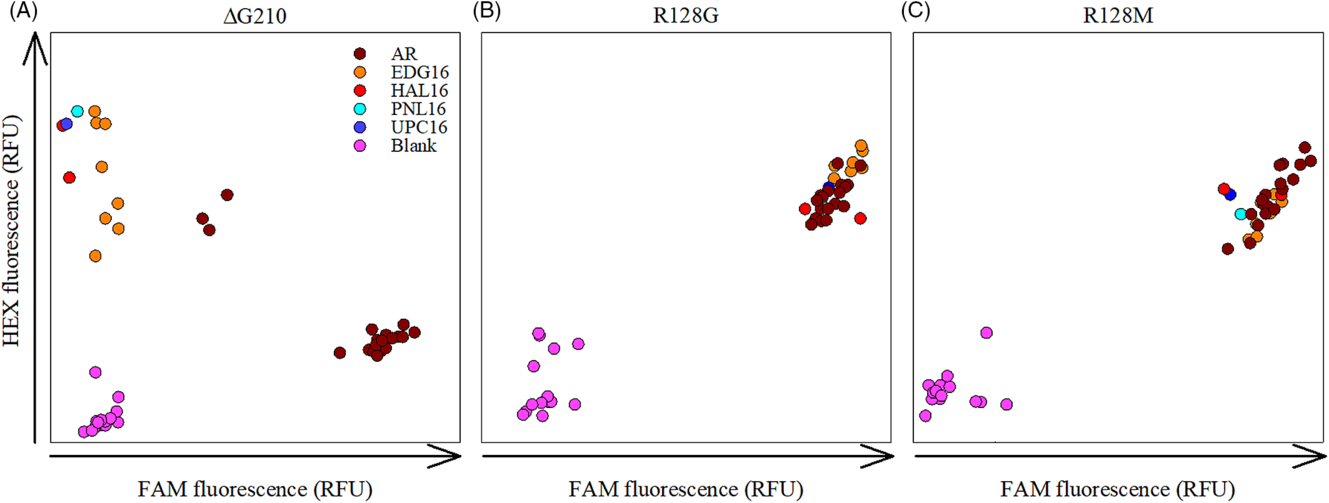
Other states in the midsouthern and midwestern United States have documented that genetic mutations (Giacomini et al. Reference Giacomini, Umphres, Nie, Mueller, Steckel, Young, Scott and Tranel2017; Salas et al. Reference Salas, Burgos, Rangani, Singh, Refatti, Piveta, Tranel, Mauromoustakos and Scott2017) and enzymatic herbicide metabolism (Varanasi et al. Reference Varanasi, Brabham, Norsworthy, Nie, Young, Houston, Barber and Scott2018b) are the mechanisms conferring resistance to PPO inhibitors in their A. palmeri populations. In NC, common ragweed (Ambrosia artemisiifolia L.) was determined to have a single nucleotide polymorphism at the Arg-98 position (synonymous with Arg-128 in A. palmeri) conferring resistance to PPO inhibitors (Heap Reference Heap2019). Figure 2A–C illustrates KASP analysis for the ΔG210, Arg-128-Gly, and Arg-128-Met mutations, which are known to confer resistance to PPO-inhibiting herbicides (Giacomini et al. Reference Giacomini, Umphres, Nie, Mueller, Steckel, Young, Scott and Tranel2017; Salas et al. Reference Salas, Burgos, Rangani, Singh, Refatti, Piveta, Tranel, Mauromoustakos and Scott2017). Survivors from the Arkansas populations all contained the ΔG210 mutation (Figure 2A), which has been previously reported in this population (Salas et al. Reference Salas, Burgos, Rangani, Singh, Refatti, Piveta, Tranel, Mauromoustakos and Scott2017). Survivors from the NC populations did not express the ΔG210 mutation (Figure 2A), with no population expressing the Arg-128-Gly (Figure 2B) or Arg-128-Met mutations (Figure 2C). While no resistance cluster occurred for the Arg-128 mutations to visualize this, the primers for these mutations were designed such that fluorescein (FAM) fluorescence would be expressed for the wild-type or nonmutant DNA. Fluorescence readings suggested amplification occurred and was confined to the FAM fluorescence region. Further research to characterize these populations will be discussed later.
Graphical representation of the Kompetitive Allele Specific PCR (KASP) assays completed for the ΔG210 (A), Arg-128-Gly (B), and Arg-128-Met (C) mutations. Populations are color coded according to the legend in A. Four populations from North Carolina are represented (EDG16, HAL16, PNL16, and UPC16) along with the herbicide-resistant standard from Arkansas (AR). Abbreviations: FAM, fluorescein; HEX, hexachlorofluorescein.

Mesotrione Bioassay
Sixty-eight populations were completely controlled by mesotrione (Figure 1D). Of the remaining 42 surviving populations, 41 had survival in the 1% to 10% range, with 37 of these having less than 5% survival. Unlike the populations surviving fomesafen, these populations were located in many counties across the NC Coastal Plain. Populations having 2% survival or lower (30 total) were not significantly different from the SS (P > 0.05), likely due to lack of genetic homogeneity, thus causing large error variance. One population from Bladen County, NC, consistently had higher survival, at 17% on average. These A. palmeri populations surviving mesotrione are the first documented incidence of resistance to an HPPD inhibitor in NC. Currently, HPPD-resistant A. palmeri has been reported in Kansas, Nebraska, and Wisconsin (Heap Reference Heap2019). Nakka et al. (Reference Nakka, Godar, Wani, Thompson, Peterson, Roelfos and Jugulam2017) reported that rapid detoxification of mesotrione within an A. palmeri population from Kansas compared with a susceptible (2.45-fold faster) was one mechanism conferring resistance. Additionally, this population had a 12-fold increase in HPPD gene expression compared with the susceptible, which also contributed to the observed resistance. Corn production area in NC averaged approximately 359,000 total ha over the past 10 yr (USDA-NSS 2018). Mesotrione is labeled for weed control in corn (Anonymous 2018). With the oncoming release of HPPD-tolerant cotton and soybean, the area treated with mesotrione could potentially increase nearly 3.4-fold or reach 1,215,000 ha in NC alone (Unglesbee Reference Unglesbee2018; USDA-NSS 2018). Proper stewardship for this technology is a must; otherwise, evolution of HPPD-resistant A. palmeri populations will occur quickly and become widespread.
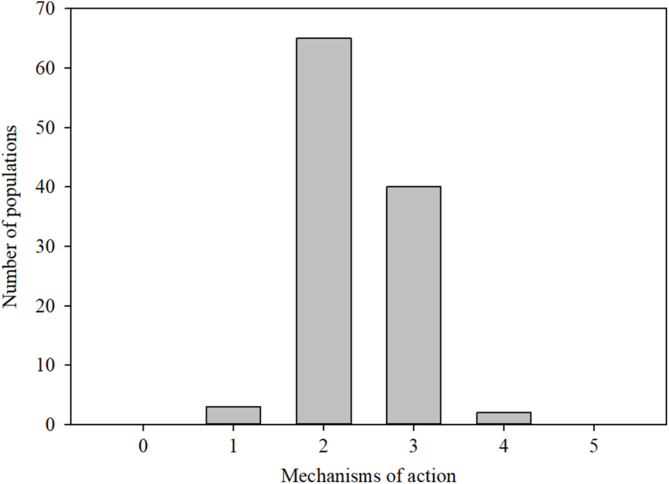
Of the 110 A. palmeri populations screened, none were completely controlled by all five tested SOAs and only three were controlled by all but one SOA (Figure 3). Most of these populations (65) were controlled by all but two SOAs, which were largely glyphosate and thifensulfuron-methyl. Greater cause for concern lies with A. palmeri populations with individuals surviving three (40) or four (2) SOAs. Based on our survey, growers can utilize glufosinate as one tool to manage these populations and mitigate further spread; however, great care should be taken to ensure the optimal application timing and rate are used to mitigate any survivors and reduce selection pressure. These populations illustrate the importance of proper herbicide stewardship in order to protect our current chemical weed management tools as well as to ensure the longevity of coming technologies. Farm managers must ensure that an integrated weed management approach is implemented and that escapes are minimized to mitigate additions of potentially resistant weed seeds to the soil seedbank.
Number of mechanisms of action survived by the 110 total Amaranthus palmeri populations tested from the North Carolina Coastal Plain region.

Herbicide Dose–Response Assays
Fomesafen Dose–Response Assay
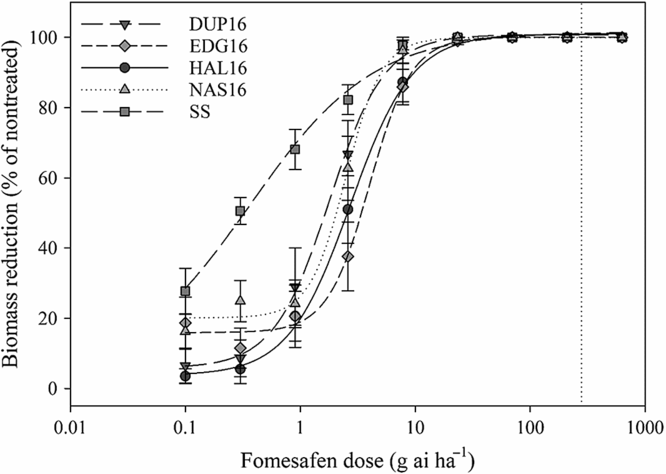
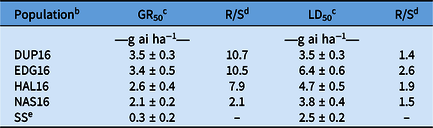
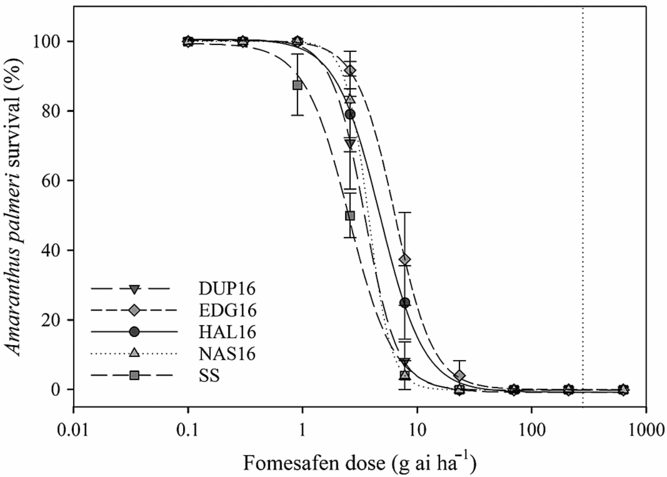
Further characterization of populations surviving HPPD and PPO inhibitors was done. Dose–response assays were conducted to determine the level of resistance compared to a known SS population. Increasing the dose of fomesafen reduced the dry weight and survival of all populations tested. The fomesafen dose required to cause a 50% reduction of A. palmeri biomass (GR50) was 6.3 to 10.7 times greater for all putative resistant populations compared with the SS (Figure 4; Table 5); however, these doses were still approximately 80 times lower than the field use rate of fomesafen. Even as the GR90 for EDG16 (9.3 g ha−1) and HAL16 (9.8 g ha−1) were 2.1 and 2.2 times greater than the SS (4.4 g ha−1), respectively, these dosages were well below the field use rate. The fomesafen dose required to kill 50% of the population (LD50) was 1.4 to 2.6 times greater in the four tested A. palmeri populations compared with the SS (Figure 5; Table 5). However, these values are also far below the field use rate of fomesafen. As with the GR90, the LD90 of EDG16 and HAL16 were well below the field use rate. While this may suggest a decrease in susceptibility of the population, the data suggest field use rates will still adequately control these populations.
Dose–response curves based on biomass reduction of Amaranthus palmeri populations from North Carolina following fomesafen application. Biomass reduction (% of nontreated) was recorded 14 d after fomesafen application. Treatments means (n = 12) plus 1 SE are plotted with the regression curves. A four-parameter logistic model best described the data: y = c + {(d – c)/[1 + (x/m)exp(−b)]}, where y is the biomass reduction, c is the minimum value, d is the maximum value, m is the point in the curve halfway between the minimum and maximum values, and b is the hillslope. The dotted vertical line denotes the field use rate. See note b to Table 4 for the key to county abbreviations.

The dose of fomesafen needed to reduce Amaranthus palmeri biomass 50% (GR50) or kill 50% of the population (LD50) for populations from North Carolina. a

a The 1X rate for fomesafen is 280 g ai ha−1.
b See note b to Table 4 for the key to county abbreviations.
c Value ± SE.
d Resistance levels (R/S) calculated using the GR50 or LD50 values of the field-collected populations relative to the susceptible standard.
e Susceptible standard.
Dose–response curves for survival of Amaranthus palmeri populations from North Carolina following fomesafen application. Survival (%) was recorded 14 d after fomesafen application. Treatments means (n = 12) plus 1 SE are plotted with the regression curves. A four-parameter logistic model best described the data: y = c + {(d – c)/[1 + (x/m)exp(−b)]}, where y is the percent survival, c is the minimum value, d is the maximum value, m is the point in the curve halfway between the minimum and maximum values, and b is the hillslope. The dotted vertical line denotes the field use rate. See note b to Table 4 for the key to county abbreviations.

Salas et al. (Reference Salas, Burgos, Rangani, Singh, Refatti, Piveta, Tranel, Mauromoustakos and Scott2017) observed greater increases in the R/S ratios of fomesafen-resistant A. palmeri compared with a susceptible population and reported the ΔG210 mutation within the PPX2 gene conferred this resistance. Additional research from Arkansas has noted the presence of Arg-128-Gly and Arg-128-Met mutations, which have been confirmed to confer resistance, are also present in the state (Varanasi et al. Reference Varanasi, Brabham, Norsworthy, Nie, Young, Houston, Barber and Scott2018b). In addition to the target-site mutations, metabolic resistance has also been indirectly implicated in one A. palmeri population from Arkansas (Varanasi et al. Reference Varanasi, Brabham and Norsworthy2018a). The authors suggested that resistance was due to an increase in cytochrome P450 monooxygenase (P450) and glutathione S-transferase activity.
The known resistance-conferring PPO gene mutations were not found in the NC A. palmeri populations (Figure 2A–C), which had survivors at the field use rate of fomesafen, suggesting survival may either be metabolism based, conferred by a novel (but weak) target-site mutation, or translocation based. While overall survival, GR50, and LD50 values were relatively low in these populations, they are still concerning, due to the immense fecundity of A. palmeri (Mahoney Reference Mahoney2020). Previous research by Norsworthy et al. (Reference Norsworthy, Griffith, Griffin, Bagavathiannan and Gbur2014) has illustrated how quickly resistance can spread throughout a field. Within 3 yr of introduction, A. palmeri infested 95% to 100% of the field. This demonstrates the critical need for a zero-tolerance policy for survivors, as one escape can become an increasing problem in a short amount of time.
Mesotrione Dose–Response Assay
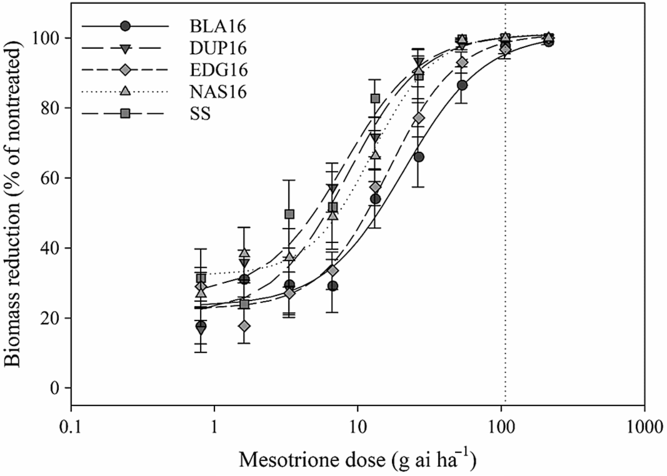
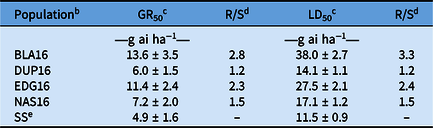
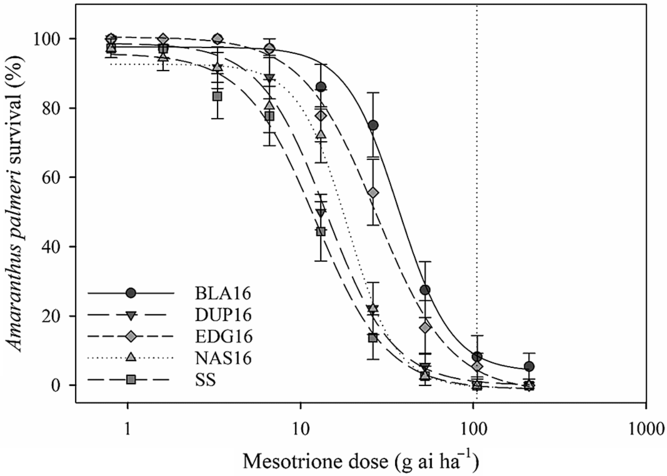
As with fomesafen, increasing the dose of mesotrione reduced the dry biomass and survival of all populations tested. The dose required to cause a 50% reduction in A. palmeri biomass (GR50) was 1.2- to 2.8-fold greater in all populations compared with the SS (Figure 6; Table 6). Populations BLA16 and EDG16 also had 1.6- to 2.3-fold increase in GR50 compared with the other designated “susceptible” populations (DUP16 and NAS16). The GR50 for populations BLA16 (13.4 g ha−1) and EDG16 (11.4 g ha−1) were about 12.5% of the POST field use rate. The GR90 for these populations were 65.8 and 43.5 g ha−1, respectively, which was 1.9 to 2.9 times greater than for the SS (23.1). The dose required to kill 50% of the A. palmeri populations (LD50) was 1.2 to 3.3 times greater in all populations compared with the susceptible standard (Figure 7; Table 6) with BLA16 and EDG16 again having increased LD50 values compared with DUP16 or NAS16 (1.6- to 2.7-fold). The LD90 rates for HAL16 (89.8 g ha−1) and EDG16 (72.8 g ha−1) were increased compared with the SS (33.4 g ha−1) and represent 86% and 69% of the full field use rate, respectively. Of note, 3 and 2 plants out of 36 sprayed from BLA16 and EDG16, respectively, survived the field use rate, while 2 from the BLA16 population survived the 2X rate.
Dose–response curves based on biomass reduction of Amaranthus palmeri populations from North Carolina following mesotrione application. Biomass reduction (% of nontreated) was recorded 21 d after mesotrione application. Treatments means (n = 16) plus 1 SE are plotted with the regression curves. A four-parameter logistic model best described the data: y = c + {(d – c)/[1 + (x/m)exp(−b)]}, where y is the biomass reduction, c is the minimum value, d is the maximum value, m is the point in the curve halfway between the minimum and maximum values, and b is the hillslope. The dotted vertical line denotes the field use rate. See note b to Table 4 for the key to county abbreviations.

The dose of mesotrione needed to reduce Amaranthus palmeri biomass 50% (GR50) or kill 50% of the population (LD50) for various populations from North Carolina. a

a The 1× rate for mesotrione POST is 105 g ai ha−1.
b See note b to Table 4 for the key to county abbreviations.
c Value ± SE.
d Resistance levels (R/S) calculated using the GR50 or LD50 values of the field-collected populations relative to the susceptible standard.
e Susceptible standard.
Dose–response curves for survival of Amaranthus palmeri populations from North Carolina following mesotrione application. Survival (%) was recorded 21 d after mesotrione application. Treatments means (n = 16) plus 1 SE are plotted with the regression curves. A four-parameter logistic model best described the data: y = c + {(d – c)/[1 + (x/m)exp(−b)]}, where y is the percent survival, c is the minimum value, d is the maximum value, m is the point in the curve halfway between the minimum and maximum values, and b is the hillslope. The dotted vertical line denotes the field use rate. See note b to Table 4 for the key to county abbreviations.

While these GR90 and LD90 rates are approximately half- and three-quarters of the field use rate, respectively, it is generally accepted that plants are more susceptible to herbicides when grown in the greenhouse than in the field. Nonetheless, these rates may occur in the field, which would allow these plants to produce seed. Reduced rates can be realized if the weed is too large at application, weather conditions prohibit adequate control, or weeds are present in difficult-to-spray areas (turnarounds, field edges, etc.) where seed can then be distributed at harvest or by tillage the following season (Norsworthy et al. Reference Norsworthy, Ward, Shaw, Llewellyn, Nichols, Webster, Bradley, Frisvold, Powels, Burgos, Witt and Barrett2012). Repeated exposure to (unintentional) reduced rates can lead to resistance evolution over several generations (Busi and Powles Reference Busi and Powles2009; Busi et al. Reference Busi, Neve and Powles2013).
Mesotrione-Survivor Progeny Comparison
When comparing the BLA16 progeny population at the 0.25X, 0.5X, and 1X rate to the original field population, survival after mesotrione treatment increased in the progeny population. Both the field population (19 of 36 plants) and progeny (8 of 8 plants) had significant survival at the 0.25X rate. Survival of the progeny remained high at the 0.5X rate (7 of 8 plants) but was less for the field population (9 of 36 plants). At the 1X rate, only 3 of 36 plants survived from the field population, while 6 of 12 plants survived among the progeny population. These data demonstrate that the ability to survive mesotrione treatment was inherited by the progeny of the BLA16 population and also increased the frequency of survival; thus, we documented the first HPPD-resistant A. palmeri population in the southeastern United States.
Resistance to HPPD-inhibiting herbicides has previously been documented in Amaranthus species. Kaundun et al. (Reference Kaundun, Hutchings, Dale, Howell, Morris, Kramer, Shivrain and Mcindoe2017) reported a mesotrione-resistant waterhemp [Amaranthus tuberculatus (Moq.) Sauer] population from Nebraska having a 45.5-fold higher GR50 compared with a susceptible population. The authors hypothesized that resistance could be due to increased metabolism or reduced translocation of mesotrione in the plant. Olivera et al. (Reference Olivera, Jhala, Gaines, Irmak, Amundsen, Scott and Knezevic2017) reported a 13.2-fold increase in mesotrione required to achieve 50% control of another A. tuberculatus population from Nebraska compared with a susceptible population. The authors also reported a 17.8-fold increase in GR50 using dry biomass data value of the resistant versus the susceptible population. Reported R/S ratios for HPPD-resistant A. palmeri populations are generally lower than what has been observed in A. tuberculatus. Jhala et al. (Reference Jhala, Sandell, Rana, Kruger and Knezevic2014) determined a 4.6- to 4.9-fold increase in GR50 values for mesotrione when comparing a resistant A. palmeri population with two susceptible populations. To achieve 50% control of the resistant population, 3.5- to 4.7-fold more mesotrione was needed. The mechanism for resistance was not determined, but cross-resistance to other HPPD-inhibiting herbicides was noted. Küpper et al. (Reference Küpper, Peter, Zöllner, Lorentz, Tranel, Beffa and Gaines2018) reported a 3.3-fold increase in LD50 of an A. palmeri population from Nebraska with tembotrione. The authors hypothesized that metabolism, likely by cytochrome P450s, conferred the resistance. A higher level (10.1- to 17.8-fold) of A. palmeri resistance to mesotrione was reported in Kansas (Nakka et al. Reference Nakka, Godar, Wani, Thompson, Peterson, Roelfos and Jugulam2017). In this case, the resistant plants metabolized mesotrione faster and also produced more copies of the HPPD gene, factors that were determined to confer resistance in this population. This is the first instance of HPPD-resistant A. palmeri documented in the Southeast (Heap Reference Heap2019). Further research and characterization on the EDG16 and HAL16 populations is warranted.
Implications
Resistance to glyphosate and ALS-inhibiting herbicides within A. palmeri populations continues to be commonplace throughout the NC Coastal Plain region. Farm managers often use other herbicide SOAs to combat resistant populations. The data suggest little to no fitness penalties associated with these resistance traits (Ward et al. Reference Ward, Webster and Steckel2013), which allowed the rapid spread of resistance alleles in the NC Coastal Plain with time. Widespread resistance to glyphosate and ALS inhibitors has imposed heavy reliance on other herbicides such as glufosinate and PPO inhibitors. While the production of glufosinate-tolerant crops has continued to increase (USDA 2018), no survivors following glufosinate application were observed in any population at the tested rate. The survivors following fomesafen and mesotrione applications are concerning and will present many management challenges in the seasons ahead.
More populations were observed surviving mesotrione application than surviving fomesafen; however, because of the immense fecundity of A. palmeri, even the relative low incidence of survival following fomesafen is still worrisome. Two populations (BLA16 and EDG16) had 1.6- to 3.3-fold increases in LD50 values compared with three susceptible populations. Furthermore, BLA16 was confirmed resistant to mesotrione based on increased survivors and GR50 value in the progeny population compared with the parent population. This is the first detected HPPD-resistant population in the southeastern United States and is a concern, considering the oncoming release of HPPD-tolerant cotton and soybean. A coordinated effort among growers is necessary to monitor populations in their current locations and prevent their spread. Future work will seek to characterize these surviving populations and determine multiple-resistance frequencies and the mechanisms conferring the potential resistance.
Supplementary material
To view supplementary material for this article, please visit https://doi.org/10.1017/wsc.2020.67
Acknowledgments
The authors thank the North Carolina Agricultural Foundation for providing partial funding for this research. The authors also thank Gina Brown-Guedira, Kim Howell, and Jared Smith (U.S. Department of Agriculture–Agricultural Research Service Eastern Regional Small Grains Genotyping Lab) for their assistance with DNA isolation and analysis. No conflicts of interests have been declared.