Implication
The carcass attributes are difficult to measure on a large scale. Consequently, these variables are rarely included in sheep breeding schemes. However, molecular markers can provide useful information for marker-assisted selection in order to improve them. Our results indicated the existence of mutations associated with the carcass traits in Santa Ines sheep. This represents an important advance in knowledge of the genetic control of these variables. In addition, our results can impact the production system of this breed, as the breeders have a new source of information to improve carcass quality.
Introduction
The Santa Ines is a hair sheep breed with two important characteristics for use in the tropical areas: it is relatively resistant to heat (McManus et al., Reference McManus, Paludo, Louvandini, Gugel, Sasaki and Paiva2009) and endoparasites (Mexia et al., Reference Mexia, De-Macedo, De-Oliveira, Zundts, Yamamoto, Santello, Carneiro and Sasa2011) compared with wool sheep breeds; its performance in a pasture system (Jucá et al., Reference Jucá, Faveri, Melo-Filho, Ribeiro-Filho, Azevedo, Muniz, Pedrosa and Pinto2014) and its meat and carcass traits (Jucá et al., Reference Jucá, Faveri, Melo-Filho, Ribeiro-Filho, Azevedo, Muniz and Pinto2016) have been extensively studied, confirming that this breed requires selection to improve its carcass traits. However, classical selection methods often fail to improve the carcass traits because they are difficult to evaluate in vivo. In this context, molecular markers in candidate genes may provide new information for selection.
The growth hormone (GH) and IGF type-1 (IGF1) affect several tissues and organs and play key roles in the longitudinal growth of an organism (Devesa et al., Reference Devesa, Almengló and Devesa2016). The GH and IGF1 are closely associated because the GH induces liver IGF1 transcription which in turn negatively controls the pituitary GH secretion. Then, polymorphisms in GH and IGF1 may contain useful information for the selection of traits correlated with body growth, such as carcass traits.
Some polymorphisms in GH in sheep were tested for their association with BW and morphometric traits (Nasution et al., Reference Nasution, Arnim, Jamsari and Syofyan2017; Abdelmoneim et al., Reference Abdelmoneim, Brooks, Afifi and Swelum2017), milk production (Dettori et al., Reference Dettori, Pazzola, Pira, Paschino and Vacca2015), wool production (Farag et al., Reference Farag, Darwish, Darwish, AbdelAziz, Ramadan, Mohamed and Othman2016) and carcass traits (Gorlov et al., Reference Gorlov, Kolosov, Shirokova, Getmantseva, Slozhenkina, Mosolova, Bakoev, Leonova, Kolosov and Zlobina2017). Although previous studies have already mentioned about association between polymorphisms in GH gene and the carcass traits in sheep, several phenotypes remain to be evaluated.
Polymorphisms in IGF1 have been evaluated in association studies for lactation persistence in Gentile di Puglia, Altamurana and Sarda sheep breeds (Scatà et al., Reference Scatà, Catillo, Annicchiarico, De-Matteis, Napolitano, Signorelli and Moioli2010), prolificity in Small Tail Han sheep (He et al., Reference He, Zhang, Chu, Wang, Feng, Cao, Di, Fang, Huang, Tang and Li2012) and growth traits in Soviet Merino breed (Trukhachev et al., Reference Trukhachev, Skripkin, Kvochko, Kulichenko, Kovalev, Pisarenko, Volynkina, Selionova, Aybazov, Shumaenko, Omarov, Mamontova, Yatsyk and Krivoruchko2016) and in Iranian Zandi sheep (Nazari et al., Reference Nazari, Noshary and Hemati2016). Although there are no reports about polymorphisms in association with carcass traits in sheep, the IGF1 expression levels have been associated with carcass traits in ovine (Su et al., Reference Su, Sun, Li, Wang, Lv, Musa, Chen, Zhang and Wu2014; Sun et al., Reference Sun, Su, Li, Musa, Kong, Ding, Ma, Chen, Zhang and Wu2014). In addition, Islam et al. (Reference Islam, Vinsky, Crews, Okine, Moore, Crews-JR and Li2009) reported about the effects of polymorphisms in IGF1 on the carcass traits in beef cattle. Therefore, IGF1 is also a potential candidate gene for carcass traits in sheep, requiring further exploration in association tests. Thus, the objective of this study was to identify polymorphisms in GH and IGF1 in Santa Ines sheep in order to describe their allelic and genotypic frequencies as well as to test whether they are associated with carcass traits.
Material and methods
Animals and phenotypes
We evaluated 191 Santa Ines lambs at ~240 days of age. Of these sheep, 105 were born between 2010 and 2012 on the experimental farm of the EMBRAPA Tabuleiros Costeiros; whereas, 86 were born in 2014 and raised on the experimental farm of the Federal University of Bahia. In all animals, BW at slaughter was measured after a fasting period of 16 h. After slaughter, the blood, head, feet, reproductive system and hot carcass weights (HCW) were measured (Table 1). In addition, the hot carcass yield (HCY=HCW/BW×100) was recorded and expressed in percent. The carcasses were cooled in a cold chamber for 24 h at 2°C and weighed to obtain the cold carcass weight (CCW) and the cold carcass yield (CCY=CCW/BW×100).
Sample size (n), mean and SD of the carcass traits in Santa Ines sheep

The carcass morphometric traits (Table 1) were obtained using a tape measure and compass. The carcass internal length (maximum distance between the cranial border of the pubis and the cranial border of the first rib at its midpoint), carcass external length (maximum distance between the cervical–thoracic joint and the first intercoccygeal joint), leg length (maximum distance between the major trochanter of the femur and the lateral border of the tarsus–metatarsal joint), carcass width at the thoracic region (maximum width of carcass measured at the rib level), thoracic depth (maximum distance between the sternum and the withers), carcass width at the rump region (maximum width of the carcass between the trochanters of the femurs) and rump girth (perimeter based on the trochanters of the femurs) were measured.
Visual scores from 1 to 5 were used to classify the carcasses for conformation and finishing (Table 1). Conformation visual scores were assigned as follows, according to the carcass musculature profile: 1 (concave profile – poor conformation), 2 (rectilinear profile – reasonable conformation), 3 (subconvex profile – good conformation), 4 (convex profile – very good conformation) and 5 (hyperconvex profile – excellent conformation). Carcass finishing visual scores were assigned according to the amount of fat on the carcass: 1 (very low quantity – very lean carcass), 2 (low amount – lean body), 3 (mean amount – mean carcass), 4 (high quantity – fatty carcass) and 5 (very high quantity – extremely fatty carcass).
The carcasses were sectioned in the middle; in the left half portion, a transversal cut was made between the 12th and 13th rib for the measurement of the rib eye area (Table 1). The contour of the cranial portion of the longissimus muscle was drawn on a transparent sheet with a pen to calculate the area after the scanning of the images in computational software.
The left half portion of the carcass was subdivided into five sections: palette (bone base: scapula, humerus, radius and ulna), neck (distance between the first and seventh cervical vertebrae), rib (distance between the first and 13th thoracic vertebra), leg (section between the last lumbar and the first sacral vertebras) and loin (lumbar vertebrae and muscles of this region). The yields (Table 1) of commercial cuts were calculated as a function of live weight at slaughter.
Extraction of genomic DNA and polymerase chain reaction
A 5-ml sample of blood was collected in ethylenediaminetetraacetic acid-containing vacutainer tubes and refrigerated at 4°C. Leukocytes were extracted following the protocol described by Oliveira et al. (Reference Oliveira, Regitano, Roese, Anthonisen, Patrocínio, Parma, Scagliusi, Timóteo and Jardim2007) and sent to the São Paulo University for extraction of the genomic DNA. The DNA extraction was performed using the salt precipitation method and proteinase K digestion, according to Oliveira et al. (Reference Oliveira, Regitano, Roese, Anthonisen, Patrocínio, Parma, Scagliusi, Timóteo and Jardim2007).
The primer design for amplification of the genes was made by observing the available sequence in the National Center for Biotechnology Information (NCBI) database NC_019460.2 (IGF1) and NC_019468.2 (GH), of the sheep genome (Ovisaries, version Oar_v4.0). The oligonucleotides were designed using the software package Primer 3 (http://bioinfo.ut.ee/primer3-0.4.0/). Net Primer was used to test the quality of the sequences using the rating parameters of >90%, the melting temperature (Tm) of the sense and anti-sense primers varied only by ±1°C and when the primers did not have dimer or cross dimer (http://www.premierbiosoft.com). After selecting the forward and reverse primers, basic local alignment search tool was used for sequence alignment in NCBI (http://blast.ncbi.nlm. Nih.gov/Blast.cgi) and to confirm the similarity with Ovisaries. The forward (GTGCTGCTTTTGTGATTTCTTG) and reverse (GATAGAAGAGATGCGAGGAGGA) primers were used for the amplification of 4.550 bp of IGF1 between the regions of exon 1 to 2. For the GH gene, the forward (GCTGCTGACACCTTCAAAGA) and reverse (TGACCCTCAGGTACGTCTCC) primers were used for the amplification of 1194 bp, amplifying the region between exons 1 and 5.
For the PCR, we used 15 μl of the reaction mixture, containing 0.3 mM of each primer, Taq polymerase and 100 ng of the template DNA. The amplified products were evaluated for the presence of the desired bands using a pool of Santa Ines sheep DNA as a positive control. For the IGF1, a touch-down PCR was performed (initial denaturation: 98°C/5 min, followed by 10 denaturation cycles at 98°C/10 s, annealing at 61°C to 56°C, reducing −0.5°C at each cycle, for 30 s, and extension at 72°C/4 min. Following another 30 cycles with denaturation temperature at 98°C/10 s, annealing at 56°C/30 s and extension at 72°C/4 min, ending with an extension at 72°C/5 min). For GH amplification, a touch-down PCR was performed (initial denaturation: 98°C/5 min, followed by 20 denaturation cycles at 98°C/10 s, annealing at 63°C to 53°C, reducing −0.5°C at each cycle, for 30 s, and extension at 72°C/1 min. Following another 20 cycles with denaturation temperature at 98°C/10 s, annealing at 53°C/30 s and extension at 72°C/1 min, ending with an extension at 72°C/5 min).
Purification of amplicons and sequencing of libraries
The amplicons were purified with magnetic beads, and the recommended volume of AgencourtAMPure XP (Beckman Coulter, Brea, CA, USA) was used to homogenize the beads so as to bind to the amplified products. Immediately after this step, the samples were purified with 70% ethanol to remove the contaminants. The pellets were then diluted, and the beads were removed. The samples were diluted to 2 nM, considering the base pair size of the amplified products. The samples were quantified with Qubit® fluorometer (Life Technologies, Carlsbad, CA, USA) and diluted to 0.2 ng/μl for library preparation.
The Nextera® XT DNA sample preparation and the Nextera® XT index (Illumina, San Diego, CA, USA) were used to prepare the library; all steps were performed based on the Nextera XT protocol. Sequencing was performed on the MiSeq platform (Illumina) by using the MiSeq Reagent Kit v2 (500 cycles).
Cleaning and aligning the reads
The qualities of the reads were verified by the FastQC software (www.bioinformatics.bbsrc.ac.uk/projects/). For the first data filtering, the SeqyClean software version 1.3.12 (Zhbannikov et al., Reference Zhbannikov, Hunter and Settles2013) was used, adopting a quality parameter of 24 (Phred score) for each base and a minimum length of 50 bp. Subsequently, the reads were aligned against the reference sheep genome deposited in the NCBI (version Oar_v4.0) by using the Bowtie2 program (Langmead and Salzberg, Reference Langmead and Salzberg2012).
Polymorphism detection and structural annotation
The detection of polymorphisms was performed based on the position in the reference sheep genome (version Oar_v4.0): IGF1 (171 037 883–171 113 228 bp) and GH (47 485 651 to 47 487 536 bp). In this step, the SAM tools software (version 1.4; Li and Durbin, Reference Li and Durbin2009) was used. The PCR duplicates were then removed, the sequences were sorted and the index of the ordered file was constructed. The variant call was performed using the mpileup option of the SAM tools, covering a value set for the quality of the mapping through the genome reference (−q20) and a filter quality ⩾40 bases in the Phred (−q40) scale. We used the bcf tools command to convert the file form *.bcf to *.vcf. In this case, we performed more than 99 999 reads for this variant. Finally, the functional annotation of the single nucleotide polymorphisms (SNPs) and INDELs was performed using the variant effect predictor for the online annotation of Ensembl in order to identify the locations of the mutations across different regions of the genome and the possible functional effects of the variants.
Genotypic and allelic frequencies and association analysis
The allelic and genotypic frequencies were estimated for each locus by counting the alleles and genotypes, respectively, using the Statistical Analysis System (Statistical Analysis System, 2004). The Hardy–Weinberg equilibrium (HWE) was tested by comparing the predicted × observed heterozygosity. The predicted heterozygosity was obtained using the formula: PH=2(1–MAF) (MAF), where, MAF is the minor allele frequency.
The association test was conducted using the Qxpak 5 program (Pérez-Enciso and Misztal, Reference Pérez-Enciso and Misztal2011), which performs a likelihood ratio test. The general model can be described as,
 $$y{\equals}\beta X{\plus}\mathop{\sum}\limits_{k{\equals}1}^n {Z\delta _{k} {\plus}{\epsilon}} $$
, where y is the vector containing the recorded traits, β is the vector of estimated solutions for the fixed effects, δ
k
is the solutions vector for the genetic effects for any of the n quantitative trait loci affecting the trait, X and Z are the incidence matrices that associate observations in y to the solutions β and δ
k
vectors and ε is the residuals’ vector. The fixed effects included in the model were farm (2 levels), year (4 levels), month of birth (10 levels) and the covariates BW and animal’s age at the time of slaughter. For the yield traits, the covariate BW was not included in the model. The genetic effects included the additive and dominance effects. The additive effect is the contrast between homozygous genotypes, and when its value is positive, the mutant allele is associated with higher mean value; in another case, no-mutant homozygous showed higher mean values. The dominance effect indicates deviation in the heterozygous mean value from the homozygote mean value. When the dominance effect is positive, the mean value of the heterozygous is closer to the mean value of mutant homozygous; in another case, it is closer to the no-mutant homozygous. Bonferroni correction was used to establish the level of significance, and P<0.05 was considered as suggestive associations.
Results
Polymorphisms
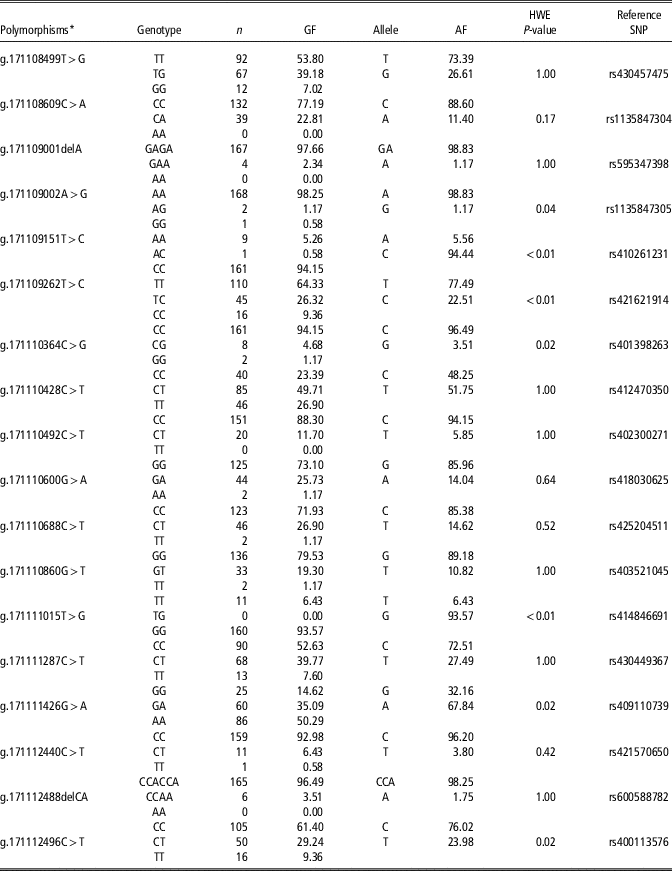
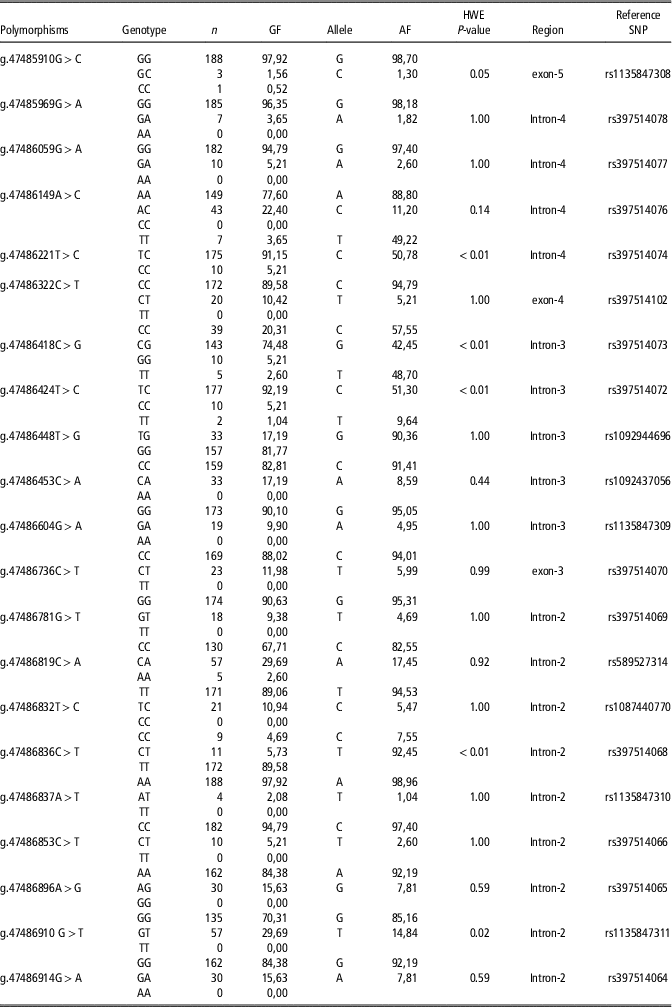
For IGF1, 20 samples did not amplify, which may be due to some mutation in the primer alignment region in these animals. Therefore, 171 animals were sequenced for IGF1 and 191 animals for GH. In addition, 18 polymorphisms were found in the IGF1 (Table 2) and 21 in the GH (Table 3).
Sample size (n), genotype (GF) and allelic (AF) frequencies, and Hardy–Weinberg equilibrium (HWE) for the single nucleotide polymorphisms (SNP) in IGF type-1 gene of Santa Ines sheep

* All polymorphisms are in the intron-1.
Sample size (n), genotype (GF) and allelic (AF) frequencies, and Hardy–Weinberg equilibrium (HWE) for the single nucleotide polymorphisms (SNP) in growth hormone gene of Santa Ines sheep

All markers in the IGF1 were present in intron-1, and the SNPs rs1135847304 and rs1135847305 are novel polymorphisms. The SNP rs1135847304 is in HWE and showed genotypic frequencies of 77.19% (CC) and 22.81% (CA), whereas the rs1135847305 showed frequencies of 98.25% (AA), 1.17% (AG) and 0.58% (GG), but not in HWE.
For the GH, 18 polymorphisms were present in intron and three in exon (Table 3). The SNPs rs1135847308, rs1135847309, rs1135847310 and rs1135847311 are novel polymorphisms that showed mutant allele frequencies of 1.30%, 4.95%, 1.04% and 14.84%, respectively. Among polymorphisms in GH gene, only the rs1135847311 is not present in HWE.
The SIFT score predicts whether an amino acid change affects the function of the protein. The SNP with SIFT >0.05 is considered tolerable because its exchange cannot alter the function of the protein, but mutations with SIFT ⩽0.05 are considered non-tolerable, as the amino acid change alters the function of the protein, even inactivating its function (Ng and Henikoff, Reference Ng and Henikoff2003). Among the polymorphisms detected in the exon region of GH, the SNP rs1135847308 is a silent mutation located in exon-5, as the base exchange does not alter the amino acid threonine (amino acid 168 in the protein), whereas the other two mutations in exon are non-synonymous. The SNP rs397514102 in exon-4 is a tolerable mutation, as its SIFT score was 0.22, which indicates that the exchange of valine by isoleucine (amino acid 123) does not affect the function of the protein. The SNP rs397514070 in exon-3 is not tolerable because its SIFT score was 0.01, which indicates that the exchange of the amino acid arginine for histidine (amino acid 60) can affect the function of the protein.
Association analysis
The IGF1 polymorphisms rs430457475, rs412470350, rs409110739 and rs400113576 had additive effect on the internal carcass length (−0.9265±0.4223), rump girth (−2.9285±1.1473), rib yield (−1.0003±0.4588) and neck weight (−0.0567±0.0278), respectively. In addition, the SNP rs430457475 showed dominance effects on the cold and HCYs, CCW and palette weight (Table 4).
Additive (a) and dominance (d) effects with its respective SE, in the association tests of polymorphisms in Santa Ines sheep

LRT=likelihood ratio test.
*Significant association at Bonferroni level (P<0.0055).
The polymorphisms rs58957314 in the GH had an additive effect on the rib weight (−0.4380±0.1272) and rib yield (−2.2680±0.6970), loin weight (−0.1893±0.0516) and loin yield (−0.9423±0.3259), palette weight (−0.2265±0.0779) and palette yield (−0.9424±0.4184), leg weight (−0.3960±0.1375), neck weight (−0.0851±0.0394) and the carcass finishing score (−0.1700±0.0839).
Discussion
Polymorphisms
The present study revealed two novel polymorphisms in IGF1 and four in the GH gene sequences of sheep. However, these polymorphisms showed small frequencies (Tables 2 and 3) for the mutant allele and several of them showed no-mutant homozygous animals. This made it difficult to use these novel polymorphisms to estimate the additive and dominance effects. We observed the well-conserved exon regions of these genes in Santa Ines. As the Santa Ines is a breed selected for growth, possible mutations in exon that positively affect the growth may have been fixed through selection. Similar results have been observed in previous studies with sheep. For example, Abdelmoneim et al. (Reference Abdelmoneim, Brooks, Afifi and Swelum2017) sequenced 2117 bp of GH in Harri sheep and found only one SNP at exon-4. Trukhachev et al. (Reference Trukhachev, Skripkin, Kvochko, Kulichenko, Kovalev, Pisarenko, Volynkina, Selionova, Aybazov, Shumaenko, Omarov, Mamontova, Yatsyk and Krivoruchko2016) found 18 SNPs in IGF1 in Russian Soviet Merino sheep, but only one at the exon region.
The three SNPs in the exons of GH showed mutant alleles with low frequencies. No homozygous mutant was observed for the SNPs rs397514102 and rs397514070, whereas only one lamb was found to be homozygous for the mutant allele of rs1135847308. Previous studies with sheep indicated that mutations in the exons of GH may be deleterious. The variation A781G in the exon-2 of GH was studied by Seevagan et al. (Reference Seevagan, Jeichitra, Rajendran and Tirumurugaan2015) using Vembur sheep and Kumari et al. (Reference Kumari, Kumar, Meena, Jyotsana, Prince and Kumar2014) with nine other sheep breeds. This variation caused an amino acid change from serine to glycine, but the homozygous BB genotype was absent in both the studies. Thus, Seevagan et al. (Reference Seevagan, Jeichitra, Rajendran and Tirumurugaan2015) considered this variation as a possible embryonic deleterious effect. Thus, the missense mutation (rs397514070) found in exon-3 of GH in Santa Ines sheep may also be a deleterious mutation. However, a study with more animals and other sheep breeds is required to confirm this hypothesis.
Insulin-like growth factor type-I association tests
Our results indicated that polymorphisms in IGF1 can be used for improving some carcass traits, because the additive effect were observed for the internal carcass length, rump girth, rib yield and neck weight (Table 2). The differences between homozygous genotypes were 1.85 cm (internal carcass length), 5.86 cm (rump girth), 2.00% (rib yield) and 0.1134 kg (neck weight), which can result in economic impacts on large-scale activity. The no-mutant alleles of SNPs rs43057475 and rs412470350 were associated with the largest values of the internal carcass length and rump girth, respectively, whereas the mutant alleles of rs409110739 and rs400113576 were associated with higher means of rib yield and neck weight, respectively. The frequencies of alleles associated with the largest mean values were 73.39% (rs430457475), 48.25% (rs412470350), 67.84% (rs409110739) and 23.98% (rs400113576). Therefore, there are wide frequencies of these SNPs for the selection purpose.
According to the sequences deposited in the NCBI, IGF1 have 75 346 bp, but due to financial reasons, we sequence 6% (4550 bp) of IGF1, including exons 1 to 2. We chose this region around the intron-1, as a previous study about sheep already reported effects on the growth traits. Trukhachev et al. (Reference Trukhachev, Skripkin, Kvochko, Kulichenko, Kovalev, Pisarenko, Volynkina, Selionova, Aybazov, Shumaenko, Omarov, Mamontova, Yatsyk and Krivoruchko2016) evaluated Russian Soviet Merino sheep and found significant effect of the SNPs c.-5363C>T, c.-5188G>C, c.-5186G>A and c.-4088G>A, all located in the intron-1, associated with BW. In addition, the SNP c-91A>C influenced the BW, croup and withers heights as well as the width and length of rump. This previous result already indicated the possibility of having effects of polymorphisms at intron-1 on the carcass traits. However, to the best of our knowledge, the present study is the first to report SNP in IGF1, affecting carcass traits in sheep. The results of the present study confirmed some other previous findings. Su et al. (Reference Su, Sun, Li, Wang, Lv, Musa, Chen, Zhang and Wu2014) reported that IGF1 expression in the longissimus dorsi muscle was positively and significantly correlated with the diameter of the muscle fibers, indicating that polymorphisms in this gene may affect meat production in sheep. In addition, Sun et al. (Reference Sun, Su, Li, Musa, Kong, Ding, Ma, Chen, Zhang and Wu2014) reported that the level of IGF1 expression was positively correlated (P<0.01) with BW and carcass weight (P<0.05) in Hu sheep.
Growth hormone association tests
We found association of SNP rs589527314 with the weights and yields of several carcass cuts and the carcass finishing score (Table 4). The differences between the homozygous (CC and AA) were 0.876 kg and 4.54% (rib), 0.379 kg and 1.89% (loin), 0.453 kg and 1.89% (palette), 0.792 kg of leg, 0.170 kg of neck and 0.34 scores of carcass finishing. The no-mutant allele (C) was associated with higher mean values of these traits and it had high frequency (82.55%) in this population. However, the CC frequency (67.7%) is not very high and may be increased to improve the carcass quality of Santa Ines sheep.
According to the sequences deposited in NCBI, GH has 1886 bp, but for financial reasons, we could sequence 63.3% (1194 bp) of this sequence, including exons 1 to 5. Several previous studies evaluated polymorphisms in this fragment of sheep GH and reported associations with growth traits. Using PCR–SSCP, Moradian et al. (Reference Moradian, Mohamadi, Razavi-Sheshdeh, Hajihosseinlo and Ashrafi2013) reported an effect of polymorphism on exon-4, which affected BW in Makooei sheep, whereas Jia et al. (Reference Jia, Zhang, Wu, Ha and Li2014) reported polymorphisms in exon-4, which affected the BW and morphometric traits in the Tibetan and Poll Dorset breeds. Using PCR–RFLP and restriction enzyme, Malewa et al. (Reference Malewa, Hakim, Maylinda and Husain2014) identified polymorphisms associated with the weaning weight and growth rate in Donggala and East Java breeds, whereas Nasution et al. (Reference Nasution, Arnim, Jamsari and Syofyan2017) reported an association with growth and morphometric traits in sheep of the Jambi Province, Indonesia. Cauveri et al. (Reference Cauveri, Sivaselvam, Karthickeyan, Tirumurugaan, Kumanan and Venkataramanan2016) found an association (P<0.05) between the SNP G480A in the intron-1 and weaning weight and preweaning weight gain in Nilagiri sheep. Han et al. (Reference Han, Sun and Li2016) reported the effects of SNPs g.616 G>A (intron-2) and g.498 G>C (exon-2) on BW and morphometric traits of Chinese sheep breeds, whereas Abdelmoneim et al. (Reference Abdelmoneim, Brooks, Afifi and Swelum2017) reported SNPs in the intron-2 (G871A), exon-4 (G1383A) and intron-4 (A1509G), associated with BW and weight gain in Harri sheep in Saudi Arabia. Therefore, it is expected that there are also effects on carcass traits, since they are, at some level, correlated with the BW. However, only few carcass traits were explored in association tests with polymorphisms in GH in sheep. Gorlov et al. (Reference Gorlov, Kolosov, Shirokova, Getmantseva, Slozhenkina, Mosolova, Bakoev, Leonova, Kolosov and Zlobina2017) were the only ones to report a GH/HaeIII gene polymorphism associated with carcass traits such as carcass weight and yield of carcass as well as the heart and kidney weight in Russian Salsk sheep. Therefore, the present study reinforced the hypothesis that polymorphisms in GH influenced the carcass traits in sheep, but we identified potential SNPs that explained these effects.
In conclusion, we identified several mutations in IGF1 and GH genes and some polymorphisms in association with carcass traits in Santa Ines sheep, including weights and yields of carcass and commercial cuts. Thus, this study showed that polymorphism in IGF1 and GH may provide important information for marker-assisted selection schemes in Santa Ines sheep. However, we did not find causal mutation, and the main hypothesis is the linkage disequilibrium between intronic mutations associated with carcass traits and the causal mutation into these genes or nearby genes. Therefore, future investigations are necessary to extend our findings and to identify the causal mutation.
Acknowledgments
The authors thank to FAPESB for the financial support to the project APP0116/2009; to CNPq for financial support to projects 562551/2010-7 and 474494/2010-1; to Embrapa Tabuleiros Costeiros for the infrastructure of the experimental farm; and Dr Luiz Lehmann Coutinho for the infrastructure of the Animal Biotechnology Laboratory of ESALQ/USP.
Declaration of interest
There is no conflict of interest.
Ethics statement
This study was performed with the approval of the Ethical Committee for Animal Use (CEUA) from the Veterinary Medicine and Animal Science School of Federal University of Bahia (UFBA) (protocol number 02/2010).
Software and data repository resources
The data and models are not deposited in an official repository.