Introduction
The number of proton therapy facilities has steadily increased during recent years. Proton therapy, with the characteristic Bragg peak, allows to deliver large doses at Bragg peak region and almost no doses after Bragg peak and has the ability to reduce normal tissue doses while maintaining adequate dose coverage to tumour. Reference Wilson1 The use of protons was found to reduce the mean dose to the organs-at-risks compared to that with the conventional photon therapy for patients suffered from head and neck, paediatric and prostate cancer. Reference Boehling, Grosshans and Bluett2–Reference Yock, Schneider, Friedmann, Adams, Fullerton and Tarbell5 To ensure patient dose estimation, an accurate dose calculation plays a crucial role in proton therapy. The two main methods of proton dose calculation used in the clinic include analytical algorithms and Monte Carlo (MC) simulations. Analytical algorithms such as pencil beam algorithms were widely applied into treatment planning system (TPS) in clinic because of fast computational speed. Reference Hong, Goitein and Bucciolini6 On the other hand, MC calculations such as TOPAS have the ability to accurately calculate dose in heterogeneous mediums. Reference Perl, Shin, Schümann, Faddegon and Paganetti7,Reference Testa, Schümann and Lu8 MC was also proved to be extremely helpful for quality assurance techniques as well as for commissioning commercial TPSs. Reference Chung, Kim, Kim, Ahn and Han9,Reference Prusator, Ahmad and Chen10
The two main proton beam delivery techniques used for proton therapy are passively scattered proton therapy (PSPT) and scanning beam proton therapy (SBPT). For PSPT, such as double scattering and single scattering, the lateral and longitudinal spreading of dose deposits are achieved using scattering and range-shifting materials. While SBPT, such as uniform scanning and pencil beam scanning (PBS), involves directly moving a charged particle beam while depositing the dose throughout the target volume. The MEVION S250i with HYPERSCAN and Adaptive Aperture™ (AA) is a single room compact PBS proton therapy system, recently installed and commissioned in our institution, utilises gantry mounted superconducting synchrocyclotron which delivers a pulsed beam with a nominal energy of 230 MeV and allows for 185° rotation having the ability to deliver Intensity Modulated Proton Therapy (IMPT) treatments.
The main objective of the present study has been to provide an overview of the design and commissioning of the first MC model of MEVION S250i with HYPERSCAN and AA for future research, clinical commissioning of such a system and verification of proton treatment.
Materials and Methods
Mevion S250i overview
The MEVION S250i with HYPERSCAN and AA PBS proton therapy system (Mevion Medical Systems Inc., Littleton, MA, USA) is a single room PBS system utilising gantry mounted superconducting synchrocyclotron. The single room design of this system provides a lower cost option for implementing proton therapy and eliminating the need for a complex beam transport system. Reference Smith11 The MEVION S250i with HYPERSCAN delivers a pulsed beam with a nominal energy of 230 MeV and utilises 18 Lexan plates, an energy modulation system (EMS), for energy layer switching and proton multi-leaf collimator, the AA, for trimming the edges of the beam at every layer of delivery.
Monte Carlo simulation
The nozzle of Mevion S250i system, including EMS and AA, was modelled using TOPAS (TOolkit for PArticle Simulation) version 3.1.2. TOPAS is a Geant4 simulation extension toolkit which can model X-ray and particle therapy treatment head with user-friendly TOPAS parameter control system. It has been shown to be a useful experimentally validated model for simulating beam data from PBS system. Reference Lin, Kang, Solberg, Ainsley and McDonough12 The default physics list containing the Geant4 modules, including “g4em-standard_opt4”, “g4h-phys_QGSP_BIC_HP”, “g4decay”, “g4ion-binarycascade”, “g4h-elastic_HP” and “g4stopping”, was used in the simulations without modification. TOPAS has the build-in capability of custom geometry component extension, which allows users to write their own geometry component class with basic concept of C++ and Geant4 geometry. The nozzle of Mevion S250i HYPERSCAN system consists of scanning magnet, two sets of beam profile monitors, EMS and AA (see Figure 1). Each nozzle element was modelled with sub-millimeter accuracy following the detailed information provided by Mevion. Both scanning magnet and two sets of beam profile monitors were modelled using TOPAS build-in geometry. Scanning magnet was modelled by applying TOPAS build-in electromagnetic fields to a cuboid geometry component, and two sets of beam profile monitors were modelled using TOPAS build-in multi wire chamber geometry (TsMultiWoreChamber). On the other hand, the EMS and AA were modelled using in-house geometry component class as described in detail below.
Diagram of the nozzle of Mevion S250i HYPERSCAN system.

Modeling the EMS
The EMS, which consists of 18 Lexan plates that can move in or out of beam line, has the ability to modulate beam energy and accomplishes range adjustment using 157 unique Lexan plate combinations. The plate arrangement is designed to deliver single shot of protons with range between 0 and 32·2 g/cm2 with 0·2 g/cm2 steps. All 18 Lexan plates were modelled using in-house geometry component class extension in TOPAS. The in-house geometry for EMS is designed to accommodate various specifications of 18 Lexan plates, and the user can define the position and dimension of each Lexan plate, such as thickness and material. The component of each Lexan plate was defined using predefined material in TOPAS, and the density of each Lexan plate was then fine-tuned to match with the corresponding range from measurement during commissioning.
Modeling the AA
The AA, which consists of seven pairs of nickel collimator with dynamic positioning that mimics patient-specific aperture, was used to improve the lateral penumbra especially at lower energy beam. The AA has trimming capabilities not offered by typical patient-specific apertures. For example, it has the ability to use distinct apertures for each energy layer within a field and the ability to trim with geometries not achievable with machined static apertures. All seven pairs of nickel collimator were modelled using in-house geometry component class extension in TOPAS. The AA of Mevion HYPERSCAN system was strictly designed that no spot will go beyond the tip of each AA leaf, which will minimise the effect of tongue and groove effect for dosimetry study purpose. Therefore, the in-house geometry for adaptive aperture using simplified collimator, which is nondivergent and not considering tongue and groove of collimator, and users can define various dimensions and dynamic positions that mimic patient-specific static aperture.
Pristine Bragg peak validation
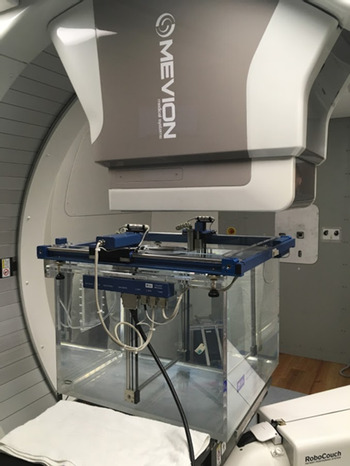
The IBA blue phantom as shown in Figure 2 was used for the integral depth dose (IDD) measurements of pristine Bragg peaks. The nominal source to isocentre distance (SID) was 185·0 cm, and water surface level was set at 15·0 cm above the isocentre. A large cylindrical chamber with 12 cm diameter active area (Stingray chamber, IBA Dosimetry) was used for measuring IDDs of the pristine Bragg peaks. Fourteen IDDs with different combinations of 18 Lexan plates for different nominal energies were measured during commissioning for validating calculated IDDs from RayStation TPS. For all 14 IDDs, corresponding combinations of Lexan plates for different nominal energies were simulated in TOPAS. For each simulation, 106 protons were run in a 40 × 40 × 40 cm3 water phantom. The nominal SID and water surface were set at 185·0 cm and 15·0 cm above the isocentre. The geometry of the cylindrical scoring volume was set to match the same diameter as the Bragg peak chamber and a thickness of 0·5 mm.
IDDs measurement with IBA Blue phantom setup.

Figure 3 shows beam characteristics of pristine Bragg peak used for benchmarking beam model. The mean energy of the pristine Bragg peak was evaluated by proton range, which is historically defined by the D90 (90% dose in the distal falloff) of a pristine Bragg peak. The average energy spread of pristine Bragg peak was evaluated by proton Bragg peak width, which was defined as the width between the proximal position of the 80% and the distal position of the 80% dose levels (W 8080). The average dose degradation of the distal falloff region and the width between the distal position of the 80% and 20% dose levels (W 8020) were used to compare the difference between simulated pristine Bragg peak and measured Bragg peak.
Beam characteristics of pristine Bragg peak including the distal range of 90% dose (D90), width of 80% dose (W8080) and 80% to 20% dose distal fall off (W8020) for benchmarking beam model.

In order to validate the accuracy of TOPAS simulation, beam characteristics of pristine Bragg peak including the distal range of 90% dose (D90), width of 80% dose (W8080) and 80% to 20% dose distal fall off (W8020) for all IDD curves were calculated and the differences were compared between measurement and simulation.
In-air spot size validation
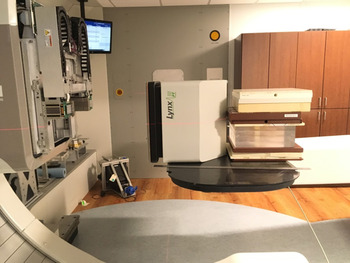
To ensure that the beam propagation process was simulated correctly, in-air spot size of different energies at different positions was measured and compared with simulation. A 2D dosimetry system (Lynx, IBA Dosimetry), as shown in Figure 4, consisting of a scintillator screen coupled with a CCD camera, with 0·5 mm resolution and 30x30 cm2 active area, was used for in-air spot size measurements. The in-air spot sizes of 33·04 MeV, 100·25 MeV, 147·36 MeV, 190·82 MeV and 227·15 MeV were measured at ±10 cm, ±20 cm and isocentre. For TOPAS, the in-air spot sizes of corresponding energies and positions were simulated. For each simulation, 108 protons were run.
In-air spot size setup showing a 2D scintillator detector, Lynx (IBA Dosimetry).

For beam spot size validation, in-air spot sizes in both x and y directions were calculated and the differences between measurements and simulations were compared. For beam spot size validation, the spot sizes in both x and y directions for all different positions between measured and simulated were also compared.
Lateral dose profile validation
To validate the lateral dose profile, a plan with a 5 × 5 cm2 uniform dose distribution centred at 10 cm depth in a 30 × 30 × 30 cm3 water phantom was made with RayStation TPS. An in-house Matlab-based tool was used to convert pulse by pulse physics and geometry information (beam energy, charge per pulse, spot positions, energy selectors combination and AA positions) from the delivered machine log file to TOPAS time feature file for creating simulation of validation plan, which was consisted of 100 million protons for achieving both accuracy and efficiency of the simulation. To validate the AA modelling, the 2D profiles, with and without AA, in both in-plane and cross-plane directions were compared between calculations and simulations. The relative dose comparison was normalised to the iso-centre. For each 2D profile, the full width at half maximum (FWHM) and penumbra were compared. The penumbrae were calculated as the distance between the 80% and 20% dose levels.
Results and Discussion
Pristine Bragg peak comparison
To compare with corresponding measured IDDs of pristine Bragg peak, the simulated data for each energy were normalised to 100% at maximum dose. Figure 5 compares IDDs between TOPAS MC-simulated data, measured data during commissioning and RayStation TPS data for all 14 energies. As shown in Figure 6, all beam characteristics including peak width, distal fall-off and range of pristine Bragg peak of 14 energies exhibited good agreement within 1 mm between simulated data and measured data. The beam characteristics of peak width, distal fall-off and range of pristine Bragg peak were also compared between simulation data from TOPAS and calculation data from RayStation for 14 energies. As shown in Figure 7, the differences of beam characteristics are also agreed well within 1 mm tolerance.
IDDs curve comparison between TOPAS MC data (solid line), measured data (circle) and RayStation TPS data (dash-dot line) for different energies.

The differences of W8080 peak width (blue circle) and W8020 distal fall off (red triangle) and D90 range (green square) between TOPAS data and measured data at different energies.

The differences of W8080 peak width (blue circle) and W8020 distal fall off (red triangle) and D90 range (green square) between TOPAS data and RayStation data at different energies.

In-air lateral profile comparison
The spot profiles show Gaussian beam distributions measured in-air for five energies: 33·04, 100·25, 147·36, 190·82 and 227·15 MeV. The comparison between measured and simulated spot sizes in σ x and σ y for five different energies at five different positions is shown in Figure 8. The differences of beam spot sizes between measured and simulated data agreed well within 10% tolerance.
Spot sizes comparison for different energies at different positions. (a) Comparison of spot size at x direction (σ x ) from both simulation and measurement. (b) Comparison of spot size at y direction (σ y ) from both simulation and measurement.

Lateral dose profile comparison
The 5 × 5 cm2 calculated and simulated lateral dose profiles for 230 MeV and 160 MeV beam in the water, both with and without AA, are shown in Figures 9 and 10. The lateral profile agrees well between calculation and simulation, and the AA shows the ability of sharpening field size and penumbra for both energy and both directions. Table 1 and 2 list the comparison of FWHM and 20–80% penumbra for the lateral dose profile with and without AA at 10 cm depth between calculated and simulated lateral profile for 230 MeV and 160 MeV, respectively. The FWHM and 20–80% penumbra agree well within 2 mm for both energy and direction.
Normalised lateral profiles of 230 MeV at 10 cm depth in the water from the RayStation treatment planning system (red) and simulation (blue) without AA in (a) in-plane direction and (b) cross-plane direction and with AA in (c) in-plane direction and (d) cross-plane direction.

Normalised lateral profiles of 160 MeV at 10 cm depth in the water from the RayStation treatment planning system (red) and simulation (blue) without AA in (a) in-plane direction (b) cross-plane direction and with AA in (c) in-plane direction (d) cross-plane direction.

Comparison of field size (FWHM) and 20–80% penumbra of lateral dose profile at 10 cm depth with and without AA between calculation (RayStation) and MC simulation (TOPAS) data for 5 × 5 cm2 230 MeV proton plane beam

Comparison of field size (FWHM) and 20–80% penumbra of lateral dose profile at 10 cm depth with and without AA between calculation (RayStation) and MC simulation (TOPAS) data for 5 × 5 cm2 160 MeV proton plane beam

Conclusions
In this study, the beam model of MEVION S250i with HYPERSCAN and AA PBS proton therapy system was modelled and validated. The beam line components including EMS and AA were modelled in detail and showed promising results of agreements with both pristine Bragg peak and in-air profile measurement taken during commissioning. The validation of the lateral dose profile in water between simulation and treatment plan also showed well in agreement. The future studies including patient-specific dose calculation/validation with the delivered machine log information will be conducted. The TOPAS MC simulation of the MEVION S250i with HYPERSCAN and AA PBS proton therapy system could thus serve in future a viable tool for research and verification of the proton treatment.
Acknowledgements
The authors would like to thank Mr. Daniel Green and Nathan Gilley from MEVION service engineering team for their assistance during beam data collection.