1. Introduction
Water allocation models are critical tools for efficiently managing the world's many water systems (Chakravorty and Roumasset, Reference Chakravorty and Roumasset1991; Tsur Reference Tsur, Parker and Tsur1997). Applied models have primarily focused on water management at the basin level or administrative unit level (Booker and Young, Reference Booker and Young1994; Hurd et al., Reference Hurd, Calloway, Smith, Kirshen, Mendelsohn and Neumann1999; Hurd and Harrod, Reference Hurd, Harrod and Mendelsohn2001; Lund et al., Reference Lund, Zhu, Tanaka, Jenkins, Smith and Mendelsohn2006). The basic insight of these models is that, if one equilibrates the marginal value of consumed water across all users within each basin, society can maximize the value of the available water supply. This basic insight applies to water allocations across farmers within a canal system as well. Although there are several models that address basin-wide water efficiency, the only previous study of water allocation efficiency within a canal system was done in India (Qaddumi, Reference Qaddumi2005). This study in India found that farmers near the canal head were taking much more water than farmers near the tail. This is inefficient, as the marginal value of the water to the head farmers was much lower than the marginal value to the tail farmers. A more equal allocation would have increased the total amount of land that could have been irrigated. One study estimates that inefficient water allocation has led to the loss of 2.5 million ha of irrigated land in India and Pakistan between 1994 and 2003 (Mukherji et al., Reference Mukherji, Facon, De Fraiture, Molden and Chartres2012). More efficient water allocation also increases the aggregate value of each canal given the available water supply (Qaddumi, Reference Qaddumi2005).
This paper provides a more precise calculation of water use within canals. Most agricultural production surveys in the developing world do record the number of irrigations that a farmer makes. However, measures of the amount of water per irrigation are often either assumed to be the same across farmers or are measured crudely. For example, farmers are asked the depth of each irrigation. Depth is rarely actually measured, partly because fields are not perfectly level so that depth would depend on where the measurement was taken. This study tackles the problem of measuring water per turn by collecting actual physical measurements of surface water from a sample of farms spread across the Hakra Branch Canal, in Pakistan. The canal water discharge was measured using a flow meter and standard stream measurement protocols during the 2012 summer growing season. GPS measurements captured the precise location of the measurements made along the canal system. It was therefore possible to locate the measurement along the canal system so that the distance from the head to the measurement could be calculated along with expected conveyance losses. The water measurements were followed by a production survey of the farmers at each canal location once the summer growing season was over. Water use was measured in season and production was measured at the end of the season.
We start the analysis by testing for water allocation efficiency using traditional measures of water use including turns received, turn time and perceived depth. The canal system has strict protocols that attempt to equate water use per acre, so turn time does not vary across farmers. The traditional measures suggest that all farmers receive the same amount of canal water per acre. However, when more precise volumetric measures of farmer water are used, the analysis suggests head and middle farmers get significantly more water than tail farmers. Even adjusting for conveyance loss, the farmers at the tail get less water. Corroborating the measurement of water, we also find that farm net revenues per acre decline with distance along the canal. The water problem is evident along every reach of the canal. The results imply that water allocation within a canal system remains an important efficiency issue.
2. Theory
Net revenue, B, is simply gross revenue, PQ, minus the cost of purchased inputs, RX:
 $$B=\lpar P_{j}Q_{j}\lpar {\bf{X}}\comma \; W\comma \; Z\rpar -R_{j}{\bf{X}}\rpar \comma \; $$
where for each crop, j, P j is the price of a given crop, Q j is output which is a function of a vector of inputs, X, surface water, W, and a set of other exogenous variables, Z, that a farmer cannot choose, and R j is the price of inputs. We assume that farmers maximize their net revenue. They choose the set of inputs, X, that maximize (1). This leads to the following first-order condition, marginal revenue equals marginal cost for each input j:
 $$\displaystyle{{P_{j}dQ_{j}\lpar {\bf{X}}\comma \; W\comma \; Z\rpar }\over {dx}}=R_{j}.$$
Given the exogenous variables that each farmer faces, the farmer selects the levels of each input that lead to the highest possible net revenue. The variable inputs include fertilizer, pesticide and seed. Crop choice is also decided by the farmer to maximize net revenue. We argue that groundwater is an endogenous input that a farmer purchases by spending more on pumping. In contrast, surface water, W, is exogenous because it is determined by natural conditions and the canal system and is not a farmer choice. If farmers maximize their net revenue, observed net revenue, given the input choices by each farmer, can be described just in terms of the exogenous variables.
 $$B=f\lpar W\comma \; Z\rpar . $$
This net revenue function is a Ricardian function and is quite distinct from a production function. The net revenue function describes the highest net revenue possible given exogenous factors to the farmer. The inputs that a farmer controls are not included. A production function, in contrast, tries to measure the role of each input and must be included in the regression.
In order to measure the marginal value of water, we estimate (3) with the data. We regress net revenue on measured water, w i , water squared, and a vector of control variables, Z i , for each farmer i:
 $$B_{i}=\alpha +\beta_{1}w_{i}+\beta_{2}w_{i}^{2}+Z_{i}\gamma +\varepsilon_{i}\comma \; $$
where α, β1, β2 and γ are estimated parameters and ε i is an error term.
We argue that canal systems should be designed to maximize the value of the water that they receive. Formally, this implies that the canal water should be allocated to maximize the sum of the net benefits, B, across all the farmers within the canal, given a fixed amount of total water,
 $\bar{W}$
:
 $$\max_{w_i}\left\{\sum_i^N {B_{i}\lpar w_{i}\rpar } \right\}\ s.t.\ \sum\limits_i^N {w_{i}\le \bar{W}}\, where\ 0\le w_{i}\le \ \bar{W}\ for\ i=1\comma \; \ 2\comma \; \ldots \comma \; \ N. $$
Differentiating (4) leads to the first-order conditions for an efficient allocation of surface water:
 $$\displaystyle{{\partial B_{i}\lpar w_{i}\rpar }\over{\partial w_{i}}}=\displaystyle{{\partial B_{j}\lpar w_{j}\rpar } \over {\partial w_{j}}}={\bf{\lambda}}\forall \ i\comma \; j\comma \; \ where\ i\ne j\comma \; $$
where λ reflects the value of one more unit of water to the entire system and i ≠ j. The marginal benefit of water consumption should be the same for all users. If the farms within a canal are effectively homogeneous, every acre of land should receive the same water allocation.
The Hakra Branch Canal ‘design was for a run-of-river system with an objective to command a maximum area with the available supplies in the river, ensuring equitable distribution’ (Bandaragoda, Reference Bandaragoda1998: 3). In principle, the canal is designed and operated to be efficient. We test whether this in fact is the case.
One important question is whether conditions are homogenous within the canal. For example, the farmers might be very different in the head versus tail of the canal. Other exogenous factors may also be different, such as groundwater availability and soils. We test all of these conditions in the empirical section.
One complication to add to this model is conveyance loss. The further down a farm is along the canal, the more water is lost in the canal, especially if the canal is not lined. Some of the surface water leaks from the canal system as water flows within it. The new objective becomes to maximize the sum of net benefits across all farmers taking into account the fixed quantity of water and the conveyance loss:
 $$\max_{w_i}\left\{\sum\limits_i^N {B_{i}\lpar w_{i}\rpar } \right\}\ s.t.\ w_{i}={z_{i}\lpar d_{i}\rpar \ast v}_{i}\ and\ \sum\limits_i^N {v_{i}\le \bar{W}} $$
where 0 ≤ z
i
≤ 1 and
 $0\le v_{i}\le \bar{W}$
for i = 1, 2,…, N.
The marginal value of the water sent to each farmer should be the same, but the marginal value of the water received by each farmer would not be equal (Chakravorty and Roumasset, Reference Chakravorty and Roumasset1991). It would be adjusted by the conveyance loss:
 $$\displaystyle{{\partial B_{i}\lpar w_{i}\rpar }\over{\partial w_{i}}}z_{i}\lpar d_{i}\rpar =\displaystyle{{\partial B_{j}\lpar w_{j}\rpar }\over{\partial w_{j}}}z_{j}\lpar d_{j}\rpar \ \forall \ i\comma \; j\comma \; \ where\ i\ne j. $$
Depending on the conveyance loss of the canal, farmers near the head should get slightly more water than farmers near the tail because some water is lost on the way to the tail farmer's gate.
Although surface water is allocated by the canal and is not chosen by each farmer, groundwater is chosen by each farmer. In a typical year, surface water is scarce in the canal and so farmers supplement their surface water supply with groundwater. Our survey revealed that 93 per cent of farmers used groundwater. Adding groundwater withdrawal complicates the model.
Each farmer can supplement canal water by pumping groundwater. Although there is no charge for taking groundwater, the farmer must pay the pumping cost. This tends to make groundwater much more expensive than surface water to the farmer. The existing fee for surface water in the canal is a nominal administrative price, locally called abiana, which is set at US$0.85 per acre of land for the entire summer season and US$0.50 per acre for the entire winter season (IWMI, 2014). In contrast, the total seasonal mean expenditure on groundwater per acre in our sample was US$44. Surface water in the canal costs a farmer an average of US$0.52/acre-foot during the 2014 summer growing season (locally called Kharif). That same amount of water from a groundwater tube well would cost the farmer US$70 (IWMI, 2014). Groundwater is more than two orders of magnitude more expensive than surface water.
If farmers in the tail get less surface water, they can make it up by pumping more. However, the high cost of pumping implies tail farmers will use less total water than head farmers, who have more surface water. If tail farmers get less surface water, tail farmers will also earn less net revenue. These are hypotheses that are tested in the empirical section.
One important question is whether all farmers have the same access to groundwater. We test this by examining bore hole depth, groundwater quality, own well and pump power. In a robustness check, we include these variables in the regression analysis to control for possible differences among farmers.
3. Data
The canal in this study is part of the Indus Basin Irrigation System (IBIS) in Pakistan. IBIS is a continuous-flow, fixed-rotation system with two major multi-purpose storage reservoirs, 45 major irrigation canal commands, and over 120,000 watercourses delivering water to farms (Yu et al., Reference Yu, Yang, Savitsky, Alford, Brown, Wescoat, Debowicz and Robinson2013). The bulk of the canal system in present-day Pakistan was originally built by the British colonial administration during the period of the British Raj in India, and land irrigated by these irrigation canals was originally allocated at that point in time, i.e., the late 19th century (Ali, Reference Ali1988). Almost all farmers in the canal system inherited their farms. Farmers have not selected which farm they want, so there is no reason to expect a selection bias problem.
All of the 45 main canal commands (or canal systems) are controlled by the Provincial Irrigation and Drainage Authority (PIDA) of the province they are located in. The canal command controls water flows to the primary and secondary canals. As a result of recent reforms, farmer organizations (FOs) sometimes play a role managing the tertiary canals.
The system of water allocation at the farm level is called warabandi, which literally translates as ‘turns’ (wahr) which are fixed (bandi). All farmers gets a fixed time each cycle when they can open the gate to their farm and tap the water flowing in the tertiary canal (Bandaragoda, Reference Bandaragoda1998). There is every reason to believe that both the number of turns and the length of each turn may be the same along the canal. However, it is not clear whether the flow is the same at each farm gate. The flow is traditionally measured by the farmer's perception of the depth of the irrigation. However, fields are rarely perfectly level and depth is rarely actually measured. It is very likely that depth and therefore flow is poorly recorded.
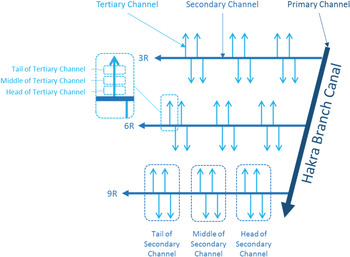
We address this issue by carefully measuring flow at each gate. We select three secondary canals along the Hakra Branch Canal (3R, 6R and 9R), from which we select 200 tertiary canals and measure farm water discharge at the gate. We use a flow meter to obtain accurate readings of instantaneous flow. Figure 1 illustrates the sampled canal system. Along the length of each secondary canal, we sampled about two-thirds of all the tertiary canals and then the farms within those tertiary canals. We differentiate the farms in two ways. First, we break farms into three distinct groups: head, middle and tail (i.e., the first, second and final third, by distance from the head of the system). Secondly, we classify farms by the distance of their farm from the beginning of the secondary and tertiary canal.
A schematic of the Hakra Branch Canal

The second unique feature of this data set is a relatively precise measure of distance along the canal system. Typically, it is crudely measured: farmers are lumped into the head, middle or tail of a canal segment. If a survey is able to collect distance, it typically relies on a farmers' self-reported distance, which may not be entirely reliable as farmers are not keenly aware of the distance from the head of the system to their plot. In our study, there are two distinct distance components (as shown in figure 1) – secondary distance (along a secondary canal) and a tertiary distance (along a tertiary canal, which is typically unlined). These allow us to calculate conveyance losses as water travels through the canal system.
Conveyance efficiency was estimated using four different estimates of water loss along the secondary canal. Given that we know the distance the water must travel to reach each farm, the conveyance efficiency allows us to estimate the amount of water that was sent to the farm in order for it to receive the amount of water we measured. The procedure used to adjust water volumes consumed by farmers for conveyance loss is described in the online appendix available at https://doi.org/10.1017/S1355770X17000171.
A full production survey was conducted after the 2012 summer growing season (Kharif) of each farm. The data include input and output data at the plot crop level. Groundwater measures were also collected (pump age, power and depth of the bore) as well as socio-economic variables. Table A.1 in the online appendix provides summary statistics. Our complete sample contains 339 farmers. The average farmer in our sample has 28 years of experience in agriculture, owns the primary plot of land he cultivates, with an average land value of US$64,000. About 93 per cent of the sample is involved in some kind of livestock production and almost everyone in the sample has inherited their land (98 per cent).
4. Results
We conduct three related tests with the data. First, we test whether there is any evidence that water supplies systematically vary within the canal system. We are specifically interested in whether there is any value in collecting the flow measurements instead of perceived depth. Secondly, we test whether net revenues systematically vary within the canal system. Our goal is to see whether the two patterns match. Thirdly, we estimate the marginal value of water by regressing observed net revenue on canal water supply.
4.1. Inefficiency in allocation
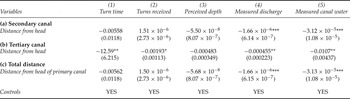
We start our analysis in table 1 by testing whether farmers at different distances along the secondary canal obtain the same amount of surface water (all specifications include a vector of controls). We examine both distance along the secondary canal and distance along the tertiary canal (panels a and b). We find that there is no statistically significant relationship between any of the traditional measures of water and distance along the secondary and tertiary canal segments. Both turn time and turns received fall with distance along the tertiary canal, although precision on the estimates is low. It is interesting that these variables fall with distance along the tertiary canal since these canals tend to be relatively short and they are managed by the farmers themselves. Our measured flow of water confirms that water falls with distance along the tertiary canal. It also reveals that water falls with distance along the secondary canal. The mean surface water delivered to each farmer is 6.33 acre-feet per season. The mean secondary canal distance is 76,688 feet and a typical distance for a tail farmer is 130,228 feet. Given the coefficient on distance, this implies that a typical tail farmer would get 4.1 acre-inches less surface water and the mean farmer in the canal gets 2.4 acre-inches less per season than a head farmer.
Traditional and improved water measure regression on distance

Notes: The dependent variable in (1) is irrigation time per turn, in (2) it is the number of turns per season, in (3) it is the depth per inundation, in (4) it is the measured discharge (flow), and in (5) it is seasonal total water (the product of turns, length of turns and measured flow). The independent variables include distance (feet) along the secondary canal, tertiary canal and the total. Robust standard errors in parentheses. ***p< 0.01, **p< 0.05, *p<0.1.
Of course, if farmers further from the head get much less canal water, there should be other indications that they are not doing as well. We next compare these results with the pattern of net revenue. Net revenue also falls with distance along both the tertiary and secondary canal. The results confirm our hypothesis that water delivery falls with distance along the canal. The results also suggest that traditional measures of water use are inadequate and unable to capture these systematic differences. Only the direct measure of water flow to each farmer was able to capture the relationship between water, location and farm net revenues.
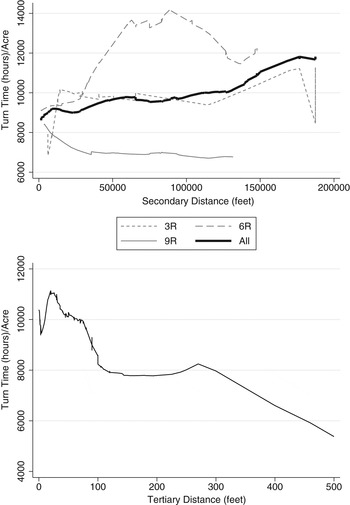
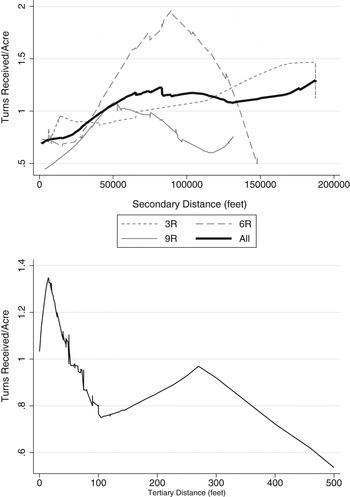
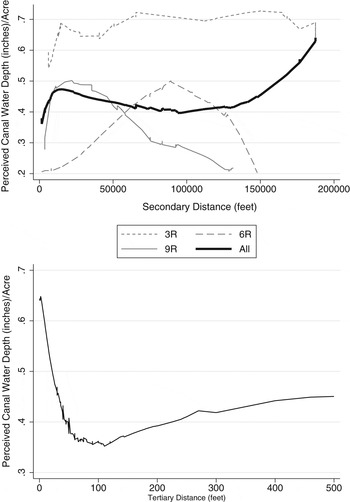
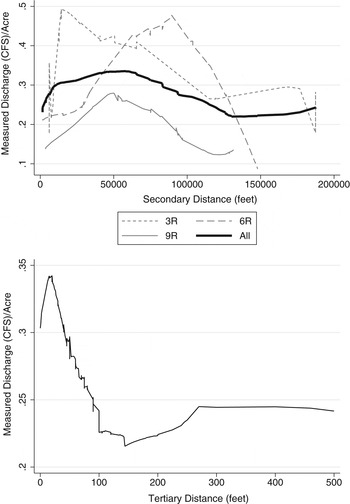
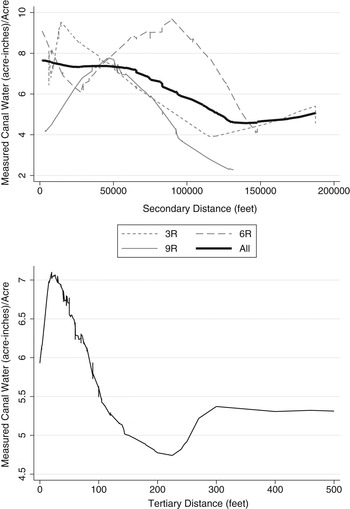
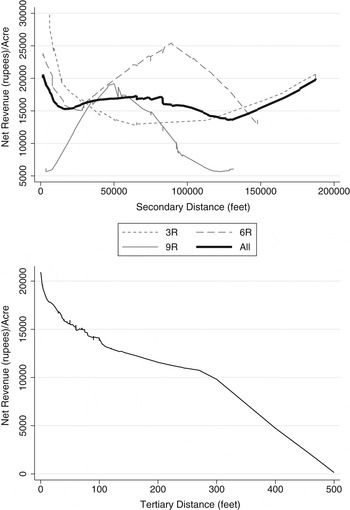
We capture the results concerning water measures and net revenues by distance in figures 2, 3, 4, 5, 6 and 7. The upper panel of each of these figures graphs a locally weighted scatterplot smoothing of the relation between a given water measure or net revenues with secondary distance (i.e., distance along the secondary canal), while the lower panel does the same for tertiary distance (i.e., distance along the tertiary canal). We graph each of the secondary canals independently but present a combined mean as the bold black line. Figures 2, 3 and 4 show the relation between secondary distance and farmer-reported measures of water deliveries from the canal system. The graphs suggest that turn time and turns received seemingly increase along the secondary canal, while perceived depth seems to be fairly constant (at the aggregate level; individually there is greater variation). The relation along the tertiary canal seems consistently to decline, however. Figures 6 and 7 show the relation between measured water: discharge at head of tertiary canal, i.e., the discharge measurement made by this study (5), and a calculated measure of water delivered to farmer based on this discharge measure (6). The measured discharge at head of tertiary canal exhibits an inverse U-shaped relation to distance, peaking near the middle distances of the canals. The combined calculated result on water delivered (which incorporates the discharge measure, turns received and turn length) has a distinctly decreasing relation with distance. Maximum deliveries of water do not necessarily coincide with being at the very head of the secondary channel. However, head and middle farmers get more water than tail farmers. The effect of tertiary distance is much more distinct, with water delivery declining sharply with distance, although tertiary canals are much shorter. Figure 7 is a similar graph of net revenues and distance. The pattern with net revenues mirrors the canal water data. Net revenues fall with tertiary distance. The net revenues and secondary distance are quite similar to the measured water data and secondary distance by secondary canal. Net revenues are clearly directly affected by canal water as measured by the flow meter.
Turn time on the y-axis. Upper panel has secondary distances on x-axis, while lower panel has tertiary distance

Turns received on the y-axis. Upper panel has secondary distances on x-axis, while lower panel has tertiary distance

Perceived depth of water on the y-axis. Upper panel has secondary distances on x-axis, while lower panel has tertiary distance

Measured discharge (cfs) at head of tertiary canal on the y-axis. Upper panel has secondary distances on x-axis, while lower panel has tertiary distance

Canal water delivered (using discharge measurement for calculation) on the y-axis. Upper panel has secondary distances on x-axis, while lower panel has tertiary distance

Net revenue at head of tertiary canal on the y-axis. Upper panel has secondary distances on x-axis, while lower panel has tertiary distance

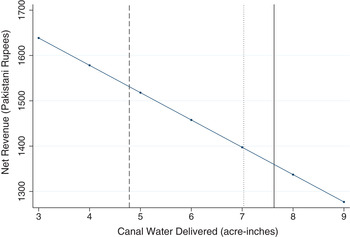
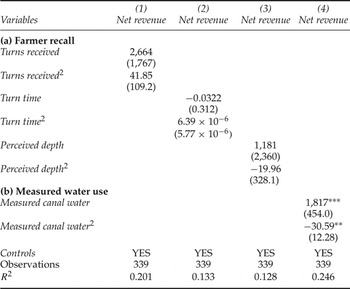
We next calculate the marginal value of water by regressing net revenue on canal water. We test the hypothesis that the marginal value of water is positive (beneficial) but declining. We try both traditional measures of water and our measurement of actual flow in table 2 (online appendix table A.2 has versions of specifications shown in table 2 with and without controls). The results suggest that the traditional measures of water have no effect on net revenue. That is, the traditional measure of water is so poor that it is not obvious that canal water is a useful input to farming. In contrast, it is evident that canal water is valuable when using measured flow. Measured flow has the expected positive coefficient on the linear term and negative coefficient on the squared term.Footnote 1 The marginal value of water is positive and declining as expected (figure 8). The figure also shows the average level of water for farmers near the head (dotted line), middle (solid line) and tail (dashed line) of the secondary canals. It is evident that the marginal value of water is not the same for head, middle and tail farmers because the tail has much less surface water.
Estimated farmer marginal net revenues as a function of water delivered (unadjusted for loss)

Net revenue regression on traditional and improved water measures

Notes: The dependent variable is farmer net revenue. The independent variables are farmer-reported measures of canal water and their squared term. Specification (1) uses farmer-reported turns received, (2) uses reported turn time, (3) uses farmer-reported depth, and (4) uses the canal water delivered. All specifications include a vector of controls, as specified in online appendix table A.3. Mean net revenue is PKR15,599/acre. Robust standard errors in parentheses. ***p< 0.01, **p< 0.05.
Tables 1 and 2 reveal that water is not efficiently allocated within the canal. Table 1 reveals that farmers closer to the head of the canal are taking more water than farmers near the tail. Table 2 reveals that farmers who take more water have a lower marginal value for that extra water. That is, the marginal value of water is much higher for tail farmers than for head and middle farmers. If some water could be reallocated from head to tail farmers, water would move from lower to higher marginal valued use and the canal would generate more net revenue.
The control variables in table 2 are generally insignificant (specification (4) from table 2 with the full list of controls is presented in online appendix tables A.3 and A.4). The coefficient on the number of household members that work is positive, presumably because more people are working for free on the farm. Households involved in livestock production are also more profitable. Mixed farms that do a combination of crops and livestock are often more profitable than farms that specialize (Seo and Mendelsohn, Reference Seo and Mendelsohn2008). We include a second-order polynomial in groundwater quality (measured as electrical conductivity in Siemens per meter). Higher conductivity indicates the presence of more minerals and salts. The relation implied is concave. More electrical conductivity (Siemens per meter) has a positive linear and negative squared coefficient, implying that more minerals and salts in groundwater are beneficial up to a point.
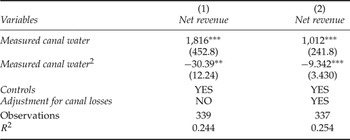
In table 3, we conduct a similar analysis to the above but take into account conveyance loss. Instead of using the amount of water actually delivered to each farmer, we use the amount of water sent to each farmer. The sent water takes into account the conveyance loss along the canal. More distant farmers have larger losses. Taking into account conveyance loss, the marginal value of water is lower. The net revenue–water relationship is still hill-shaped but the hill is flatter and lower and the peak shifts from 30 to about 50 inch-acres.
Net revenue regression with improved water measures with and without conveyance loss

Notes: In each specification, the dependent variable is farmer net revenue and the independent variables are canal water per acre delivered and controls. Specification (1) is identical to specification (4) in table 2, while specification (2) adjusts the volume of water delivered upward to account for channel losses using one of the formulas discussed in online appendix 3. Online appendix 3 describes four different ways to adjust conveyance efficiency. We show all four different methods of adjustment in online appendix table A.8. Robust standard errors in parentheses. ***p<0.01, **p < 0.05.
4.2. Gains from reallocation
Using the conducted analysis, we calculate the potential gain from improving the allocation across farmers. We compare the total net revenue for the entire system given the existing allocation with the total net revenue for the entire system with an optimal allocation. Assuming no conveyance losses, the optimal allocation would equate the surface water supply across all farmers. We calculate each farmer's net revenue per acre from estimates in specification (4) in table 2:
 $$\pi_{i}=6\comma \; 562.85+ 1\comma \; 816.00\ast w_{i}-30.39 \ast w_{i}^{2}. $$
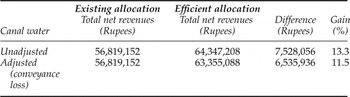
As shown in table 4, we find a potential 13 per cent gain from reallocation.
Welfare gain from water reallocation

We make a similar welfare analysis taking into account conveyance efficiencies. We compare many measures of conveyance loss. In each case, the efficient solution is to equilibrate the marginal value of water sent to each farmer. We find that the potential efficiency gain is about 12 per cent in all cases.
4.3. Robustness checks
Underlying our analysis is the key assumption that canal water delivery to farmers is exogenous. This is a safe assumption for two reasons, one institutional and the other physical. First, water delivery is set externally to farmer characteristics (except farm size, which we control for) and externally to their input choice. A farmer accepts what is ‘offered’ by the system. This is an institutional feature of the system that farmers have no control over. In terms of the system's structure, if there is discharge in primary canals then there is discharge in secondary and tertiary canals. The control structures (i.e., structures that determine the amount of water that flows from a higher order canal to a lower order canal or from the tertiary canal to a farmer's land) at the lower levels of the system are static and not amenable to alteration. Within a tertiary canal, farmers open their gates for predetermined (based on a non-market non-negotiable timetable created decades ago) periods of time to access discharge in the canal. Thus, within a tertiary canal, farmers have a distinct incentive to ensure that everyone adheres to the schedule lest someone take more than their allotted share.
Secondly, the total volume delivered in a season varies, depending on factors such as snow-melt in the Himalayas and any other runoff contributions to reservoirs and canals upstream. In this sense, canal water deliveries can be analogized to precipitation, i.e., physically out of the control of farmers. It should be noted that 93 per cent of the sample is utilizing groundwater, which implies that the surface water constraint is binding (hence the need to supplement with groundwater).
We present some evidence to explore the above arguments about canal water exogeneity. The results suggest that water delivered to farmers is exogenous, i.e., orthogonal to the set of observable characteristics. First, online appendix table A.5 shows the results of regressing farmer characteristics on our improved volumetric measure of water use, one by one. None of the specifications shows a significant correlation. We use an alternate method (McKenzie, Reference McKenzie2015) and regress farmer water use on the full set of farmer characteristics captured along with the results of the joint test of significance (online appendix table A.6). One characteristic, overall experience, is negatively associated with water. However, it is not at all clear that having more experience causes a farmer to want to have less canal water.
An additional set of specifications we run also includes borehole depth and pump power for the subset of farmers who use groundwater. These have not been included in the main analysis because, by definition, this analysis selects into a subsample (i.e., those who use groundwater – not all our farmers used groundwater in the season we studied). The analysis using these pump qualities can only be conducted on the subset of farmers who have groundwater pumps (not all have pumps), because items like pump power and depth are qualities that are not available for those who do not have groundwater pumps. So, the regression results should be seen as a kind of qualitative analysis (of a subsample). The analysis conducted in table 2 has been repeated with these additional variables in online appendix table A.7 and exhibits remarkably similar results to before, i.e., traditional farmer reports of surface water delivered are not precise enough to pick up the inefficiency of canal water allocation (although the coefficients on the more precisely measured water delivery variables do decrease as compared to specification (4) in table 2).
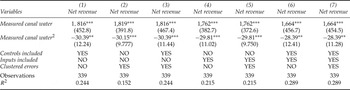
Next, by way of robustness checks, we augment our analysis in two ways. First, we re-run specification (4) from table 2 with cluster robust standard errors, clustering at the tertiary canal level (since that is an analogue to an experimental treatment cluster). The results are shown in table 5, specifications (2) and (3) (specification (1) is just a repetition of specification (4) from table 2). As will be noted, the estimates are essentially unchanged. Next, we include a vector of inputs used by farmers (including hired labour, own labour, fertilizer, hired tractor and own tractor usage). Specifications (4) and (5) include only inputs but not the set of controls, where specification (5) has clustered standard errors. Next, in specifications (6) and (7), we include the full set of controls and the full set of inputs, where specification (7) has cluster robust standard errors. As will be noted, the full set of specifications tends to follow closely the estimates seen in specification (4) of table 2. The fact that the estimates are largely unchanged with the inclusion of a complement of inputs and the clustering of errors provides evidence of the robustness of these results.
Robustness checks of net revenue regressions with improved water measure

Notes: The dependent variable is farmer net revenue and the independent variables are canal water per acre delivered. Specification (1) is a replica of specification (4) from table 2. Other specifications vary the inclusion of controls, inputs, and whether errors are clustered. Inputs are endogenous and should not normally be included, but we include them to demonstrate the stability of the results. The set of inputs include hired labour, own labour, fertilizer, own tractor, and hired tractor hours. Controls measure household characteristics and are insignificant. Finally, errors are clustered at the tertiary canal. Robust standard errors or cluster robust standard errors (as applicable) are in parentheses. ***p<0.01, **p < 0.05.
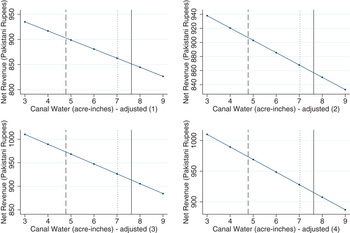
We also explore how sensitive the results are to using sent water (v), i.e., water at the head of the system, instead of delivered water (w). Using our conveyance loss efficiency calculations (see online appendix), table A.8 estimates the same regressions as in table 2 except that the independent variable is sent water and sent water squared (rather than delivered water and its square). We find that even with this adjustment, allocation of canal water is inefficient. The coefficients on the linear and squared terms are significant, although the magnitudes are lower. The adjustment accounts for loss along the channels as water makes its way from the head of the system to a given farmer. Thus, tail farmers are penalized for being further down the system. This reduces but does not eliminate the observed inefficiency associated with falling water with distance from the head. Figure 9 examines sent water by distance, taking into account conveyance losses. Again, we show declining marginal net revenues from water with all four versions of canal conveyance efficiency adjustments.
Marginal net revenue of sent water given alternative conveyance loss calculations

5. Conclusions
This paper demonstrates that traditional survey methods of measuring irrigation water in developing countries are not accurate. The amount of water that farmers receive is hard for them to quantify and therefore report. The traditional measures of water are not capable of explaining systematic variations in net revenue observed across farmers within a canal system. We demonstrate that using a flow meter leads to far more accurate results. The measures of flow explain observed variations in net revenue across farmers within the canal system.
This paper tries to explain why so many canals appear to irrigate only a fraction of the land they are designed to serve. The paper argues that farmers nearer the head take too much water, leaving farmers near the tails with an inadequate supply.
We find that the traditional measures of irrigation do not reveal that there is a water allocation problem within our canal sample of farmers. Of course, the traditional measures of water also cannot predict the observed net revenues across our sample. If one relied on them too closely, one would come to two inappropriate conclusions. First, that there is no difference in water allocations within canals. Secondly, that canal water has no effect on farm net revenue even in a semi-arid location.
We address this shortcoming in the literature by carefully measuring water withdrawals across a sample of farmers within the same canal system using a flow meter. We find that actual canal water at first increases and then falls with distance along the secondary canal and simply falls with distance along the tertiary canals. Interestingly, net revenue per acre also increases and falls with distance along secondary canals and simply falls with distance along the tertiary canal. The result is mirrored in all three secondary channels observed.
Regressing net revenues on water withdrawals reveals that the marginal value of water is positive but declining as canal water increases. The results reflect what one would expect from theory and controlled experiments. We then show that a more efficient reallocation of water across farmers within the canal would increase net revenues by 13 per cent. Even when likely conveyance losses are taken into account, a more efficient water allocation increases net revenues by 12 per cent.
There are some important words of caution. The results may only apply to this particular sample of farmers from this particular canal. Certainly, the absolute magnitude of the effects is peculiar to this canal. However, the general result that water may be inefficiently allocated within canals is likely to apply not only to this canal, and to Pakistan, but in fact to most canals in developing countries. The results may even apply to canals everywhere since water is rarely traded in markets. It is also important to mention that groundwater may not have been adequately controlled for in this study. Groundwater is complicated, partly because farmers choose how much groundwater they want. Seepage from farms and from the canals themselves contributes to groundwater. The responsiveness of an irrigation system to when farmers need additional water also affects groundwater use. Finally, groundwater is not a perfect substitute for canal water, depending on its quality and depth.
Supplementary material and methods
To view supplementary material for this article, please visit https://doi.org/10.1017/S1355770X17000171.