

Introduction
Rising global temperature, inequality and poverty are the world’s most pressing issues today (García-García, Buendía, & Carpintero, Reference García-García, Buendía and Carpintero2022; Poschen, Reference Poschen2017; Stern, Reference Stern2009; Voituriez, Reference Voituriez2020). The emergence and acceleration of these “multidimensional concerns,” as well as the public’s growing awareness of their implications, have increased the demand and need for novel ways of living, producing and consuming (Elias, Reference Elias2019; Utting, van Dijk, & Mathei, Reference Utting, van Dijk and Mathei2014). These sustainability concerns cannot be addressed by specific policy instruments, but rather require highly compatible social and ecological systems (Breg & Saikkonen, Reference Breg, Saikkonen, Hänninen, Lehtelä and Eglaronline2019). In response, this study aims to provide foundational theoretical and empirical insights into the significance and nature of the interaction between welfare and environmental states.
In recent years, welfare states and environmental states have adopted extensive and swift measures to meet the needs resulting from the ever-expanding and emerging old and new social and ecological risks. Numerous existing policies have been amended, and new policy intervention areas have been established. On the one hand, welfare states have expanded and refined policy tools aimed at addressing poverty, inequality, health care, education and training and labour protection and activation (Bonoli & Natali, Reference Bonoli and Natali2012; Esping-Andersen, Reference Esping-Andersen2002; Hasanaj, Reference Hasanaj2022; Hemerijck, Reference Hemerijck2017). On the other hand, relatively newly constituted environmental states have developed policy instruments in response to ecological concerns such as “climate change, deforestation and the degradation of soil, water and air” (Koch & Fritz, Reference Koch and Fritz2014, p. 679). While these two policy areas continue to go through major changes and address critical contemporary challenges, new proposals have been raised on the need for a “distinct network of environmental and welfare policy governance” (Koch & Fritz, Reference Koch and Fritz2014, p. 679). There is a growing interest in implementing environmental state and welfare state initiatives that are not “conflictual” but rather cooperative (Dryzek, Reference Dryzek, Gough, Meadowcroft and Dryzek2008). For example, according to Gough and Meadowcroft (Reference Gough, Meadowcroft, Dryzek, Norgaard and Schlosberg2011), climate change will raise the need for existing social policy measures, as well as increase financial demands for additional environmental policy expenditures and the regulation of harmful consumption.
In this context, the importance of government efforts to develop, implement and evaluate coherent and mutually supportive policies that contribute to sustainable development has received increased attention (OECD, 2016). Numerous scholars in the fields of sustainability, environmental states and welfare states (Fitzpatrick, Reference Fitzpatrick2004; Gough, Reference Gough2015; Hirvilammi & Koch, Reference Hirvilammi and Koch2020; Koch & Fritz, Reference Koch and Fritz2014; McGann & Murphy, Reference McGann and Murphy2023) have advocated for the advancement of an eco-welfare state and perceived it as a viable path forward. The concept of the eco-welfare state is a recent development in the literature on welfare and environmental states and deserves further academic exploration. In response, this study aims at answering the following overarching question: What is the current understanding of the eco-welfare state, and are there any observed shifts towards this model of governance? The existing research lacks a comprehensive definition of the eco-welfare state concept and sophisticated empirical findings that identify possible movements towards or the existence of eco-welfare state patterns. Therefore, this study has a twofold objective to tackle these fundamental gaps in the existing literature. First, I examine the most prominent research that investigates the synergies and trade-offs between welfare states and environmental states, and then I evaluate the relevant conceptualizations of the eco-welfare state and other terms with similar meanings. This stage seeks to clarify the rationale behind this nexus and to unify and refine the understanding of this concept. Second, I plan to test empirically the presumption of global or regional transitions towards or the existence of an eco-welfare state pattern. I do this by employing advanced empirical methods such as model-based cluster analysis, and by including a wider range of crucial environmental and welfare state indicators for 42 developed and developing nations.
This study proceeds as follows. Section “An overview of the literature: connecting the dots between the environmental states and welfare states” reviews the literature on welfare and environmental state regimes. Sections “Reviewing and refining the eco-welfare state concept” and “Trade-off or synergy?” attempt to refine the understanding of the eco-welfare state definition and further elaborate on potential synergies and trade-offs between environmental states and welfare states. Sections “Data and method” and “Results” include the data and model-based cluster analysis results, and unveil potential shifts towards the eco-welfare state. Section “Conclusion” presents conclusions and future research recommendations.
An overview of the literature: connecting the dots between the environmental states and welfare states
The concept of the “welfare state” emerged in the 1950s, referring to the government’s role in ensuring people’s access to and receipt of social services (Meadowcroft, Reference Meadowcroft, Barry and Eckersley2005). Included are government programs that intervene in health care, education, unemployment insurance, pensions and family benefits, as well as the management process and ideological foundations for such activities (Meadowcroft, Reference Meadowcroft, Barry and Eckersley2005, p. 2). In the early 2000s, the concept of the “environmental state” gained prominence, referring to government programs aimed at addressing environmental issues such as “climate change, biodiversity loss and ozone depletion” (Duit, Feindt, & Meadowcroft, Reference Duit, Feindt and Meadowcroft2016, p. 1). Numerous academics in this field have studied the potential of building such a state whose primary objective is “managing environmental burdens” (Lafferty, Reference Lafferty, Lachapelle and Trent2000; Lundqvist, Reference Lundqvist2004; Meadowcroft, Reference Meadowcroft, Barry and Eckersley2005, p. 3), precisely consisting of government activities aimed at minimising environmental repercussions, promoting ecological values and reducing environmental risks (Meadowcroft, Reference Meadowcroft, Barry and Eckersley2005, p. 3).
Recent scholarship has sought to examine a contemporary progressive policy direction that combines environmental state and welfare state objectives (Bailey, Reference Bailey2015). Ian Gough’s research work has made a significant contribution to this discussion by addressing a variety of critical challenges (Bailey, Reference Bailey2015). Among them are the need to decarbonize social services, welfare state typologies and their ability to fulfil the demands of the twenty-first century, and the need to connect welfare and environmental state goals (Gough, Reference Gough2010, Reference Gough, Farnsworth and Irving2011a, Reference Gough2011b, Reference Gough2013b; Gough & Meadowcroft, Reference Gough, Meadowcroft, Dryzek, Norgaard and Schlosberg2011; Gough & Therborn, Reference Gough, Therborn, Castles, Leibfried, Lewis, Obinger and Pierson2010). This collection of research sparked a substantial academic discussion on the fundamental idea of linking two important policy domains in order to jointly address major and persistent global concerns. Existing research draws comparisons between the environmental and welfare states, often linking their past, present and future (Dryzek, Reference Dryzek, Gough, Meadowcroft and Dryzek2008; Gough, Reference Gough2011b, Reference Gough2015, Reference Gough2016; Meadowcroft, Reference Meadowcroft, Barry and Eckersley2005). While the timeframes and reasons for their emergence differ, there are signs of convergence between these two policy domains today.
Meadowcroft (Reference Meadowcroft, Barry and Eckersley2005) highlighted several parallels between these two policy domains, laying the groundwork for future analysis into possible connections. First, it is argued that both environmental states and welfare states reflect the expansion of governmental programs, activities and expenditures into “new sectors of social life.” Second, both include government responses to market failures and volunteerism. Thirdly, the two realms work “under significant economic and political constraints,” which alters conventional economic cooperation patterns (Meadowcroft, Reference Meadowcroft, Barry and Eckersley2005). For illustration, on one side, welfare state transfers impact wages, labour supply and conditions, corporate taxation and corporate profits. On the other side, ecological factors impact pollution standards, industrial and consumer spending, planning constraints and nature protection initiatives (Meadowcroft, Reference Meadowcroft, Barry and Eckersley2005). Environmental states and welfare states are, arguably, long-term processes of economic, social and political development, particularly in response to (post)industrialisation, urbanisation, changes in family and life expectancy, shifts in production and consumption patterns and a growing population (Meadowcroft, Reference Meadowcroft, Barry and Eckersley2005, pp. 6–9).
Gough (Reference Gough2016) also developed a comparative framework for welfare and environmental state policies. His study outlines five growth drivers of the welfare state to explain the emergence of the environmental state. While a comprehensive explanation of the observed similarities and differences is outside the scope of this research, the results “illustrate two conceivable configurations and hypothesise on the circumstances for closer, more integrated eco-welfare states” (Gough, Reference Gough2016, p. 24). However, such interactions raise fundamental questions about economic objectives, environmental management and social well-being systems (Meadowcroft, Reference Gough, Meadowcroft, Dryzek, Norgaard and Schlosberg2011). For example, are contemporary welfare states environmentally unsustainable, and can civilizations endure without inflicting net environmental costs on future generations? Can concerns about the quality of life, economic disparities and consumer protection, on the other hand, be linked to environmental burdens, individual and community well-being and future material consumption (Meadowcroft, 2011)? These questions are congruent with two concepts of sustainable development: the concept of “needs”Footnote 1 and the concept of “limitations,” paving the way for more research in the next sections (Gough, Reference Gough2015, p. 1195; World Commission on Environment and Development, 1987, p. 43).
Reviewing and refining the eco-welfare state concept
The formulation of policies on the interaction between welfare and environmental policies might take three distinct pathways (Sabato, Mandelli, & Vanhercke, Reference Sabato, Mandelli and Vanhercke2021). First, “the silos logic” entails a complete separation in the policy-making process. Second, “parallel development of policies” implies a logic of independent definition of policy objectives and tools, but with a dose of future understanding between these two domains. Third, “eco-social integration” refers to a policy-making process that attempts to create and achieve interconnected objectives (Mandelli, Reference Mandelli2021; Sabato, Mandelli, & Vanhercke, Reference Sabato, Mandelli and Vanhercke2021). This study is particularly concerned with the third pathway, representing the eco-social policies approach – known as “public policies designed to pursue explicitly (output-based) and interconnectedly (policy integration) both ecological and social policy goals” (Mandelli, Reference Mandelli2021, p. 1). In other words, the eco-social policy addresses the social consequences of environmental policies while simultaneously tackling the environmental consequences of welfare state programs – that is, encouraging harmful production or consumption (Koch & Fritz, Reference Koch and Fritz2014; McGann & Murphy, Reference McGann and Murphy2023). Environmental sustainability and social justice are at the centre of eco-social policy, which envisions a welfare state that is integrated with ecosystems and compliant with ecological limits (Hirvilammi & Koch, Reference Hirvilammi and Koch2020; McGann & Murphy, Reference McGann and Murphy2023).
To comprehend the origin, meaning and rationale of the eco-welfare concept/regime, we should first revisit the welfare state and environmental state regimes. In the welfare state regimes literature, the most prominent study is Esping-Andersen’s (Reference Esping-Andersen1990) seminal work titled “The Three Worlds of Welfare Capitalism.” In this work, he suggests that welfare states follow systematically divergent paths and proposes three types of regimes: liberal, corporatist and social-democratic regimes. Numerous studies have replicated and improved this foundational work (ie, Hasanaj, Reference Hasanaj2022; Rudra, Reference Rudra2007; Sharkh & Gough, Reference Sharkh and Gough2010; Wood & Gough, Reference Wood and Gough2006), creating a collection of research known as the “welfare modelling industry” (Powell & Barrientos, Reference Powell and Barrientos2015). These studies use a wide range of research techniques, variables, and empirical methods, and they often corroborate the existence of Esping-Andersen’s typologies or introduce new ones into the field (ie, Hasanaj, Reference Hasanaj2022; Rudra, Reference Rudra2007; Wood & Gough, Reference Wood and Gough2006). In the environmental regimes literature, scholars place a strong emphasis on revealing international environmental regimes, viewing risks as worldwide concerns that require global solutions (Sprinz & Helm, Reference Sprinz and Helm1999; Vormedal, Reference Vormedal2010; Young, Reference Young2014). Various terminologies and conceptualizations for the environmental state have been proposed, such as “ecological state” (Lundqvist, Reference Lundqvist2001), “green state” (Dryzek et al., Reference Dryzek, Downes, Hunold, Schlosberg and Hernes2003) and “ecostate” (Meadowcroft, Reference Meadowcroft, Barry and Eckersley2005). Koch and Fritz (Reference Koch and Fritz2014) built on the last concept by classifying ecostates as “established ecostates,” “deadlocked ecostates,” “failed ecostates” and “emerging ecostates” (pp. 690–691). The vast majority of studies on the welfare state and environmental state regimes have a common assumption: welfare states and environmental states follow systematically divergent paths, meaning that they are neither extremely different nor extremely similar, but rather follow specific patterns.
The classifications of welfare regimes and environmental regimes should not be interpreted as these policy areas are mutually exclusive. Rather, prominent literature (ie, Gough & Meadowcroft, Reference Gough, Meadowcroft, Dryzek, Norgaard and Schlosberg2011; Meadowcroft, Reference Meadowcroft, Barry and Eckersley2005) emphasises similarities and links between the two areas, resulting in the emergence of new research pathways. First, Meadowcroft (Reference Meadowcroft, Barry and Eckersley2005) introduced one of the most influential studies by developing the concept of ecostate and laying the path for further research into the synergies between environmental states and welfare states. According to the author, the ecological state is “predicated on a recognition that environmental systems are critical to long-term social welfare, and that their protection and enhancement require conscious and continuous adjustment by public power” (Meadowcroft, Reference Meadowcroft, Barry and Eckersley2005, p. 6). In other words, this concept proposes a state that is committed to maintaining a social development trajectory and sustainable growth within the boundaries of environmental sustainability (Meadowcroft, Reference Meadowcroft, Barry and Eckersley2005, p. 3). Second, Koch and Fritz (Reference Koch and Fritz2014) built on Gough’s (Reference Gough2010) seminal work on the policy and structural linkages that exist between welfare states and environmental states. The authors use the synergy hypothesis to investigate whether various welfare regimes are associated with different “environmental performances” (Gough, Reference Gough2010, p. 683). They contend that social-democratic welfare regimes and coordinated economies are “better positioned” than liberal welfare regimes to manage the interdependence of welfare and environmental state policies and hazards (Dryzek, Reference Dryzek, Gough, Meadowcroft and Dryzek2008; Dryzek et al., Reference Dryzek, Downes, Hunold, Schlosberg and Hernes2003). As a result, this synergy is often referred to as the “mutual reinforcement of welfare and environmental states” or “ecosocial state” (Koch & Fritz, Reference Koch and Fritz2014). Thirdly, in recent years, there is a novel attempt to further empirically explore the eco-welfare state’s existence and sub-regimes. Zimmermann and Graziano (Reference Zimmermann and Graziano2020) revealed several eco-welfare states, which they characterise as “interaction in social and environmental protection” (p. 2). The primary objective of this study is to investigate possible relationships between “social and ecological performance” (Zimmermann & Graziano, Reference Zimmermann and Graziano2020). They categorise the welfare and ecological data of 27 European nations into six categories using hierarchical analysis. The results indicate that the Nordic cluster outperforms other clusters, implying that it is the “best eco-welfare state” regime at present (Zimmermann & Graziano, Reference Zimmermann and Graziano2020, p. 17).
This study synthesises the definition of the eco-welfare state, which encompasses the synergies of both welfare and environmental state regimes, by drawing from a comprehensive review of existing literature and recent efforts to help shape the understanding of their interaction. I recommend the following refined and complete description of an eco-welfare state: An eco-welfare state is a political and economic system in which the government simultaneously prioritises environmental protection and citizen well-being. It emphasises harmonised policies and programs that promote environmental sustainability and social well-being, with particular attention to climate change mitigation and adaptation measures, as well as social protection and investment for the people.
Trade-off or synergy?
Although there is substantial evidence showing that there are significant links between the welfare state and environmental state policies and objectives, this does not mean that the whole path between these two areas is devoid of tension. This section seeks to highlight and explore the key trade-offs and synergies between welfare states and environmental states.
Trade-offs imply that environmental state and welfare state policies and objectives may collide or compete. According to Dryzek (Reference Dryzek, Gough, Meadowcroft and Dryzek2008), despite the fact that some governments have not yet allocated adequate resources to environmental initiatives, competition between these two policy areas is imminent. He contends that global management of climate change concerns will have an impact on other policy areas, notably welfare state programs. For example, due to the need to reallocate money to assist efforts aimed at mitigating climate change or compensating those affected, social welfare retrenchments may be inevitable (Dryzek, Reference Dryzek, Gough, Meadowcroft and Dryzek2008, p. 13). Gough (Reference Gough2016) also expressed similar concerns and in addition argues that many nations’ capacity to address increasing social and environmental crises has been impeded by decades of “macroeconomic instability, fiscal austerity and high inequality” (p. 40). As a result, policy goals may become conflicting. Furthermore, economists and public opinion scholars are also engaged in the debate on how climate change mitigation and adoption policies generate new demands for government spending, which are likely to conflict with social spending (Bailey, Reference Bailey2015; Jackson, Reference Jackson2009; Victor, Reference Victor2008; Voituriez, Reference Voituriez2020). The former emphasises the importance of empirical evidence on the linkages between welfare and environmental policy while highlighting the possibilities of rivalry and tension between these two fields. The latter investigates the public’s perception of environmental and social policy and finds significant variation (Jakobsson, Muttarak, & Schoyen, Reference Jakobsson, Muttarak and Schoyen2017). In this vein, recent findings suggest that the generosity of the welfare state is associated with less environmental protection support, or vice versa (Parth & Vlandas, Reference Parth and Vlandas2022), or that public support for welfare and climate change programs is split (Gugushvili & Otto, Reference Gugushvili and Otto2021).
The existing literature highlights more tensions between these two policy areas. Implementing policies that protect the environment may increase costs for businesses and consumers, which can negatively impact social welfare. Apparently, it has proven to be very challenging to identify or implement climate policies that meaningfully achieve mitigation without significantly harming the disadvantaged populations, particularly in job losses, increased food prices, or energy prices (Budolfson et al., Reference Budolfson, Dennig, Errickson, Feindt, Ferranna, Fleurbaey, Klenert, Kornek, Kuruc, Méjean, Peng, Scovronick, Spears, Wagner and Zuber2021). For example, while carbon taxes are hailed as effective policy measures in pursuit of the mitigation of climate change, they could simultaneously have severe adverse “distributional effects” on the lower income households (Budolfson et al., Reference Budolfson, Dennig, Errickson, Feindt, Ferranna, Fleurbaey, Klenert, Kornek, Kuruc, Méjean, Peng, Scovronick, Spears, Wagner and Zuber2021; Malerba, Gaentzsch, & Ward, Reference Malerba, Gaentzsch and Ward2021, p. 1). Therefore, if the revenues from taxation are not redistributed properly to the vulnerable population, then increases in inequality and poverty are the highly likely consequences (Budolfson et al., Reference Budolfson, Dennig, Errickson, Feindt, Ferranna, Fleurbaey, Klenert, Kornek, Kuruc, Méjean, Peng, Scovronick, Spears, Wagner and Zuber2021; Shang, 2021). On the contrary, policies that focus on social welfare may lead to increased consumption and pollution which can harm the environment. For example, prominent scholars argue that the welfare state itself has a significant ecological footprint, particularly in enabling large portions of the population to engage in environmentally harmful production and consumption patterns (Koch, Reference Koch2013; Koch & Fritz, Reference Koch and Fritz2014). Last but not least, there may be also conflicts between different interest groups, such as environmentalists and labour unions that have different priorities.
Synergies, on the contrary, suggest that environmental state and welfare state policies and objectives may complement one another and share common ground. The incorporation of the notion of “state” serves as a starting point for investigating potential synergies. Unlike welfare state research, until recently, environmental research – that is, climate change, biodiversity, ozone depletion – has mostly focused on the international character of the challenges it addresses (Biermann & Siebenhüner, Reference Biermann and Siebenhüner2009; Hoffman, Reference Hoffman2005; Pattberg, Reference Pattberg2007). Recent studies, however, advocate “returning the state” to the centre of environmental research (Duit, Feindt, & Meadowcroft, Reference Duit, Feindt and Meadowcroft2016) and designating it as the “central analytical category” (Bevir, Reference Bevir2011). This approach enhances links between environmental studies and studies of the modern state, particularly comparative welfare states (Esping-Andersen, Reference Esping-Andersen1990) and varieties of capitalism (Duit, Feindt, & Meadowcroft, Reference Duit, Feindt and Meadowcroft2016, pp. 3–4; Hall & Soskice, Reference Hall and Soskice2003). Institutionally, environmental states are built on top of welfare states. As a result, it reinforces the argument that welfare regimes may affect environmental policies and even influence governments to develop integrated eco-social programs as opposed to just adding new ones to existing ones (Gough, Reference Gough2016). Gough (Reference Gough2013a) offers concrete examples of possible synergies between environmental state and welfare state programs, such as the efforts to mitigate the risks deriving from climate change:
If business as usual prevails, then the prospects for human welfare across much of the planet are pessimistic. The priority in social policy will be to adapt habitats and infrastructures to new climatic threats, whether drought, floods, frequent storms, sea-level rises or unpredictable temperature changes; to foster individual and social adaptive capacities; and to protect the most vulnerable via aid transfers, disaster relief and managed migration (p. 3).
Climate change “is a serious global threat, and it demands an urgent global response” (Stern, Reference Stern2007, p. vi). There is a substantial amount of scientific evidence and consensus on this serious issue, which highlights the urgency for swift and decisive responses to avert the worst of its repercussions. David Attenborough, a world-famous naturalist, told the Security Council in 2021 that “climate change is the biggest threat to security that modern humans have ever faced” (United Nations, 2021, p. 1). Climate change is also seen as a “crisis multiplier.” As a result of it, “wildfires, cyclones, floods and droughts are now the new normal,” and the collapse of what gives us basic security, such as “food production, access to fresh water, habitable ambient temperature and ocean food chains,” is now a real possibility (United Nations, 2021, pp. 1–2). These warnings are well-corroborated by the Institute for Economics and Peace’s (2020) book “Ecological Threat Register,” which suggests that about 1.2 billion people are at risk of being displaced because of climate change, and 6.4 billion are at risk of medium or high ecological hazards (p. 4). This all confirms that environmental consequences will hit the poor even harder, and it will be the responsibility of the existing and future welfare policies to mitigate as much as possible these devastating effects.
In a similar context, several further synergies between environmental and welfare states are highlighted. For example, reducing animal production and consumption, as well as shifting from driving to walking and cycling, has significant health benefits, including a reduction in “heart diseases, depression, cancer and dementia” (Gough, Reference Gough2013a, p. 6). Recently, programs for human and social welfare that were formerly handled by the welfare state have been reinforced with environmental state functions that are responsible for addressing common threats (ie, climate change mitigation). Gough (Reference Gough2013a) states that:
…social policy needs to combine with environmentalism to forge a unified eco-social policy that can achieve ecologically beneficial and socially just impacts: by promoting new patterns of production, consumption and investment, changing producer and consumer behavior while improving wellbeing, and ensuring a fairer distribution of power and resources (p. 9).
The low-carbon energy transition is used as an example in support of the synergy approach (García-García, Buendía, & Carpintero, Reference García-García, Buendía and Carpintero2022). On the one hand, such transitions are accompanied by a number of social consequences that markets alone cannot address, such as “the destruction of jobs in former conventional sectors (without alternatives), the lack of labour mobility in some sociodemographic profiles, skill shortages, gender inequality and regressivity” (García-García, Buendía, & Carpintero, Reference García-García, Buendía and Carpintero2022, p. 1). On the other hand, welfare states are seen as the most effective way to address these negative outcomes and even influence new potential positive outcomes, particularly via social services such as social assistance, social insurance and social investment programs (García-García, Buendía, & Carpintero, Reference García-García, Buendía and Carpintero2022).
Data and method
I assembled a dataset that includes 42 nations representing diverse regions and levels of development. To the best of my knowledge, this is the first study to include non-OECD nations – some of which are classified as middle-income or low-income – in the eco-welfare state literature. For operationalization purposes, I relied heavily on the literature review in the preceding sections to prepare Table 1, which contains the essential elements of the environmental state and the welfare state. Based on this classification, I can identify the key indicators representing each dimension, and use them to empirically check whether they could help to unveil potential shifts towards or existence of eco-welfare state regimes. The indicators representing the dimensions include policy inputs, outputs and outcomes.
Operationalization: eco-welfare state.

Source: Author’s classification.
The data sources include the World Bank, International Monetary Fund, United Nations, the Global Footprint Network and ECOLEX (IUCN, UNEP and FAO). Sixteen input, output and outcome variables representing key environmental and welfare state dimensions – as presented in Table 1 – are used for two periods, 2001 and 2015 (see Table 2 for details).
List of indicators.

Note: “Variable code” represents the acronym for each indicator that is included in the cluster analysis results. “Description” shows the complete name of the indicator. “Relation,” Environmental state (+/−) and Welfare State (+/−) classification suggest that the relevant indicator positively or negatively relates to that specific field. For example, a higher “Environment Protection expenditure” signifies an overall positive impact on the policy domain.
This dataset provides valuable insights into the potential shifts of specific countries towards an eco-welfare state pattern:
-
• Environmental state variables: A set of seven input, output and outcome indicators is used to represent the environmental state dimension of the analysis. As input indicators, I used environmental protection expenditures, the number of environmental legislations and environmental treaties in force. As an output indicator, I used the renewable electricity output relative to the total electricity produced in one country. As outcome indicators, which capture the performance of a country in terms of environmental issues, I used PM2.5 air pollution, mean annual exposure – CO2 emissions, and Ecological Footprint versus Biocapacity.
-
• Welfare state variables: A set of nine indicators is used to represent the welfare state dimension of the analysis. As input indicators, I included government expenditures on housing and amenities, health, education and social protection. As output indicators, the education index, wage and salaried workers, pre-primary school gross enrolment ratio, and labour force participation rate are included. Whereas, as an outcome variable, I used the child mortality rate.
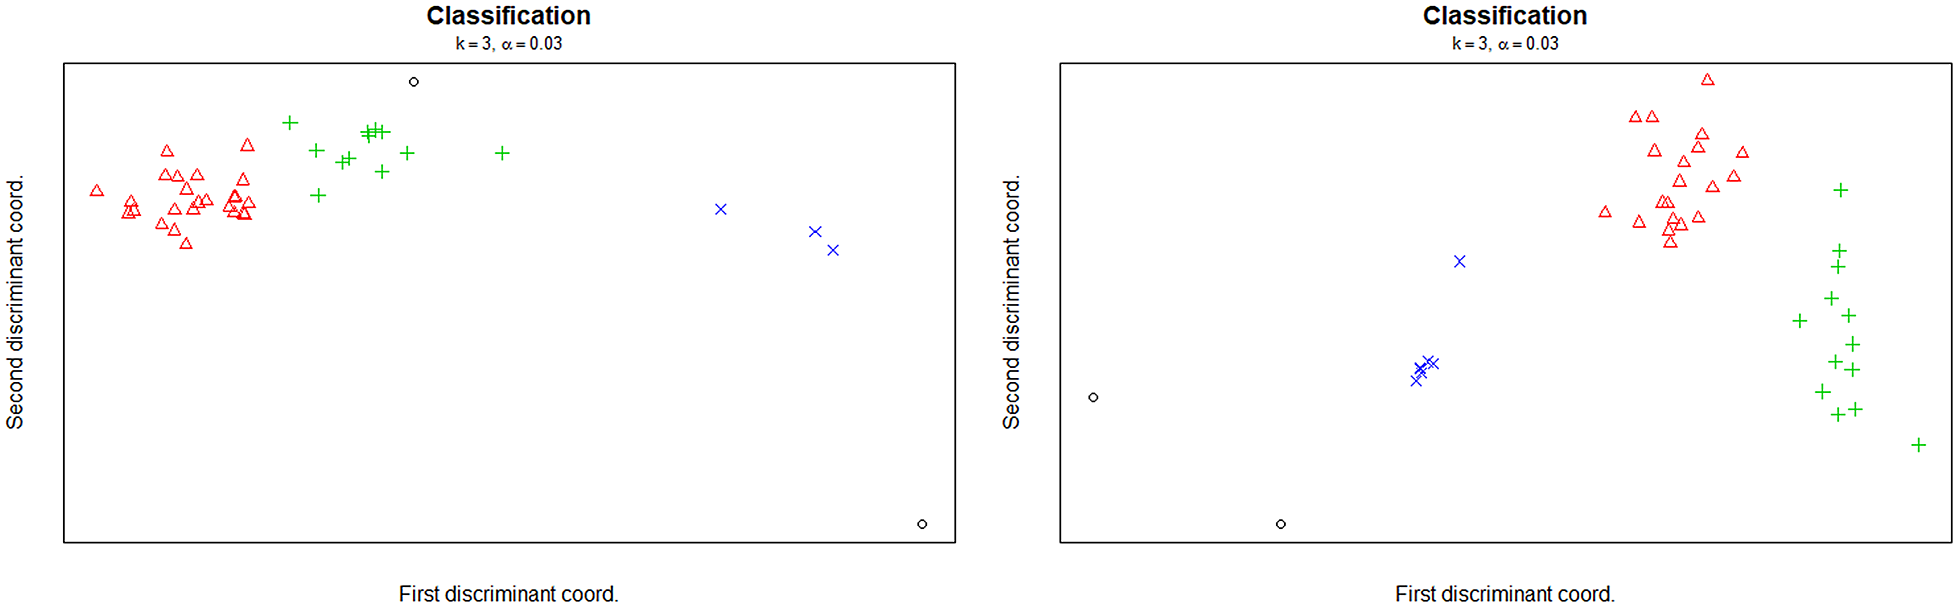
There are at least three important points that need to be taken into account concerning the data timeframe, country and indicator selection. First, the reason for selecting these two data points is a mix of two important factors: data availability, especially because the study includes a diverse set of countries and indicators; and, because both time periods could be useful to unveil any potential shift towards an eco-welfare state, as they represent roughly the phases when the debate about eco-welfare state emerged (2001) and when it began to gain rather significant attention (2015). Second, this study intentionally uses a mix of countries at different levels of development, therefore, the country selection is also dependent on the availability of data for the 16 indicators that were extracted from several comparable datasets. This criterion of country selection addresses the criticisms about the existing welfare or environmental regimes literature which predominantly uses only developed and OECD countries (mainly because of data availability), or in rare cases use developing countries separately (Hasanaj, Reference Hasanaj2022). This research intends to add a diverse range of nations to the existing eco-welfare literature and provide a level playing field for global comparisons in this area. Third, using two data points, a mix of countries, and a relatively large number of datasets, and the desire to use comparable data also comes with the cost of having a limited number of indicators for selection (see for example Hasanaj, Reference Hasanaj2022; Rudra, Reference Rudra2007; Sharkh & Gough, Reference Sharkh and Gough2010; Wood & Gough, Reference Wood and Gough2006). For example, welfare regime studies also use output and outcome variables in cases where input variables are not available. In addition, the indicator selection is also dependent on the final selected model after conducting the robustness checks (see Figure C1).
In terms of methodology, to the best of my knowledge, two articles attempted to empirically shed some light on the existence and nature of eco-welfare states and used simple statistical techniques such as correspondence analysis and hierarchical cluster analysis. In this study, I applied model-based clustering – a sophisticated empirical methodology with “significant advantages over conventional clustering techniques”Footnote 2 (Ahlquist & Breunig, Reference Ahlquist and Breunig2011, p. 96). The cluster analysis is carried out in R Core Team (2017), using the mclust package (Scrucca et al., Reference Scrucca, Fop, Murphy and Raftery2016), and the data is normalised due to the wide variation in indicator ranges. Three essential stages comprise the empirical methodology. First, two cluster analyses for the years 2001 and 2015 are conducted. Second, the results of the two sets of cluster analyses are analysed to detect any trends concerning the shifts towards or existence of eco-welfare states. Third, I check whether environmental states and welfare states followed a “synergy” or “trade-offs” strategy based on the difference in indicator values between 2015 and 2001.
Results
Model-based cluster analysis: snapshot results for 2001 and 2015
In the first part of the analysis, the main objective is to explore whether the eco-welfare state regimes already exist, as suggested by the recent literature. I reviewed several important papers on welfare state regimes to figure out the best empirical approaches for detecting systematically divergent patterns (ie, Hasanaj, Reference Hasanaj2022; Rudra, Reference Rudra2007; Sharkh & Gough, Reference Sharkh and Gough2010; Wood & Gough, Reference Wood and Gough2006). Cluster analysis turns out to be the most commonly used approach, which categorises nations on the basis of their common characteristics. Therefore, I employed model-based cluster analysis independently for the years 2001 and 2015, using the dataset for 42 countries and 16 environmental state and welfare state variables. These two snapshot cluster results may be used to determine if, between 2001 and 2015, a clearer grouping of countries with comparable characteristics has emerged. Furthermore, it allows for measuring the similarities and differences between these groupings of countries, examining how they vary from one another, and deciding if any of them displays substantial evidence of the emergence of an eco-welfare state pattern in 2015. Because I am mainly interested in cluster characteristics, country or indicator-specific analyses are beyond the scope of this study.
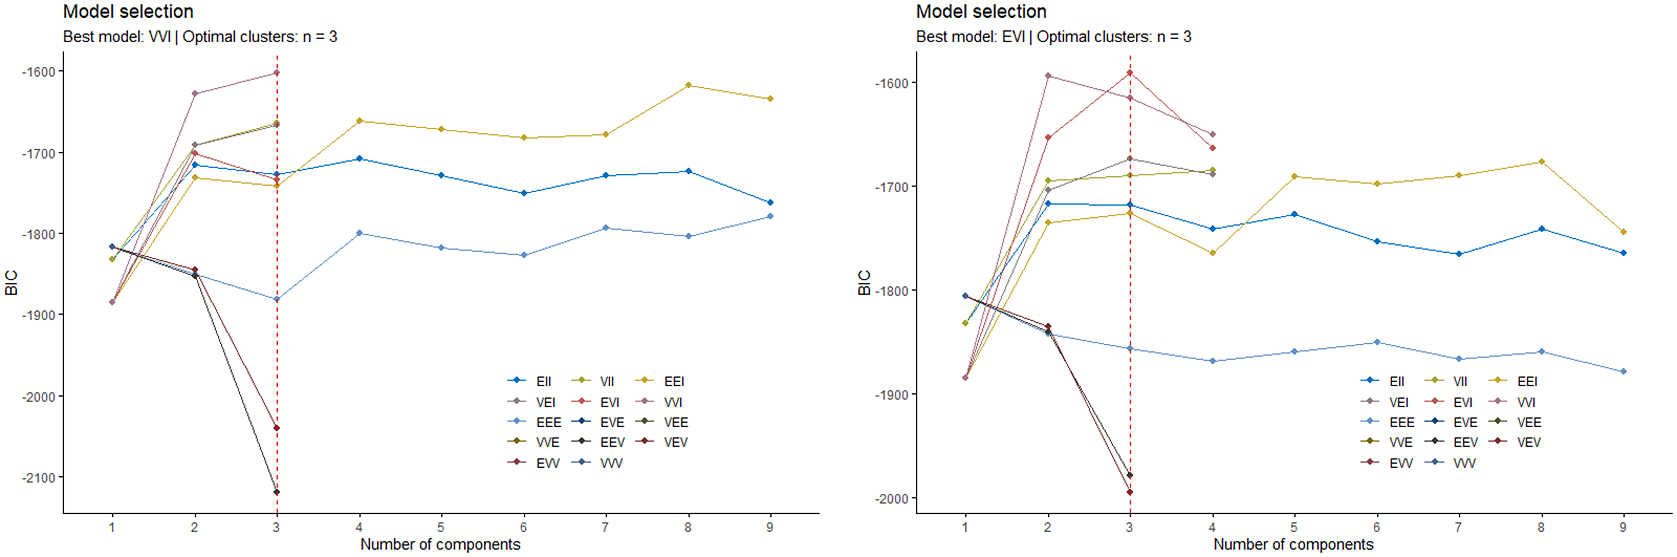
The model-based cluster analysis snapshot results for 2001 and 2015 reveal three clusters for each period, as illustrated in Figures 1 and 2 (see Appendices B and C). The academic debate on possible synergies between environmental and welfare states began in the early 2000s. As a result, for comparative purposes, I used 2001 as the “base year,” and 2015 as the year I used to study the nature of the shift and the emergence of a potential eco-welfare state pattern. The 2001 model reveals three clusters, although the differentiation between them is fuzzy. The 2015 model, on the other hand, reveals three distinct clusters. Initial examination of the cluster plots suggests a likely shift towards more distinct, systemically divergent patterns. To analyse the key characteristics of each cluster, however, a more in-depth statistical analysis is required (see Table 3).
Cluster plots for 2001. The figure shows three cluster plots for each model. Each value represents one country.

Cluster plots for 2015. The figure shows three cluster plots for each model. Each value represents one country.

Cluster Analysis Results for 2015

Note: Cluster average: the average value of an indicator for countries within one cluster. Total average: the average value of an indicator for all countries in three clusters. Cluster average/Total average: how much above or below the total average is one indicator’s performance in a certain cluster? Change average: this value is the average of cluster average/total average results. Four variables have reversed cluster average/total average percentages (PM2.5, CO2Ems, CFPringPcap and ChildMort) because higher values mean lower performance and vice versa.
This is the approach I followed to examine cluster characteristics (see Table 3 for details). First, I obtained the 2015 data for each country’s 16 environmental and welfare indicators and assigned them to their respective clusters. Second, I calculated the cluster average and total average for each indicator. Third, I separately divided each indicator’s cluster average by the total average. Here I could find which indicator out/underperformed the sample’s total average. Fourth, since I am especially interested in cluster performance, I separately measured the average performance of the environmental state and welfare state indicators. To do so, I calculated the so-called change average for both policy areas – practically the average of the results deriving from the previous step. The change average results are of the greatest interest since they provide a comprehensive picture of each cluster’s relative performance in environmental state and welfare state variables, respectively (please read the Note under Table 3 for more details).
How do we interpret the change average results? If a cluster demonstrates positive performance in both the environmental state change average and the welfare state change average, there is a prospect for synergy rather than a trade-off, since it indicates that both policy areas are growing in parallel. The cluster should thus be perceived as an eco-welfare state regime. Furthermore, if a cluster performs positively in the change average in one policy area, and negatively in the other, this case is treated as a trade-off. For example, if one cluster is only performing positively in the environmental state change average, it should be regarded as an environmental regime, and the same logic should be applied to the welfare state scenario (see Table 3 for details). Lastly, negative change averages in both policy domains show that a cluster is below the total average. Consequently, there is less space for eco-welfare state discussion, as this group of nations may still be in the first stages of developing their environmental and welfare states. Based on these three principles, I interpret the results of the 2015 cluster analysis as the following:
-
• Cluster 1 includes a mix of low-middle-income, upper-middle-income and high-income countries. This cluster has a change average of a negative 1 percent in environmental state indicators and a positive 4.0 percent in welfare state indicators, suggesting that its relative average performance leans positively exclusively towards welfare state-related concerns. While not yet there, this group of nations might be considered a prospective emerging eco-welfare state regime due to their narrow negative performance on change average on environmental state indicators. This argument is backed further by data in Table 4, which assesses the 14-year change in these indicators and will be explored in the next subsection. In terms of specific indicators, this cluster reveals a relatively poor performance in the indicators such as “Renewable energy,” “Legislation,” and “Social Protection Expenditures,” which could be of high importance in strengthening these countries’ paths towards clearer eco-welfare state regime.
-
• Cluster 2 includes a group of high-income OECD countries. The results of this cluster demonstrate that environmental state and welfare state variables registered a positive change average of 8.7 and 13.7 percent, respectively, in both domains. Three significant findings emerged from this cluster. First, change average findings indicate that this group of nations performed positively in both the environmental state and welfare state areas, indicating that these countries pursued a strategy of parallel growth and synergy in these two areas. These data empirically reveal the existence of the eco-welfare state regime and validate the prevalent theoretical assumptions. Second, these findings show that eco-welfare regimes already exist, predominantly in high-income nations. Third, this cluster contains liberal, corporatist and social-democratic states. Beyond the findings of Zimmermann and Graziano’s (Reference Zimmermann and Graziano2020) study, such results might pave the way for more research on the various subtypes of eco-welfare state regimes. In terms of specific indicators, this cluster further exposes the need for developed countries to focus more on cleaner air and reducing the level of carbon footprint per capita.
-
• Cluster 3 consists of a small set of upper-middle-income and lower-middle-income countries, with negative environmental state and welfare state change averages of 23.2 and 53.2 percent, respectively. This group’s performance on environmental state and welfare state indicators is significantly below the sample’s total average, ruling out any consideration of an eco-welfare state pattern at this time. However, it is important to highlight that the environmental state indicators perform far better than the welfare state indicators.
Cluster Analysis Results for the Difference in 2015-2001

Note: Cluster average: Difference 20152001: the average value of the difference between 2015 and 2001, of an indicator for countries within one cluster. Cluster average 2015: the average value of an indicator for the year 2015, in the respective cluster. Change percentage: it represents cluster average: Difference 2015 2001 divided by cluster average 2015. Change average: this value is the average change percentage. Four variables have reversed cluster average/total average percentages (PM2.5, CO2Ems, CFPringPcap and ChildMort) because higher values mean lower performance and vice versa.
Discovering trends of potential trade-offs or synergies?
In the second step of the analysis, I plan to delve deeper into the patterns of the change in environmental state and welfare state indicators from 2001 to 2015 (see Table 4 for details). Is there any evidence of simultaneous progress in both policy areas in any of the clusters? Or, is there a 14-year change that suggests a prospective trend in which governments adopt synergy rather than trade-off approaches to environmental and welfare state policies? These results may assist us in comprehending potential cluster shifts towards an eco-welfare state pattern in the coming years. Specifically, we can assess whether or not other clusters would be considered eco-welfare regimes in the near to medium future based on this pattern.
First, I computed the differences in indicator values between 2015 and 2001 for each country, using the classification derived from the 2015 cluster findings (please see Note under Table 4 for details). Second, for each indicator, I calculated the cluster average of the data derived from the first step. Third, I divided the cluster average of the data derived from the difference in indicator values between 2015 and 2001 by the cluster average of the 2015 data. This value shows the relative performance of every nation in each indicator over 14 years. Fourth, since I am interested in the macro performance of each cluster, I then averaged the data from step three to get the so-called change average for environmental state and welfare state policies, respectively. The change average results are of the greatest interest because they provide a more comprehensive picture of each cluster’s performance in environmental state and welfare state indicators over a longer time period. If the change average in both the environmental state and welfare state categories is positive, it indicates that these two groups progressed simultaneously throughout time and employed a synergy approach. If the change average in one domain is positive while in the other domain is negative, it indicates that the environmental state and welfare state domains in each cluster competed with one another and, therefore, employed a trade-off approach.
Surprisingly, the results reveal a positive change average in two policy areas and all three clusters, meaning that over a longer period, environmental state and welfare states followed a “synergy” approach (Table 4). However, it does not necessarily mean that all of them have “reached” the eco-welfare state stage, as indicated in the previous subsection. The following are the characteristics of each cluster (Table 4):
-
• Cluster 1 indicates that this group of countries made great progress in both environmental state and welfare state areas, with positive change averages of 24.6 and 13.9 percent, respectively. Though, the change average in the environmental state domain is significantly higher, indicating that, if the current trend continues, the negative 1 percent change average revealed in Table 3 could soon become positive. Hence, conditional that this trend continues, the prospect for this cluster (or several countries within it) to emerge as an eco-welfare regime is relatively high.
-
• Cluster 2 findings corroborate the synergy trend of the group of nations categorised as an eco-welfare state regime as shown in the cluster analysis explained in the previous subsection (see Table 3). Though, the environmental state change average of 20.2 percent is significantly greater than the welfare state change average of 1.9 percent. This variation is explicable for two reasons. First, more developed countries have the financial and professional resources to meet the environmental concerns of the twenty-first century. Second, the more established welfare state systems in these nations allow them to allocate a greater proportion of their resources to environmental concerns while maintaining the stability and advancement of welfare state programs.
-
• Cluster 3 suggests that this group of countries has shown progress in both policy domains; though, greater emphasis is being placed on welfare state measures (17.7 percent increase) compared to environmental state measures (7.2 percent increase).
Conclusion
The greatest challenges the world faces in the twenty-first century are poverty, inequality and climate change. The eco-welfare state, sometimes referred to as the synergy between environmental and welfare states, is frequently viewed as one of the most practical methods for tackling these issues. In this article, I suggest that the literature on the eco-welfare state is in its infancy and requires two theoretical and empirical contributions that might pave the way for future research in this area. Notably, the literature lacks a clear theoretical explanation of the concept of an eco-welfare state, and neither the shift towards nor the existence of this pattern has been proven by any rigorous empirical approach. In response, I conducted two significant research steps. First, this article proposed a refined definition of an eco-welfare state and its rationale. This is accomplished by following a more systematic research approach. It starts with a comprehensive examination of the broader connections between environmental and welfare states. Then it looks further into the mechanisms that lead to synergies and the possible trade-offs between these two domains. Following this, a number of key environmental state and welfare state regimes studies are examined in an effort to better comprehend their rationale and how they may shed light on the evolution of the eco-welfare state. Finally, this study compiles for the first time the most essential theoretical information needed to understand the concept of the eco-welfare state, and then proposes a new definition. Second, this is one of the first empirical studies to confirm the presence of an eco-welfare state pattern and its emergence in numerous countries. Specifically, the results unveil the existence of an eco-welfare state regime in a set of industrialised countries and suggest the possible creation of new eco-welfare state patterns in other less developed countries. The findings are based on advanced empirical techniques, such as model-based cluster analysis, and for the first time encompass a sample of countries with varying levels of development.
Future research may be conducted in a number of ways; nonetheless, I suggest that these are some of the areas which demand further academic attention. First, the eco-welfare state regime should be explored empirically beyond OECD countries, including more countries in Asia, Africa and South America. This study takes a major first step in this regard, but it is still not representative of many other major regions, particularly because of the lack of data since it uses extended time periods for the sake of detecting potential shifts. Future studies could, for instance, only focus on more recent data and analyse the eco-welfare state patterns from the current point of view; hence, benefiting from more comprehensive comparative datasets. Second, causal and explanatory analysis should be added to the empirical research on the eco-welfare state, and move beyond cluster analysis. Third, further research could include microanalysis, which would allow environmental and welfare state performance indicators to be studied in the context of a country or cluster (eg, Cluster 2). For illustration, there is significantly more data available for recent periods and developed countries; therefore, a much larger and more diverse group of indicators could be used to conduct more specific analyses.
Disclosure statement
The author declares no conflict of interest.
A. Appendices
A.1 Appendix A
Country sample.

A.2 Appendix B
Model selections: 2001 and 2015. The figure to the left shows the model selection for 2001 data, whereas the one to the right shows the model selection for the 2015 data. Bayesian Information Criterion (BIC) selects the best models or an optimal number of clusters. Hence, the model with the largest BIC score is chosen as the one with the strongest evidence.

A.3 Appendix C
Robustness checks: Trimmed Clusters for 2001 and 2015. Using tclust in R Studio, these two pictures show the cluster plots of the robustness check for 2001 and 2015, respectively. Outlier countries are shown in empty bullets “○.”