Introduction
Climate is the principal factor governing the distribution and abundance of most insects (Andrewartha and Birch Reference Andrewartha and Birch1954). Efforts to control invasive alien species with biological control often face a significant hurdle, in that the success of a natural enemy can be influenced by climatic factors. This is of particular importance in classical biological control. Messenger and van den Bosch (Reference Messenger and van den Bosch1971) reported that climatic factors are of major importance in determining the outcome of biological control programmes. It is generally agreed that biological control agents are best obtained from areas where climatic conditions match the areas in which they are to be released (Hoelmer and Kirk Reference Hoelmer and Kirk2005). Given our changing climate, an understanding of the potential impact of climate variability on pest species and their natural enemies may be important for developing durable biological control programmes, or at least understanding their vulnerability to climatic changes.
Climate change may alter existing biological control programmes in many ways (Hance et al. Reference Hance, van Baaren, Vernon and Boivin2007). Warming conditions may impact insect populations by extending the growing season, altering the timing of emergence from overwintering sites, increasing growth and development rates, decreasing generation times, reducing overwintering mortality, and changing their geographical distribution (Porter et al. Reference Porter, Parry and Carter1991; Gitay et al. Reference Gitay, Suarez and Watson2002). Tritrophic interactions between plants, herbivorous insects, and parasitoids are a result of a coevolutionary process that is related to specific, stable climatic conditions. Higher trophic levels are more likely to be affected by climate change since they require lower trophic levels to adapt to climate change (Hance et al. Reference Hance, van Baaren, Vernon and Boivin2007). These authors also state that climate change may affect host-parasitoid temporal or geographical synchronisation.
Bioclimatic simulation models, also known as ecological niche models, have been applied successfully to model the potential distribution and seasonal phenology of invasive insect pests in new environments (Sutherst et al. Reference Sutherst, Maywald and Kriticos2007; Mika et al. Reference Mika, Weiss, Olfert, Hallett and Newman2008; Olfert et al. Reference Olfert, Weiss, Turkington, Beckie and Kriticos2012). Kriticos et al. (Reference Kriticos, Maywald, Yonow, Zurcher, Herrmann and Sutherst2015) describe the simulation modelling process and the unique approach of CLIMEX® software. Whilst correlative species distribution modelling methods have been applied to invasive alien species, they are descriptive models, which provide little insight into the mechanisms constraining a species range, and have been found to be unreliable when applied into novel environments such as new continents or future climate scenarios (Webber et al. Reference Webber, Yates, Le Maitre, Scott, Kriticos and Ota2011). Mechanistic niche models provide more robust projections of species potential ranges in novel climates, but there have been few studies that have used them to explore the seasonal patterns of climate suitability (Kriticos et al. Reference Kriticos, Watt, Withers, Leriche and Watson2009; de Villiers et al. Reference de Villiers, Hattingh and Kriticos2012). A moderate number of studies have also developed bioclimatic models to identify potential areas where insects considered for classical biological control programmes may be successful against invasive pests (Julien et al. Reference Julien, Skarratt and Maywald1995; Villacide and Corley Reference Villacide and Corley2003; McNeill et al. Reference McNeill, Vink, Kean, Hardwick and Phillips2009; Haye et al. Reference Haye, Olfert, Weiss, Gariepy, Broadbent and Kuhlmann2013).
Given that the magnitude of projected temperature variations is beyond the experience of current biological control relationships, it is unlikely that historical data archives can be used as analogues to inform our understanding of the potential impacts. General circulation models (GCM) have been used to assess the impact and related system vulnerability due to climate and to produce relatively detailed modelling of important ecological processes (Mearns Reference Mearns2003). Research on the impact of climate change on the distribution and relative abundance of agriculture pests has been well documented (Gutierrez et al. Reference Gutierrez, Ponti, d’Oultremont and Ellis2008; Beckie et al. Reference Beckie, Weiss, Leeson and Olfert2012; Olfert et al. Reference Olfert, Weiss, Turkington, Beckie and Kriticos2012). Though there have been reviews related to the general impact of climate change on biological control agents, there have been relatively few case studies on specific species (Hance et al. Reference Hance, van Baaren, Vernon and Boivin2007; Thomson et al. Reference Thomson, Macfadyen and Hoffmann2010; Gillespie et al. Reference Gillespie, Olfert and Cock2013). As a result, the biological control community has much to benefit from species specific case studies of impacts of climate change.
Lygus Hahn (Hemiptera: Miridae) species are pests of glasshouse and field crops throughout North America including forages, cotton, horticultural, and oilseed crops (Soroka Reference Soroka1997; Layton Reference Layton2000; Broadbent et al. Reference Broadbent, Mason, Lachance, Whistlecraft, Soroka and Kuhlmann2002, Reference Broadbent, Gariepy, Haye and Kuhlmann2013). The seasonal life history of Lygus varies by latitude, seasonal weather patterns and the availability of suitable host plants. They generally overwinter as adults, just before winter in northern latitudes, under plant litter in field margins, including shelterbelts, headlands, and other uncultivated areas (Otani and Cárcamo Reference Otani and Cárcamo2011). Lygus species have from one to five generations per year, depending on environmental conditions and host plant availability (Cárcamo et al. Reference Cárcamo, Otani, Herle, Dolinski, Dosdall and Mason2002).
Lygus has a number of natural enemies, including predators, and parasitoids (Otani and Cárcamo Reference Otani and Cárcamo2011). Lygus nymphs are commonly parasitised by species of the genus Peristenus Förster and Leiophron Nees (Hymenoptera: Braconidae) (Loan and Bilewicz-Pawinska Reference Loan and Bilewicz-Pawinska1973; Goulet and Mason Reference Goulet and Mason2006), however, Leiophron species do not occur in the Prairie ecozone of western Canada. Peristenus species attack all nymphal instars of Lygus and kill their hosts in the fifth instar. Emerging larvae pupate and overwinter in the soil (van Steenwyk and Stern Reference van Steenwyk and Stern1976, Reference van Steenwyk and Stern1977; Bilewicz-Pawinska Reference Bilewicz-Pawinska1982). Depending on the species, Peristenus can be univoltine (Canada), bivoltine (Europe), or multivoltine (United States of America). Attempts to use exotic parasitoids for control of native Lygus populations in North America dates back to the 1960s (Clancy and Pierce Reference Clancy and Pierce1966; Craig and Loan Reference Craig and Loan1987; Broadbent et al. Reference Broadbent, Mason, Lachance, Whistlecraft, Soroka and Kuhlmann2002). Native North American Lygus parasitoids were considered ineffective, as nymphs of the first Lygus generation were primarily attacked, and subsequent Lygus generations were hardly parasitised (Clancy and Pierce Reference Clancy and Pierce1966; Day Reference Day1987). In contrast, parasitism of Lygus was found to be much higher in Europe (Craig and Loan Reference Craig and Loan1987; Day and Hoelmer Reference Day, Hedlund, Saunders and Coutinot2008). To increase overall parasitism of native Lygus, Peristenus digoneutis Loan (Hymenoptera: Braconidae), a parasitoid of the European tarnished plant bug Lygus rugulipennis Poppius, was imported from Europe and released (1979–1984) against Lygus lineolaris (Palisot de Beauvois) near Blairstown, New Jersey (United States of America) (Day et al. Reference Day and Hoelmer1990). In a follow-up study, Day (Reference Day1996) reported high levels of parasitism and significantly decreased Lygus densities on alfalfa. Subsequently due to adventive migration, the species was also recorded in Québec and Ontario, Canada. In subsequent years, it was also released in western Canada, but not yet been reported as established (Broadbent et al. Reference Broadbent, Gariepy, Haye and Kuhlmann2013).
Haye et al. (Reference Haye, Olfert, Weiss, Gariepy, Broadbent and Kuhlmann2013) developed bioclimatic simulation models to estimate the potential range and relative abundance of the biological control agent P. digoneutis and its hosts Lygus species based on European faunal data. They reported that P. digoneutis will continue to spread westwards from its original area of release in New Jersey throughout the United States of America and along the Great Lakes. The model further predicted that its southern distribution is limited by hot summer temperatures, whereas the northern range would depend on the number of Lygus host generations rather than cold stress. The model also suggested that climate conditions in western Canada would be mostly unfavourable for P. digoneutis, which may explain why earlier releases in this region had failed.
The objective of this study was to assess the impact of a changing climate on the response of P. digoneutis to future climates for both spatial (continental and regional) and temporal (annual and weekly) scales through the application of two general circulation models for Europe and North America.
Methods
The bioclimate model for P. digoneutis, developed using CLIMEX® 3.0 (Sutherst et al. Reference Sutherst, Maywald and Kriticos2007), has been described previously by Haye et al. (Reference Haye, Olfert, Weiss, Gariepy, Broadbent and Kuhlmann2013). Their bioclimate model calculates an ecoclimatic index (EI) that describes the climatic suitability of specific locations for species survival and reproduction. CLIMEX® is a dynamic modelling software utility that simulates the weekly responses of a population to climate and integrates them into a series of annual indices that summarise the suitability of each site and the strength of positive and negative climatic factors. It uses an annual growth index (GIA) to describe the potential for population growth as a function of soil moisture and temperature during favourable conditions, and up to eight stress indices (cold, wet, hot, dry, cold-wet, cold-dry, hot-wet, and hot-dry) to simulate population survival during inclement conditions. The weekly growth index (GIW) is a function of a temperature index (TI), and a moisture index (MI), and where included a diapause index (DI). The growth indices are functionally constrained to conform to the ecological Law of Tolerance (Shelford Reference Shelford1963), and are combined according to the Law of the Minimum (van der Ploeg et al. Reference van der Ploeg, Böhm and Kirkham1999). The ecoclimatic index (EI) is an overall measure of climatic suitability, which ranges from EI=0 for locations at which the species is not able to persist, to EI=100 for locations that are optimal for the species all year round.
In the current study, GCMs were applied to the P. digoneutis model for Europe and North America. The data were obtained from CliMond 10 (CliMond 2012), which is a data set that was developed for species bioclimatic modelling, including both correlative species distribution models and mechanistic niche models (Kriticos et al. Reference Kriticos, Webber, Leriche, Ota, Macadam and Bathols2012). The 10′ gridded data set includes a hybrid historical data set (based on CRU CL2.0 and WorldClim; centred on 1975), and a set of future climate scenarios from two general circulation models (CSIRO MK 3.0 and MIROC-H) for the 2030 and 2070 time periods. Climate projections were based on the SRES (special report on emission scenarios) A1B emission scenario (Nakicenovic and Swart Reference Nakicenovic and Swart2000). CliMond (2012) represents the first freely available future climate scenarios available in CLIMEX® format, and the historical data set represents an improvement in quality over the 10′ CRU CL2·0 data set distributed previously (Kriticos et al. Reference Kriticos, Webber, Leriche, Ota, Macadam and Bathols2012).
Model output was generated for each GCM scenario for Europe and North America. Two data sets, annual and weekly, were generated for each run. Annual data sets were analysed at the continental scale. Weekly output was analysed at the regional scale. Model runs (n=10) were exported to a Microsoft SQL Server database for analysis. Haye et al. (Reference Haye, Olfert, Weiss, Gariepy, Broadbent and Kuhlmann2013) reported that P. digoneutis distribution is limited to regions where Lygus have two or more generations per growing season. Before analysis, SQL procedures were developed to set EI values for P. digoneutis to zero for grid cells with fewer than two Lygus generations. The CLIMEX® “Compare Locations” module allows output of annual indices values, including one EI (ecoclimatic index) for each grid cell. Users are able to view weekly output by clicking on individual grid cells on the map display. Analysis of weekly output can be tedious, particularly when modellers are examining output from multiple GCM/emission/timeframe scenarios. A data streaming utility, not yet available in CLIMEX® 3.0 (D.K., personal observation) was used to output weekly data for all grid cells, resulting in 52 records for each grid cell. Six locations were selected to analyse species-specific sensitivity to future climates on both continents. Tours, France (47.42°N, 0.70°E), and Ottawa, Ontario, Canada (45.40°N, 75.70°W), were selected because P. digoneutis is well established in these regions, regulating Lygus populations. Berlin, Germany (52.57°N, 13.39°E) and Saskatoon, Saskatchewan, Canada (52.17°N, 106.67°W) are areas near the northern limit of current distribution or in the case of Saskatoon, near the potential northern limit. Uppsalla, Sweden (59.87°N, 17.58°E) and Peace River, Canada (56.27°N, 117.30°W) are locations well north of current distributions. A geographic rectangle, 2° latitude by 2° longitude was used to delineate a geographic region around each location resulting in 144 grid cells for all locations except Uppsalla, Sweden (n=129). Model output was averaged across each region. These data sets permitted spatial and temporal comparison of variables.
Ecoclimatic index values were displayed in map format with four categories: “unfavourable” (EI=0–5); “suitable” (EI=5–15); “favourable” (EI=15–25); and “very favourable” (EI⩾25).
Results and discussion
Compared to current climate, by 2030 projected changes in P. digoneutis distributions for Europe and North America where shown to shift polewards and to contract from its southern temperature range limits. Similar distribution shifts for North America have been reported for a number of pest insect species including, Contarinia nasturtii (Kieffer) (Diptera: Cecidomyiidae), Sitonia lineatus (Linnaeus) (Coleoptera: Cuculionidae), Melanoplus sanguinipes (Fabricius) (Orthoptera: Acrididae), Oulema melanopus (Linnaeus) (Coleoptera: Chrysomelidae), Brassicogethes viridescens (Fabricius) (Coleoptera: Nitidulidae), and Ceutorhynchus obstrictus (Marsham) (Coleoptera: Curculionidae) (Olfert and Weiss Reference Olfert and Weiss2006b; Mika et al. Reference Mika, Weiss, Olfert, Hallett and Newman2008; Olfert et al. Reference Olfert, Weiss and Kriticos2011, Reference Olfert, Weiss, Turkington, Beckie and Kriticos2012).
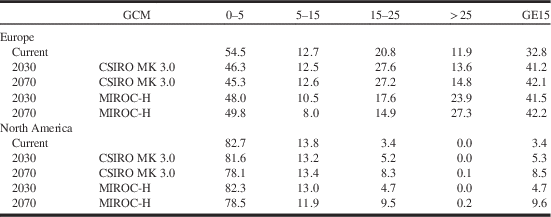
At the continental scale, EI values for P. digoneutis were much higher for Europe than North America for current and future climates (Table 1). Parasitism of Lygus by various species of Peristenus native to the region was found to be much higher in Europe (Day and Hoelmer Reference Day, Hedlund, Saunders and Coutinot2008) than in North America (Craig and Loan Reference Craig and Loan1987; Day Reference Day1987; Broadbent et al. Reference Broadbent, Lachance, Sears and Goulet2006). Based on current climate, 32.8% of Europe was categorised as “favourable” or “very favourable” while 3.4% of North America was categorised as being climatically “favourable” to “very favourable” for P. digoneutis. In Europe between 41% and 42% of the area was projected to have EI>15 by 2030 or 2070. In North America EI values were projected to increase across both time intervals. By 2030, EI values for 2030 were projected to increase to EI=4.7 (MIROC-H) and 5.3 (CSIRO MK 3.0), and EI=9.6 (MIROC-H) and 8.5 (CSIRO MK 3.0) by 2070.
Ecoclimatic Index values (% of total continental area) for Peristenus digoneutis based on current climate (1975H), 2030, and 2070, with two general circulation models (CSIRO MK 3.0 and MIROC-H) for North America and Europe.
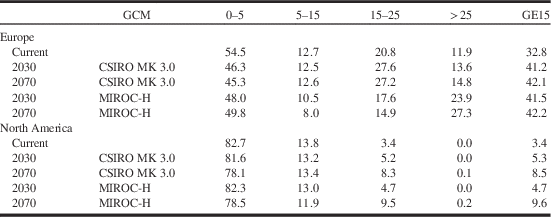
Ecoclimatic index values were presented in four categories: unfavourable (0–5); suitable (5–15); favourable (15–25); very favourable (>25).
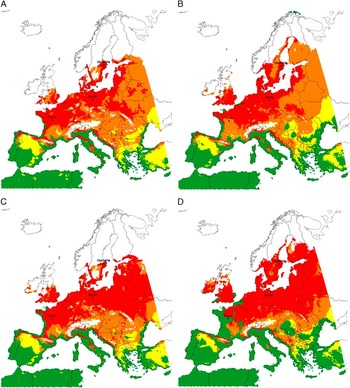
Compared to the 1975 and 2030 time periods, the extent of P. digoneutis range shift in Europe was greatest for the 2070 time period (Figs. 1A, 2A–D). Currently, this species does not presently occur in Denmark, Norway, Sweden, or Finland and Haye et al. (Reference Haye, Olfert, Weiss, Gariepy, Broadbent and Kuhlmann2013) stated that the northern distribution of P. digoneutis is limited by cold stress and by the occurrence of Lygus populations that have only one generation per growing season. An increase of temperature in northern Europe, as predicted by climate change scenarios, would extend the growing season and permit occurrence of two host generations in Scandinavia, allowing P. digoneutis distributions to expand northwards. By 2030, under both GCM scenarios, P. digoneutis could occur in these countries. Results indicated that both GCMs were similar for the Scandinavian countries. MIROC-H projected increased EI values across eastern Europe and Russia whereas the CSIRO MK 3.0 was shown to result in decreased EI values for Ukraine.
Ecoclimatic index values for Peristenus digoneutis based on current climate (1975H) for Europe (A) and North America (B). Ecoclimatic index values were presented in four categories: green=unfavourable (0–5); yellow=suitable (5–15); orange=favourable (15–25); red=very favourable (>25).

Map of ecoclimatic index values for Peristenus digoneutis based on CSIRO MK 3.0 general circulation model projections for Europe for 2030 (A) and 2070 (B) and MIROC-H general circulation model projections for Europe for 2030 (C) and 2070 (D). Ecoclimatic index values were presented in four categories: green=unfavourable (0–5); yellow=suitable (5–15); orange=favourable (15–25); red=very favourable (>25).
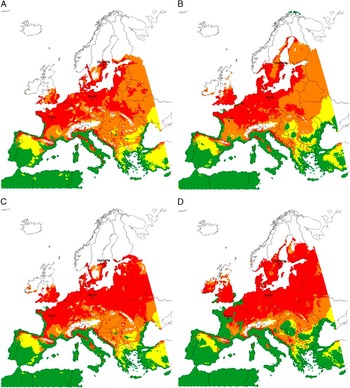
By 2070, both GCM scenarios resulted in further increases in projected potential and EI values in Scandinavia, Ireland, the United Kingdom, Finland, and northern Russia (Figs. 2B–C). The CSIRO MK 3.0 projected that range could increase into northern Sweden and across large areas of Finland. When compared to CSIRO MK 3.0, (2070), MIROC-H projected higher EI values for central Sweden. Compared to 1975 and 2030, EI values were predicted to decrease in a number of countries including Ukraine, Spain, France, as well as regions close to the Black Sea.
In the current study, there were minor predicted distribution shifts between this research and Haye et al. (Reference Haye, Olfert, Weiss, Gariepy, Broadbent and Kuhlmann2013). Slight differences in distribution (e.g., the Netherlands, Germany, Denmark, and Poland) were observed because Haye et al. (Reference Haye, Olfert, Weiss, Gariepy, Broadbent and Kuhlmann2013) used climate data from New et al. (Reference New, Hulme and Jones1999) with a lower resolution (0.5 degree grid) for input into the model, whereas in the current paper climate data sets from Kriticos et al. (Reference Kriticos, Webber, Leriche, Ota, Macadam and Bathols2012) with a 0.1-degree grid resolution were applied.
A slight variance in model output from the two climate data sets (New et al. Reference New, Hulme and Jones1999; Kriticos et al. Reference Kriticos, Webber, Leriche, Ota, Macadam and Bathols2012) was noted. Yonow et al. (Reference Yonow, Zalucki, Sutherst, Dominiak, Maywald and Maelzer2004) reported that model outputs may vary when different climate data sets are used as inputs for the same model. In order to achieve similar output, they suggested that some model parameters may need to be adjusted if the model is applied to different climate data sets. Olfert and Weiss (Reference Olfert and Weiss2006a) noted distribution and relative abundance differences when model output was generated with multiple climate data sets. They modified model parameters for O. melanopus, M. viridescens, and C. obstrictus so that patterns of distribution were similar between data sets for current climate.
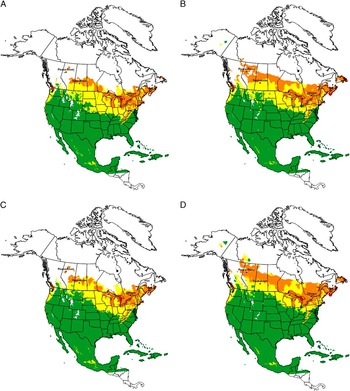
In North America, P. digoneutis distribution and relative abundance was projected to increase across most of the Canadian prairies while distribution was expected to contract across the United States of America (Figs. 1B, 3A–D). Overall, the projected changes in distribution and relative abundance were similar between GCM scenarios. In Canada, the current climate did not result in any regions with EI>25 and only small pockets for 2030. By 2070, both GCM scenarios produced limited areas in eastern Canada of EI>25. In 2030 and 2070, the highest EI values were located along the northern limits of the range of P. digoneutis in Canada. Both GCMs predicted new distributions, with EI values in the “favourable” category, in the Peace River region of Canada.
Map of ecoclimatic index values for Peristenus digoneutis based on CSIRO MK 3.0 general circulation model projections for North America for 2030 (A) and 2070 (B) and MIROC-H general circulation model projections for North America for 2030 (C) and 2070 (D). Ecoclimatic index values were presented in four categories: green=unfavourable (0–5); yellow=suitable (5–15); orange=favourable (15–25); red=very favourable (>25).

In a study of the response of three pest insect species, O. melanopus, M. viridescens, and C. obsrictus, it was found that not all three species responded by extending range north and west in response to warming climates in Canada; species response also varied depending on geographic location (Olfert and Weiss Reference Olfert and Weiss2006b). At a continental scale, M. sanguinipes expanded its range in northern regions of North America and exhibited range contraction in southern regions, in response to climate change (Olfert et al. Reference Olfert, Weiss and Kriticos2011).
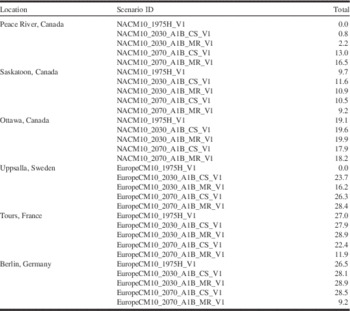
In terms of response to future climate, the range and abundance of P. digoneutis did not change consistently across continents or countries. Locations near the outer limits of the current modelled distribution were more sensitive to changes in future climates than locations near the central core (Table 2). Species-specific response to climatic factors that determine survival and persistence are more variable near the outer limits of the range. Though not currently reported in western Canada, Haye et al. (Reference Haye, Olfert, Weiss, Gariepy, Broadbent and Kuhlmann2013) stated that P. digoneutis would have the potential to occur near Saskatoon, Canada. EI values for this region were projected to be classified as “suitable” (EI between 5 and 15) for current and future climates. Two locations, Peace River, Alberta, Canada, and Uppsalla, Sweden, were selected that are currently north of the current distribution (or predicted). Peace River was classified as “unfavourable” for current and 2030 scenarios. By 2070 under the CSIRO MK 3.0 GCM scenario, climate becomes “suitable” and under the MIROC-H scenario it becomes “favourable”. Uppsalla showed a rapid response to future climate. The average EI for this region was projected to be EI=0 for current climate and “favourable” (2030) to “very favourable” (2070) for both GCM scenarios. Compared to model output for current climate, EI values near Tours, France, remained relatively stable for the 2030 scenarios. By 2070, EI values were predicted to decrease from “very favourable” to “favourable” (CSIRO MK 3.0) to suitable (MIROC-H).
Ecoclimatic index values for Peristenus digoneutis based on current climate (1975H) and general circulation model CSIRO MK 3.0 (CS) and MIROC-H (MR) at three locations in North America and Europe.

Ecoclimatic index values were presented in four categories: unfavourable (0–5); suitable (5–15); favourable (15–25); very favourable (>25). Weekly values were obtained by calculating the average across all grid cells delineated by a geographic rectangle (n=129 grid cells for Uppsalla, Sweden; n=144 grid cells for the remaining locations) for each location, 2° latitude by 2° longitude centred on each location.
Core areas (near the centre of the modelled range) represent regions with minimal or no stress for a species of interest and can vary in EI or GI values. Ottawa, Ontario, Canada, and Berlin, Germany, represented core areas for the range of P. digoneutis. Ecoclimatic index values showed minimal variation as a result of each of the scenarios. Across both 2030 scenarios and the CSIRO MK 3.0 (2070), EI values for Berlin remained in the “very favourable” category; EI values were predicted to decrease to the “suitable” category for the 2070 MIROC-H GCM. Values in Ottawa remained in the “favourable category” for current climate and the four GCMs. Similar results were reported where M. sanguinipes was minimally affected by warmer climates for locations that were near the centre of the modelled range (Olfert and Weiss Reference Olfert and Weiss2006a).
The response of P. digoneutis to future climates, in terms of rate of change in distribution, was greater in Europe than North America. For example, the P. digoneutis currently does not occur north of Kiel, Germany (54.3°N, 10.2°E). By 2030, the northern limit of the range is projected to extend 825 km north to Gavle, Sweden (60.7°N, 17.1°E) and 1420 km north to Lulea, Sweden (65.6°N, 22.1°E) by 2070 (CSIRO MK 3.0). This species is currently established in Ottawa, Ontario, Canada (45.4°N, 75.6°W). Model output using CSIRO MK 3.0 predicted that the distribution would extend 425 km north to 49.2°N (2030) and 650 km north (51.2°N) of Ottawa by 2070 and represents a rate of change that is ~50% less than for Europe. Dispersal distances of 400–1400 km are not unrealistic. The dispersal of P. digoneutis has been monitored since it was first introduced in North America. Initial introductions were made before 1983 near Blairstown, New Jersey (41°N, 74.9°W) (Day et al. Reference Day, Tilmon, Romig, Eaton and Murray2000). In 1999, it was collected 545 km to the north near Kennebec County, Maine, United States of America (Day et al. Reference Day, Tilmon, Romig, Eaton and Murray2000). In 2004 it had been collected 550 km west of Blairstown, New Jersey from Portage County, Ohio, United States of America (Day et al. Reference Day, Romig, Faubert and Tatman2008). Range contractions were predicted to occur in southern regions of both continents. For both 2070 GCM scenarios, the southern distribution shifted north by approximately 370 km (37°N to 40°N). In North America, the CSIRO MK 3.0 (2070) scenario resulted in a range shifted 530 km north from Tennessee, United States of America (35°N) to central Ohio (40°N). The MIROC-H (2070) scenario resulted in a shift of 740 km to northern Ohio/southern Michigan (41.6°N). Comparisons are more difficult in North America because P. digoneutis is still expanding its range under current climate, whereas in Europe its distribution is stable. Haye et al. (Reference Haye, Olfert, Weiss, Gariepy, Broadbent and Kuhlmann2013) reported that the northward range extension of this species was limited by the occurrence of two or more generations of its host, Lygus, and that this factor was more significant than accumulation of cold stress during the winter months. In Saskatchewan, Lygus was predicted to have two generations south of 50°N latitude. Although P. digoneutis has not been collected from Lethbridge, Alberta, Canada (49.7°N, 112.8°W), it has been reported that two generations of Lygus do occur in this area (Salt Reference Salt1945).
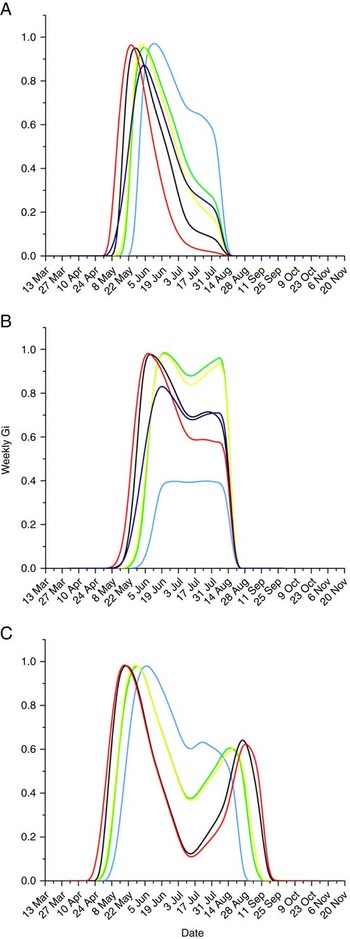
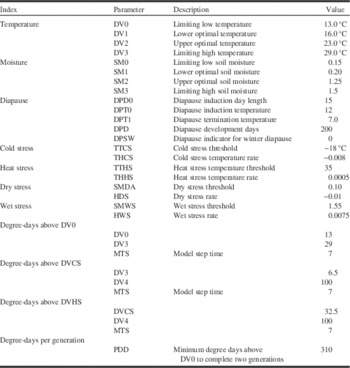
The “compare years” (CLIMEX® 3.0) module provides modellers with a method to analyse weekly indices including Temperature (TI), moisture (MI), diapause (DI), weekly growth (GIw), and stress indices for both current and future climates. Weekly growth (GIw) describes the suitability of climate for species survival, development, and reproduction on a weekly basis. Examination of GIw values permitted analysis of species response to predicted future changes in temperature and precipitation and an understanding of how GIw may be affected by climate (Figs. 4A–C). Specifically, P. digoneutis distribution and abundance response to future climates was both geographically and temporally specific. Outputs from the GCM analyses were compared to analyse GIw values for each of the six locations. A subset of monthly data (April–October) was selected to represent the period in which P. digoneutis was active in the field. Weeks where GIw>0 provided an indication of the length of the growing season that resulted in P. digoneutis growth. Annual GI values (GIa) increased with earlier, longer growing seasons, which resulted in potential for two or more generations per growing season. Temperature indices reflect species responses to fluctuating maximum and minimum temperatures. The lower temperature threshold for metabolic activity, based on oxygen consumption, is 13 °C (Haye et al. Reference Haye, Olfert, Weiss, Gariepy, Broadbent and Kuhlmann2013). As a result, growth and development of P. digoneutis does not begin until temperatures exceed DV0=13 °C (Table 3). Warmer spring temperatures result in earlier spring activity. At Saskatoon, the limiting low temperature did not exceed 13 °C until the last week of May, and was almost three weeks later than for 2070 MIROC-H. Although the growing season was longest for 2070 MIROC-H, GIw values were much lower than the other GCM scenarios during June and July resulting in a lower EI value.
Weekly growth index (GIw) for Peristenus digoneutis based on current climate and general circulation model projections for Saskatoon, Canada (A), Peace River, Canada (B), and Ottawa, Canada (C). Weekly values were obtained by calculating the average across all grid cells (n=144) delineated by a geographic rectangle, 2° latitude by 2° longitude centred on Saskatoon, Canada. General circulation models: blue – current climate (1975H); green – CSIRO MK 3.0 2030; yellow – MIROC-H 2030; black – CSIRO MK 3.0 2070; red – MIROC-H 2070.

Values for parameter settings for the CLIMEX® model projecting Peristenus digoneutis distribution in Canada (Haye et al. Reference Haye, Olfert, Weiss, Gariepy, Broadbent and Kuhlmann2013).

Examination of GIw output indicated that longer growing seasons would occur as a result of warmer summers in future climates. In some cases, the positive aspect on longer growing seasons was negated by summer temperatures that were too warm. At Saskatoon, excessively warm weeks in July and August resulted in reduced growth rates (Fig. 4A). These results agree with observations that southern distributions in the United States of America have been limited by high summer temperatures (Day et al. Reference Day, Tilmon, Romig, Eaton and Murray2000). At Peace River, the 2070 growing seasons were predicted to be two weeks longer than for 2030 and resulted in EI values categorised as “suitable” (CSIRO MK 3.0) or “favourable” (MIROC-H) (Fig. 4B). For Peace River, GIa values steadily increased from 1975 to 2030 to 2070, with minimal differences between GCMs, for the same time period. EI values did not increase to the “suitable” or “favourable” categories until 2070. The increase in EI was attributed to both longer growing season and favourable temperatures during all weeks of the growing season. At Ottawa, although growing seasons were projected to be longer, results indicated that excessive heat during July resulted in lower GIw values (Fig. 4C). Increased temperatures in future climates result in the P. digoneutis model responding to temperature values that exceed DV2 (upper optimum temperature threshold) and DV3 (upper temperature threshold). Monthly average maximum values were compared due to the fact that weekly maximum values are limiting when Tmax (weekly) is greater than DV2 (23 °C) and DV3 (29 °C). At Tours, France, MIROC-H for 2070 predicted temperatures would be warmer than DV2 (23 °C) for 16 weeks of the year. This can be compared to the 1975H data set that predicted nine weeks with temperatures greater than DV2. This resulted in reduced GIw values from late May until early September for 2070. GIw values for 2030 were similar for the two GCMs. However, by 2070 MIROC-H predicted GIw=11.9, compared to GIw=22.4 using the CSIRO MK 3.0 scenario. Model output using MIROC-H, resulted in low EI values being categorised as unfavourable (0–5), due to excessively high growing season temperatures for 2070.
Analysis of P. digoneutis response to future climates was conducted for both spatial (continental and regional) and temporal (annual and weekly) scales. Though species distribution and abundance has been shown to change at a continental or country scale, responses are often observed at regional scales (Olfert and Weiss Reference Olfert and Weiss2006a; Olfert et al. Reference Olfert, Weiss and Kriticos2011). Species response has been shown to result in not only increased EI but also reductions in EI with the same future climatic conditions (Olfert and Weiss Reference Olfert and Weiss2006b; Mika et al. Reference Mika, Weiss, Olfert, Hallett and Newman2008). Mika et al. (Reference Mika, Weiss, Olfert, Hallett and Newman2008) reported that predicted changes for distribution and abundance of C. nasturtii varied, based on GCM, and they suggested that multiple GCMs should be used when assessing the sensitivities of the biophysical system that we are hoping to manage, in relation to climate change. Results of our study indicated that distribution and relative abundance changes were greater between time periods than between GCMs (Figs. 1–3).
Conclusions
The study suggested that the responses of P. digoneutis population distribution and abundance to future climates were both geographically and temporally specific. Compared to current climate, projected changes in P. digoneutis distributions by 2030, for both Europe and North America, where shown to shift north and contract on the southern limits of the current range. By 2070, the study predicted further increases in distribution and EI values in Scandinavia, Ireland, the United Kingdom, Finland, and northern Russia. In North America, P. digoneutis distribution and relative abundance was projected to increase across most of western Canada while distribution was expected to diminish across the United States of America. However, P. digoneutis range and abundance did not change consistently across continents or countries. Locations near the outer limits of the current modelled distribution were more sensitive to changes in future climates than locations near the central core. Having access to weekly growth index values (GIw) permitted a unique analytical approach to the analyses of a species response to future changes in temperature and precipitation. Analysis of weekly growth responses of P. digoneutis provided indications of when the species became active in the spring, and when mid-summer temperatures limited the potential for population growth. Weeks with temperatures greater than DV2 reduced weekly growth rates.
The capacity of P. digoneutis to increase its geographical distribution following a change in climate will be limited by how its host reacts to these changes. Climate change is predicted to increase EI values for its host, making the northern latitudes in North America more favourable for multiple Lygus generations per year. Consequently, this would increase chances to permanently establish P. digoneutis in areas such as the prairie ecozone of western Canada, where Lygus cause significant economic problems, but biological control programmes had failed to establish the parasitoid in the past (Broadbent et al. Reference Broadbent, Gariepy, Haye and Kuhlmann2013).
Acknowledgements
This paper is dedicated to the memory of Dr. Robert W. Sutherst. D. Giffen is gratefully acknowledged for preparation of the maps. Funding for the project was provided by Agriculture and Agri-Food Canada, CABI Europe – Switzerland and by the Organisation for Economic Co-operation and Development, Co-operative Research Programme.