


INTRODUCTION
The mass public’s evaluation of elected officials’ performance at the ballot box forms a cornerstone of democratic accountability (Ashworth Reference Ashworth2012; Healy and Malhotra Reference Healy and Malhotra2013). It facilitates the selection of competent leaders (Fearon Reference Fearon, Przeworski, Stokes and Manin1999) and enables the public to incentivize politicians by rewarding strong performance (Ferejohn Reference Ferejohn1986). An important element of this retrospective voting is that voters should reward elected officials for strong economic performance and punish them for a weak economy. Thus, understanding whether voters judge politicians for economic performance is crucial for any assessment of representative democracy (e.g., Key Reference Key1966).
A simple view of retrospective voting, however, belies the complex way accountability operates in a federal system. Multiple levels of government could influence the economy, and voters might reward or punish any combination—or none—of them for economic performance. Furthermore, voters might attribute responsibility for the economy to any of those levels of government and reward or punish candidates at other levels of government based on their partisan connections to the level of government they perceive as responsible. Answering empirical questions about economic voting may therefore yield a nuanced picture of accountability.
Past studies have found that the incumbent president’s party’s vote share in presidential and Congressional elections is correlated with national economic conditions (Erikson Reference Erikson1989; Kramer Reference Kramer1971; Markus Reference Markus1988; Tufte Reference Tufte1978). Several recent articles have also provided evidence of accountability for the local economy in presidential elections (Cottrell, Herron, and Westwood Reference Cottrell, Herron and Westwood2018; Healy and Lenz Reference Healy and Lenz2017; Hill, Herron, and Lewis Reference Hill, Herron and Lewis2010).Footnote 1 But there has been little research about whether voters hold incumbent officeholders at other levels of government accountable for the local economy. Indeed, the small literature on retrospective voting in gubernatorial elections has demonstrated a limited or contingent impact of the economy on voting patterns (e.g., Ebeid and Rodden Reference Ebeid and Rodden2006; Peltzman Reference Peltzman1987; Wright Reference Wright2012). There has also been little research focused on the degree to which the president’s party is held accountable in subnational elections relative to the party of downballot incumbents. Given the centrality of retrospective voting for democratic accountability, it is important to understand whether Americans hold elected officials accountable for the economy at all levels of government—as well as which incumbent’s party is held accountable.
In this study, we conduct the first holistic evaluation of retrospective voting for the local economy across all levels of government in the United States. We examine whether voters reward and punish elected officials for the performance of the economy in elections for President, Senate, House, governors, downballot state offices, state legislatures, and local offices. We also assess whether this reward and punishment is tied to the party of the president or the party of downballot incumbents. This allows us to adjudicate between theories of president-centric or downballot-centric incumbent accountability. Our analysis is built on fine-grained administrative data on the local economy. We combine these data with election results measured at the county level in federal, state, and county elections. With this rich dataset in hand, we utilize a variety of time-series, cross-sectional (TSCS) models (Angrist and Pischke Reference Angrist and Pischke2009) to estimate the causal effects of the economy on voting.
First, we examine economic accountability for the president’s party in federal, state, and local elections. We find strong evidence that voters are responsive to the condition of the economy when voting in both federal and state elections. However, the size of this effect is relatively modest. A one standard deviation increase in local wage growth leads to between a quarter and a half of a percentage point boost for the president’s party. This effect is very consistent across presidential, House, Senate, gubernatorial, and state house elections. We also find substantively similar, although statistically insignificant, point estimates of accountability in local elections, although our evidence is limited by the relatively small set of county elections for which data exist. This supports theories of strong partisan linkages across levels of government and a president-centric view of economic accountability, even in subnational elections.
Next, we examine whether voters judge downballot incumbents for the performance of the economy. For instance, do voters reward or punish the party of their current representative in Congress based on the conditions of the economy when voting in Congressional elections? We find that the governor’s party is held accountable in gubernatorial elections. We also find that House candidates are punished or rewarded based on the party that controls their seat. However, we find more mixed evidence for the U.S. Senate and state legislatures. This suggests limitations to accountability for downballot incumbent officeholders.
Finally, we examine two potential moderators for accountability: whether accountability has changed over time, perhaps because of the increasingly nationalized nature of elections in the United States (Donovan et al. Reference Donovan, Kellstedt, Key and Lebo2019; Hopkins Reference Hopkins2018), and whether the media influences accountability for local economic conditions. We find no clear evidence that retrospective voting has changed over time as elections have grown more nationalized. Although there are a variety of theoretical reasons to believe that media coverage of the local economy facilitates accountability (e.g., Hayes and Lawless Reference Hayes and Lawless2015; Snyder and Strömberg Reference Snyder and Strömberg2010), we also find only suggestive evidence that newspapers influence retrospective voting in elections.
Overall, our findings show that the local economy matters in both national and subnational elections. Moreover, economic voting in state and local elections is more similar to economic voting in presidential elections than scholars have previously thought. The president’s party is rewarded and punished for the economy in presidential as well as subnational elections. This suggests that there are electoral incentives for national, state, and local politicians from the president’s party to pursue policies that grow the economy. This has implications for literatures on distributive politics and legislative politics (e.g., Dynes and Huber Reference Dynes and Huber2015; Kriner and Reeves Reference Kriner and Reeves2015). Our findings also indicate that subnational officeholders, and candidates from the parties of subnational incumbents, generally have an incentive to grow the economy. In particular, incumbent governors and U.S. House representatives may increase their electoral success by focusing on economic policy levers. Moreover, these results suggest that voters assign responsibility in a nuanced way: to the president, and to downballot incumbents in limited circumstances. This speaks to a growing literature arguing that voters’ decisions in subnational elections are shaped by forces of nationalization—that is, that voters make decisions at a subnational level based on their attitudes about national politics.
The paper proceeds as follows. First, we briefly review the background literature on economic voting, and particularly on local economic voting. Second, we discuss our theoretical expectations. Next, we discuss our data and research design, and then our main results. We then present results showing the relative stability in economic accountability across time periods and media environments. Finally, we briefly conclude and discuss the implications of our findings for democratic accountability.
ECONOMIC VOTING IN MULTILEVEL ELECTIONS
Theories of retrospective voting predict that voters should hold both incumbents and candidates from the incumbent party accountable for economic performance (e.g., Fiorina Reference Fiorina1981). This expectation is defined by Fiorina (Reference Fiorina1978) as “whether responsible or not, does the administration prosper in good times and suffer in bad times” (430). A large empirical literature in line with these expectations has shown that the incumbent party’s vote share in Congressional and presidential elections is correlated with macrolevel economic conditions (e.g., Erikson Reference Erikson1989; Fair Reference Fair1978; Kramer Reference Kramer1971; Markus Reference Markus1988).Footnote 2 These studies find that “citizen[s] vote for the government if the economy is doing all right; otherwise the vote is against” (Lewis-Beck and Stegmaier Reference Lewis-Beck and Stegmaier2000).Footnote 3
Much of this research, however, ignores the fact that multilevel elections in the United States make for complex representation and therefore complex accountability. Although the incumbent president’s party might be an easy target for credit or blame, voters are also represented by politicians in Congress, governors, state legislators, and a host of local elected officials. Whereas parties may form coalitions and coordinate across levels of government (Aldrich Reference Aldrich1995), voters might be represented by a different party at the national level than at the state or local level—or perhaps by no party at all in many local nonpartisan elected offices. Recent research on subnational politics indicates that state and local leaders may indeed affect policy (e.g., Caughey, Warshaw, and Xu Reference Caughey, Warshaw and Xu2017; de Benedictis-Kessner and Warshaw Reference de Benedictis-Kessner and Warshaw2016, Reference de Benedictis-Kessner and Warshaw2020). But in a federal system of government as in the United States, such subnational governments are often constrained in their policymaking relative to the national government. This makes it less clear which incumbent’s party would be associated with the performance of the economy. If politics at the state and local levels is more nationalized, then the incumbent president’s party’s performance might matter for subnational election outcomes, but otherwise might not (Hopkins Reference Hopkins2018; Morgenstern, Smith, and Trelles Reference Morgenstern, Smith and Trelles2017; Rogers Reference Rogers2016). Normative theories of accountability suggest that, if subnational governments do indeed influence economic performance, incumbents at these levels of government should be held accountable for the condition of the economy as well.
Moreover, the performance of the economy is not uniform across geography (Cho and Gimpel Reference Cho and Gimpel2009). Although the economy might be booming at the national level, the economy in certain regions or industries might be declining. This can lead to vast differences in the meaning of economic performance for people who live in different areas. This presents measurement problems in a theory of economic voting. First, it is unclear which geographic aggregation of economic performance should affect people’s judgments of incumbents. Economic performance could be measured at a national, state, county, or personal household level—or even as relative performance based on the difference between any two of these levels. Research on economic voting has advanced both sociotropic (e.g., Fair Reference Fair1978; Kinder and Kiewet Reference Kinder and Kiewiet1979) and egotropic (e.g., Fiorina Reference Fiorina1978; Tufte Reference Tufte1978) theories, as well as theories positing a mixture of the two phenomena (Ansolabehere, Meredith, and Snowberg Reference Ansolabehere, Meredith and Snowberg2014). Second, it is unclear which geographic level of economic performance does actually form people’s perceptions of the economy.Footnote 4 Although the national economy might be an easy cue to pick up from national news media, people might also make judgments about economic performance based on cues that are closer to home, such as county- or state-level economic performance, or their own personal finances over time.Footnote 5
For a number of decades, there was a debate in political science and political economy about whether voters held presidential candidates accountable for local economic conditions (Eisenberg and Ketcham Reference Eisenberg and Ketcham2004; Gosnell and Colman Reference Gosnell and Colman1940; Hill, Herron, and Lewis Reference Hill, Herron and Lewis2010; Wright Reference Wright2012). However, as Healy and Lenz (Reference Healy and Lenz2017) show, the mixed results in previous studies on the effect of the local economy were largely caused by a reliance on sample-based measures of economic performance. For instance, many studies rely on estimates of county-level unemployment from the Bureau of Labor Statistics (e.g., Wright Reference Wright2012), which are primarily based on the Current Population Survey. Healy and Lenz (Reference Healy and Lenz2017) point out that sampling error in these unemployment estimates “can cause a county-level unemployment change to deviate from the truth by several percentage points.” The large measurement error in these estimates of unemployment can attenuate estimates of accountability. Healy and Lenz examine the effect of the mortgage crisis in 2008 in California, as well as the effect of changes in wages and employment at the county level from 1990 to 2016 using population-based datasets that are not susceptible to sampling error. They find strong evidence that voters hold the president’s party accountable for local economic conditions in presidential voting.
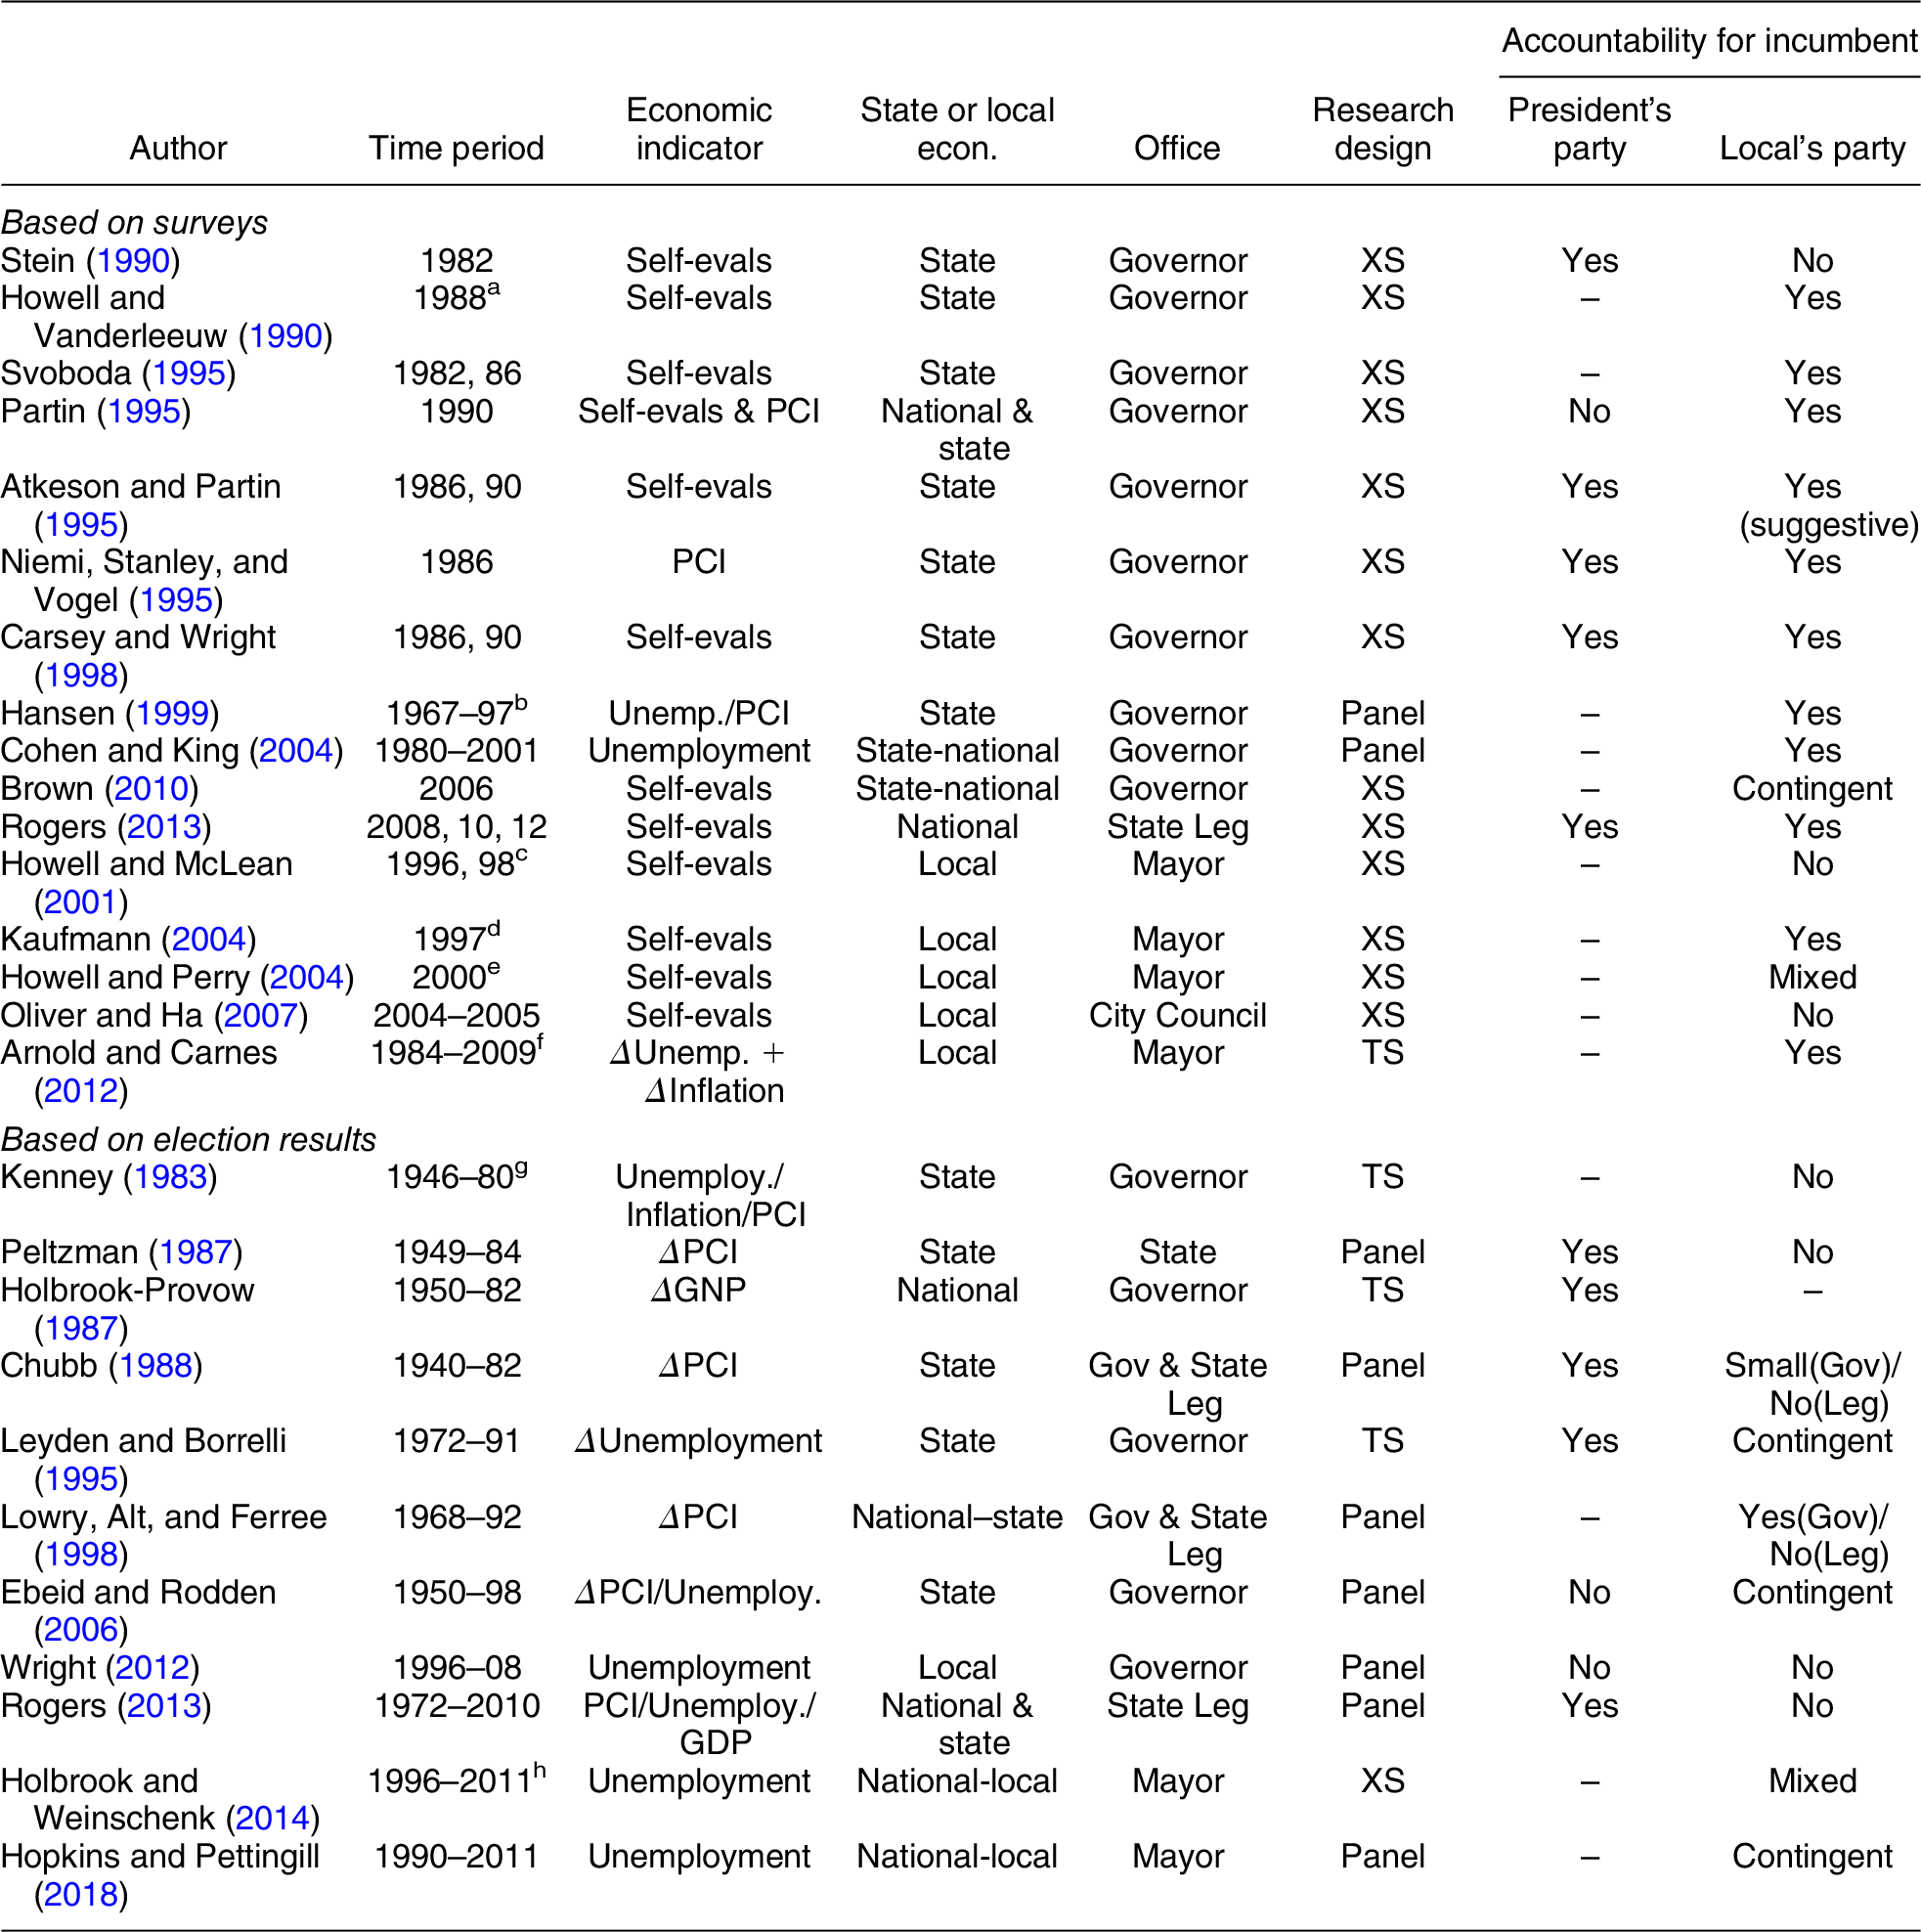
Despite the consensus about the importance of economic voting in the literature on presidential elections at the national level, there has been no clear consensus about whether voters hold subnational politicians accountable for economic conditions (see Table 1). For instance, a number of studies have examined the role of the economy in gubernatorial elections. Some cross-sectional studies based on surveys find that strong evaluations of the state economy (Atkeson and Partin Reference Atkeson and Partin1995; Carsey and Wright Reference Carsey and Wright1998; Howell and Vanderleeuw Reference Howell and Vanderleeuw1990; Stein Reference Stein1990) or state-level personal income growth (Niemi, Stanley, and Vogel Reference Niemi, Stanley and Vogel1995) help the party of the incumbent governor. Others find contingent effects. But the findings in all of these studies could be confounded by the endogeneity between vote choice and economic evaluations, as well as omitted variable bias. In contrast to the survey-based studies, recent studies using electoral data generally find little evidence of accountability in gubernatorial elections for economic performance at either the state (Ebeid and Rodden Reference Ebeid and Rodden2006) or local levels (Wright Reference Wright2012, 695).Footnote 6 The findings in past studies on the role of the economy in gubernatorial elections could be attenuated, however, because of measurement error in their sample-based data on economic conditions (Healy and Lenz Reference Healy and Lenz2017).Footnote 7 In addition, Wright (Reference Wright2012) focuses on a very short time frame (1996–2008). So, overall, it remains unclear whether gubernatorial candidates are held accountable for economic performance.
Previous Studies on Economic Accountability in Subnational Elections

a Howell and Vanderleeuw (Reference Howell and Vanderleeuw1990) use survey data from Louisiana voters only.
b Hansen (Reference Hansen1999) uses survey data from CA 1967–97 and seven other states 1980–97.
c Howell and McLean (Reference Howell and McLean2001) use two survey samples from New Orleans.
d Kaufmann (Reference Kaufmann2004) uses exit poll data from New York City.
e Howell and Perry (Reference Howell and Perry2004) use survey samples from four cities.
f Arnold and Carnes (Reference Arnold and Carnes2012) use a series of surveys from New York City.
g Kenney (Reference Kenney1983) uses a panel of 14 states.
h Holbrook and Weinschenk (Reference Holbrook and Weinschenk2014) use data from 441 elections in 139 large cities.
There is also no consensus on retrospective voting in local elections. The urban politics literature often highlights economic development as a critical feature of performance on which local leaders are held accountable (Logan and Molotch Reference Logan and Molotch1987; Stone Reference Stone1989). But the empirical literature has yielded inconsistent and often contingent findings (e.g., Arnold and Carnes Reference Arnold and Carnes2012; Hopkins and Pettingill Reference Hopkins and Pettingill2018; Howell and McLean Reference Howell and McLean2001; Howell and Perry Reference Howell and Perry2004; Kaufmann Reference Kaufmann2004; Oliver and Ha Reference Oliver and Ha2007).Footnote 8
THEORETICAL EXPECTATIONS
Much of the research in this literature presents clear expectations for economic voting. An established body of theoretical and empirical work demonstrates that voters in presidential elections respond to economic performance. More recent research suggests that many of the mechanisms of accountability at the national level may function similarly at subnational levels (Trounstine Reference Trounstine2010; Warshaw Reference Warshaw2019). Candidates at the national, state, and local levels of government all claim credit for economic performance. This line of reasoning suggests that voters might also make electoral choices at each of these levels based on economic conditions.Footnote 9 We focus on two major theories of accountability for the local economy in this article, each with their own empirical predictions.
A “president-centric” or nationalized view would predict that voters will hold the president’s party accountable at all levels of elections. In other words, candidates from the president’s party may be rewarded for strong local economic performance and punished for weak performance. Recent research has shown that state elections are increasingly nationalized (Hopkins Reference Hopkins2018; Rogers Reference Rogers2016). For instance, national and state election results are increasingly correlated with each other, potentially because of an increase in straight-ticket voting (Abramowitz and Webster Reference Abramowitz and Webster2016). There is also abundant anecdotal evidence for this view. For instance, following the Great Recession during the Obama presidency, Democratic governors were much more likely to lose reelection in 2010 than their Republican counterparts—a pattern of Democratic candidates under a Democratic president performing badly in elections when the economy is doing worse.Footnote 10 This evidence supports a nationalized theory of subnational politics and a model of partisan accountability dependent on strong partisan ties across levels of government and large divisions between parties along national lines. It suggests that voters may reward and blame the party of the president across offices.
Alternatively, a “state-centric” or local view would predict that voters are likely to hold the current incumbent in an office accountable for local economic policies and outcomes. Recent research suggests that shifts in the partisan control of state and local offices after elections can lead to consequential changes in policy (e.g., Caughey, Warshaw, and Xu Reference Caughey, Warshaw and Xu2017; de Benedictis-Kessner and Warshaw Reference de Benedictis-Kessner and Warshaw2016, Reference de Benedictis-Kessner and Warshaw2020). Voters might therefore rationally associate incumbent subnational candidates with past performance. Moreover, voters might associate policies not merely with the current incumbent but with their party as well (Ebeid and Rodden Reference Ebeid and Rodden2006). Under this view, for example, gubernatorial candidates from the governor’s party would be rewarded for strong economic performance and punished for weak performance. Similarly, local candidates from the current local incumbent’s party would be rewarded or punished for economic conditions.
DATA AND RESEARCH DESIGN
To evaluate retrospective voting in presidential, gubernatorial, and local elections, we built a panel dataset of election returns and economic conditions at the county level. This dataset is broad in temporal and geographic scope, and incorporates precise measures of economic conditions, which, alongside a credible research design, allows us the statistical power to test for the causal effect of changes in the local economy.
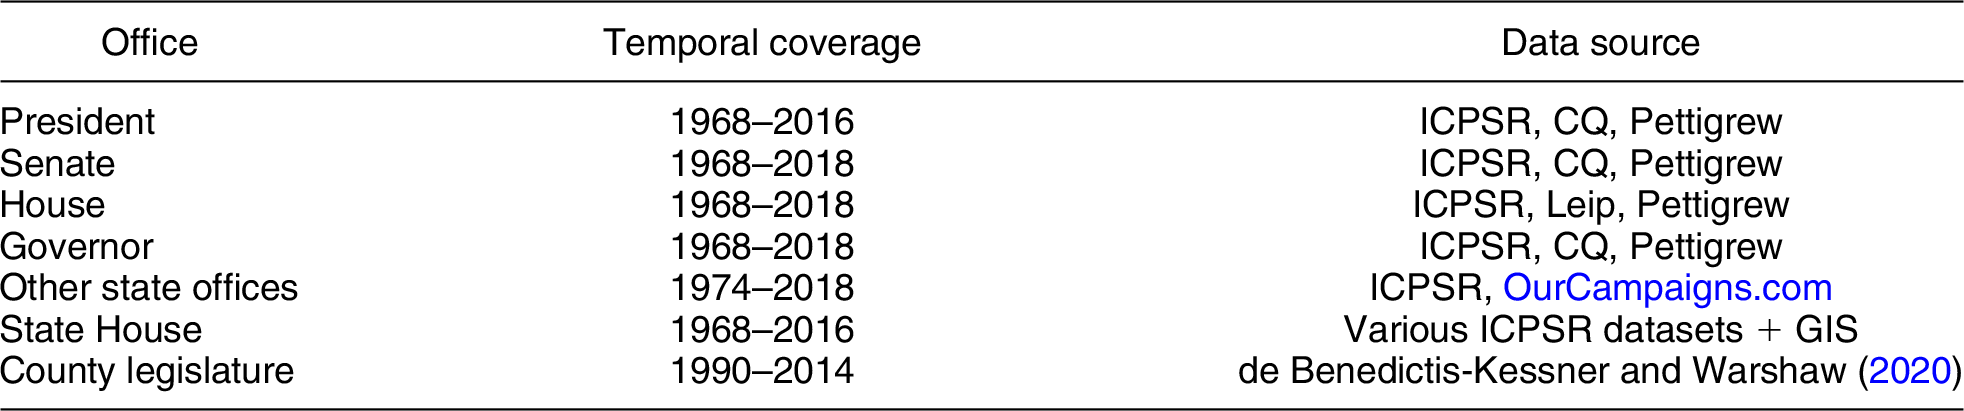
We assembled national, state, and local election results from 1968 to 2018 using a variety of sources (see Table 2 and Online Appendix A). For national elections between 1970 and 1990, we use the General Election Data for the United States, 1950–90 hosted by the ICPSR (ICPSR 2006, 2013). For presidential, senate, and gubernatorial elections between 1990 and 2014, we use data from CQ’s Voting and Elections Collection. For House elections during this period, we use data from the Atlas of U.S. Elections (Leip Reference Leip2016). For other state offices (e.g., attorney general, secretary of state, and treasurer), we use crowd-sourced data from OurCampaigns.com. For state legislative elections, we match state legislative district results to counties (Klarner Reference Klarner2018).Footnote 11 We use county-level data that Stephen Pettigrew assembled for presidential, senate, house, and gubernatorial election results in 2016 and 2018 (Pettigrew Reference Pettigrew2017). For local elections, we use data from de Benedictis-Kessner and Warshaw (Reference de Benedictis-Kessner and Warshaw2020) on county legislative elections from 1990 to 2014. We also use data on the incumbent governor in each state/year from 1970 to 2014, which we obtained from Klarner (Reference Klarner2015) and updated through 2016, as well as data on the county legislative majority from de Benedictis-Kessner and Warshaw (Reference de Benedictis-Kessner and Warshaw2020).
Data Sources
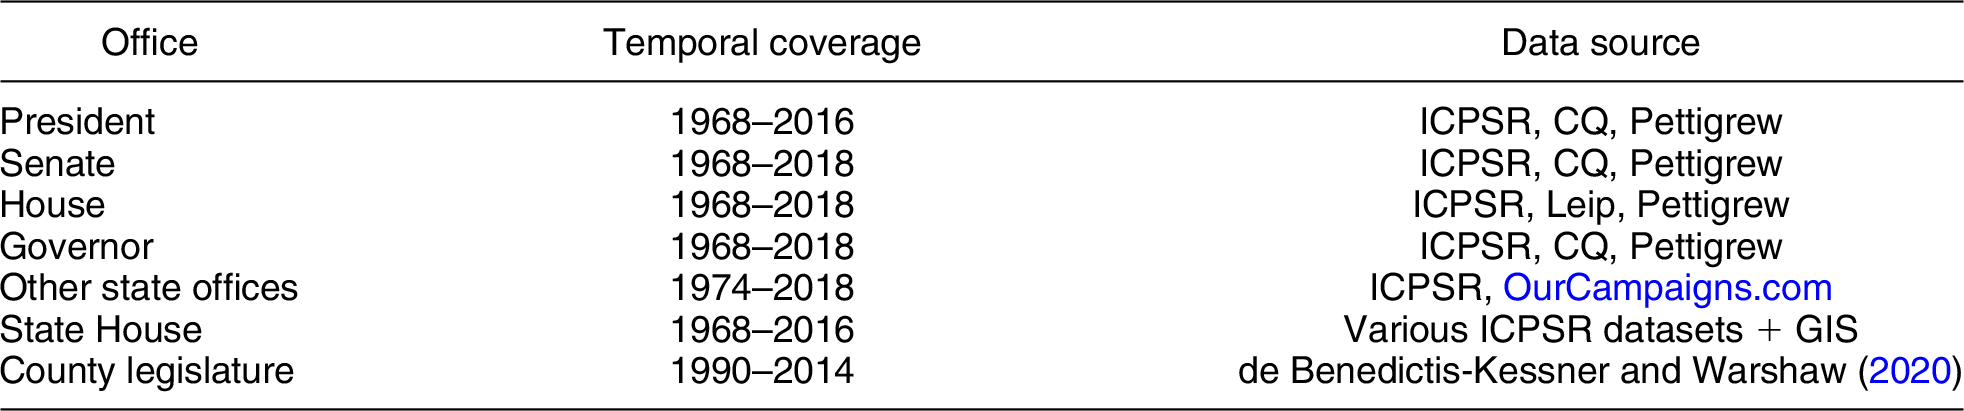
The main independent variable in our analysis is the change in wages per worker in each county between yeart and yeart−1.Footnote 12 Previous work in political science has commonly used sample-based measures of economic conditions, such as those based on the Current Population Survey. By contrast, following recent work by Healy and Lenz (Reference Healy and Lenz2017), we measure changes in the local economy using a dataset with annual measures of county-level economic conditions from 1969 to 2018 based on the population of business establishments in the United States: the Bureau of Economic Advisors’ (BEA) Local Area Personal Income and Employment data.Footnote 13 We interact this variable with a binary indicator for whether the incumbent is a Democrat. However, the results are robust to other coding decisions.
To estimate the causal effect of changes in local economic conditions, we estimate a series of panel models using the following equation:
 $$\Delta DemVotePc{t_{it}} = \alpha \Delta Wages + \beta \Delta Wages\; \times \;DemInc + {\gamma _i}\; + \;{\tau _{st}}.$$
The dependent variable is the change in the Democratic candidate’s share of the two-party vote for each office in every county between the current election and the most recent election for that office (ΔDemVotePct it).Footnote 14 To examine partisan accountability in these models, we assess the effect of economic performance (ΔWages) on vote share differentially by interacting this measure with an indicator for a Democratic incumbent. The base effect of ΔWages, α, is therefore the effect of wage growth on the change in Democratic vote share under a Republican incumbent (Brambor, Clark, and Golder Reference Brambor, Clark and Golder2006). The effect of wage growth under a Democratic incumbent is the base effect of the economy added to the interaction effect (i.e., α + β). Meanwhile, our main quantity of interest is the coefficient on the interaction term, β, which represents the difference in the effect of the economy when there is a Democratic incumbent compared with when there is a Republican incumbent.Footnote 15
In subsequent models, we also interact economic performance with an indicator for the party of the incumbent local officeholder in that county. The party of the incumbent representing each county is relatively straightforward to calculate for the offices of Governor and U.S. Senator. For the county legislature, we use an indicator for the county legislative majority, as we do not have subcounty electoral data. For the U.S. House and both state legislative chambers, we calculate the percentage of each county represented by a Democratic representative in each of these offices.Footnote 16 This allows us to assess economic accountability for the incumbent party holding those subnational offices. We hypothesize that Democratic candidates should be rewarded for growth when there is a Democratic incumbent, whether that is at the presidential level or the level at which they cast their vote for governor/county legislator, and Republican candidates should be rewarded when there is a Republican incumbent.
Our main models use county fixed effects, represented by γ i, to account for time-invariant confounders in each county, and state-year fixed effects, represented by τ st, to control for time-varying confounders at the state and national levels (Fowler and Hall Reference Fowler and Hall2018).Footnote 17 Given that our outcome and treatment variables are both first-differenced, the county fixed effects mean that our models are controlling for long-term trends in the economy and election results in each county. The state-year fixed effects mean that our analyses are comparing the changes over time in counties with greater wage growth to the changes over time in counties with lower wage growth in the same state (Hall, Yoder, and Karandikar Reference Hall, Yoder and Karandikar2019). The estimand in these models represents the effect of changes in economic growth relative to the typical economic growth in the county, compared with the counterfactual changes in economic growth in other counties in the state, on the change in vote share in a county relative to typical changes in vote share in that county. Although this estimand differs from that implied by more traditional models using levels of economic conditions or levels of vote share, it represents the effect of economic conditions on vote patterns that we are able to causally identify.Footnote 18
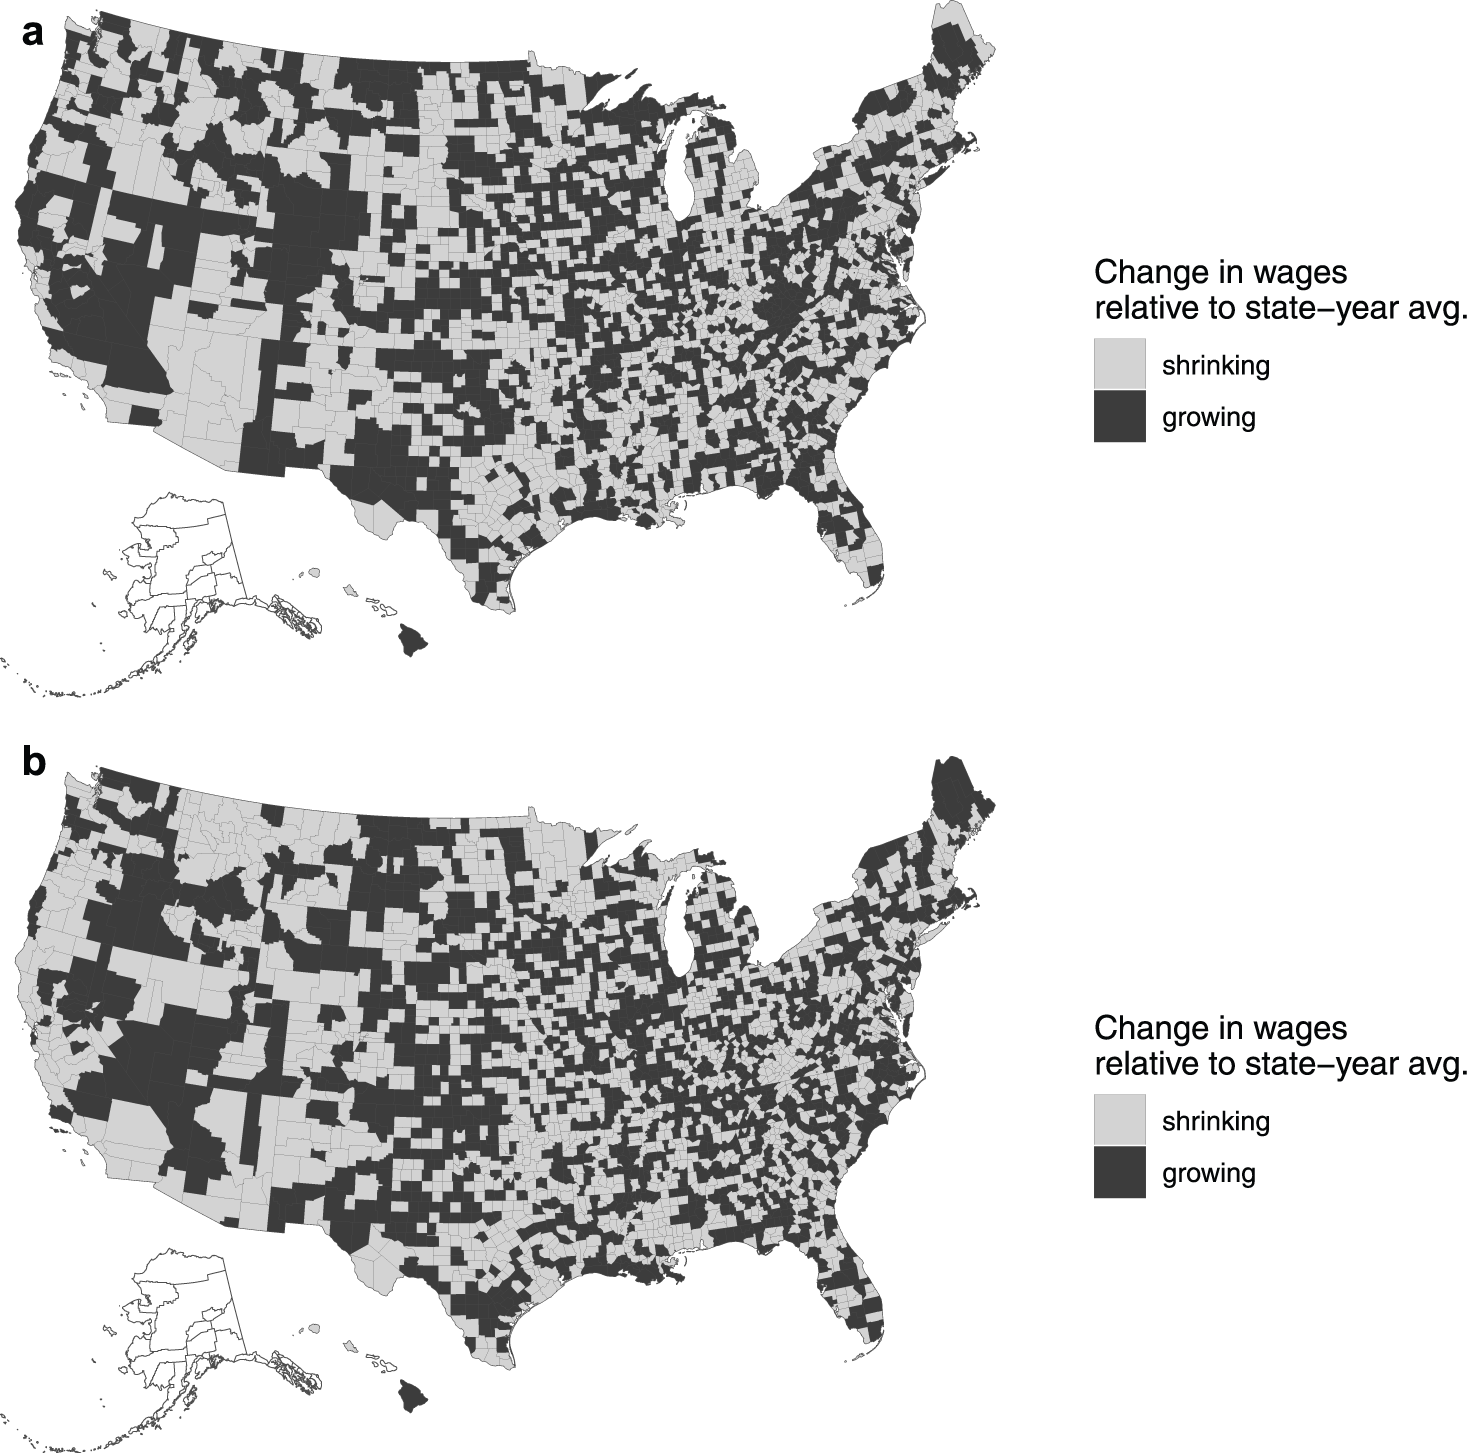
This specification gives us well-identified variation in our independent variable, allowing us the causal leverage to assess the impact of economic performance.Footnote 19 This leverage stems from the fact that there is a great deal of variation in local economic conditions across geography and time. By way of example, we show these changes within county and across years in Figure 1. Each map shows all counties’ change in economic conditions relative to the average in their state and year, in 2008 (1a) and 2012 (1b).
Change in Economic Conditions in 2008 (a) and 2012 (b)

Finally, our main models focus on counties with more than 20,000 people.Footnote 20 This approach reduces the sensitivity of our results to small counties, which often have volatile economic statistics and therefore might introduce measurement error. It also captures the political reality that politicians generally care more about counties with large populations than ones with small numbers of voters. However, we obtain substantively similar results in models that include all counties, but weight by population (Section 5.2).
MAIN RESULTS
In this section, we discuss our main results. First, we examine accountability for the president’s party in federal, state, and local elections. We also show the robustness of our main results to a variety of plausible, alternative model specifications. Last, we examine accountability for the party that controls other offices.
Accountability for President’s Party
We first examine accountability for the president’s party in federal, state, and local elections. Each model uses the specification described above and in equation (1). The main quantity of interest to assess accountability is the interaction between our measure of economic performance and the indicator for a Democratic incumbent. This interaction measures the degree to which economic performance affects the vote share of candidates from the Democratic party when the presidential incumbent is also a Democrat relative to when the incumbent is a Republican.
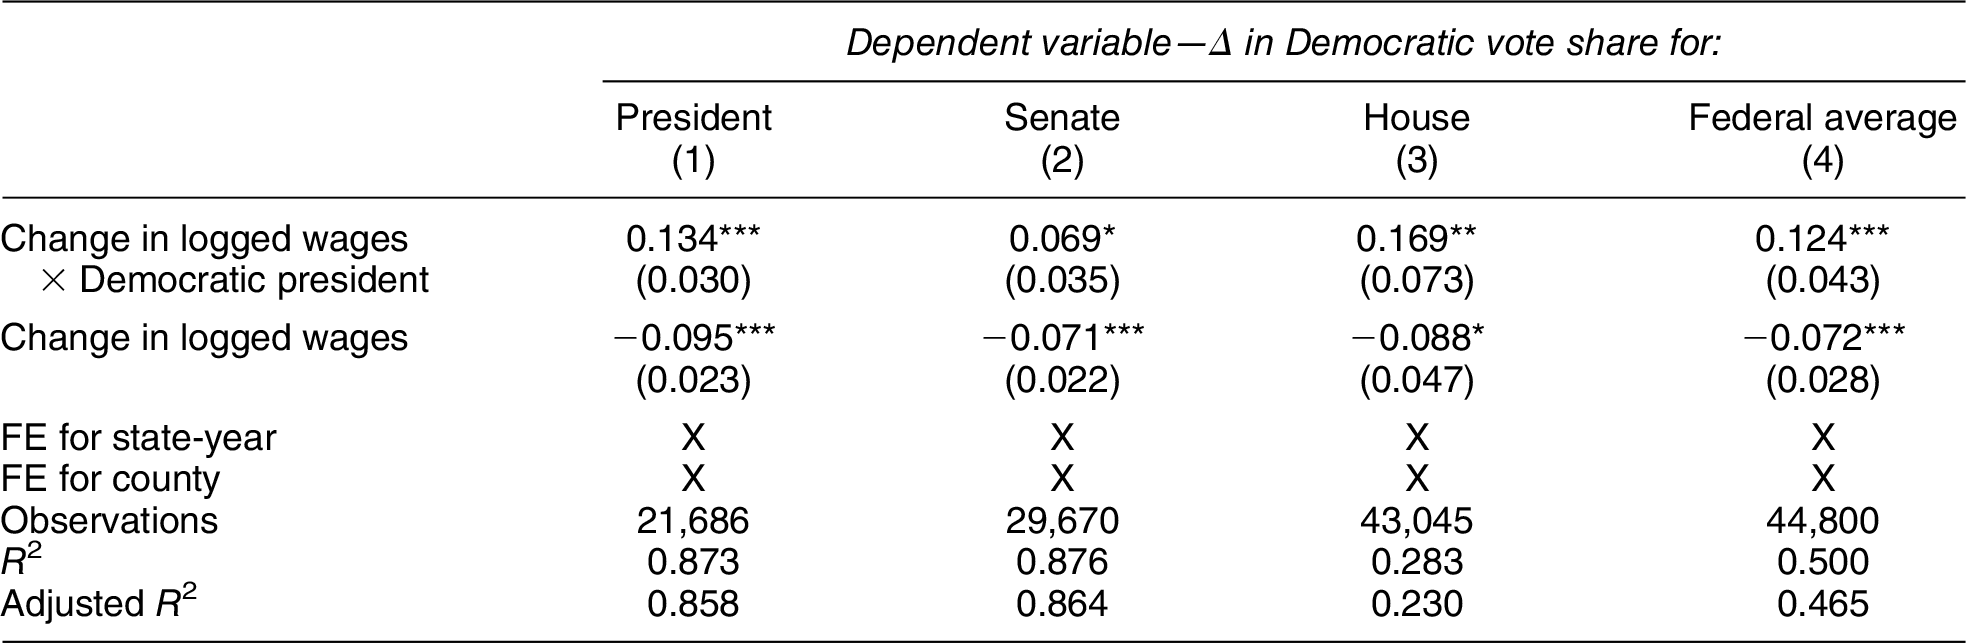
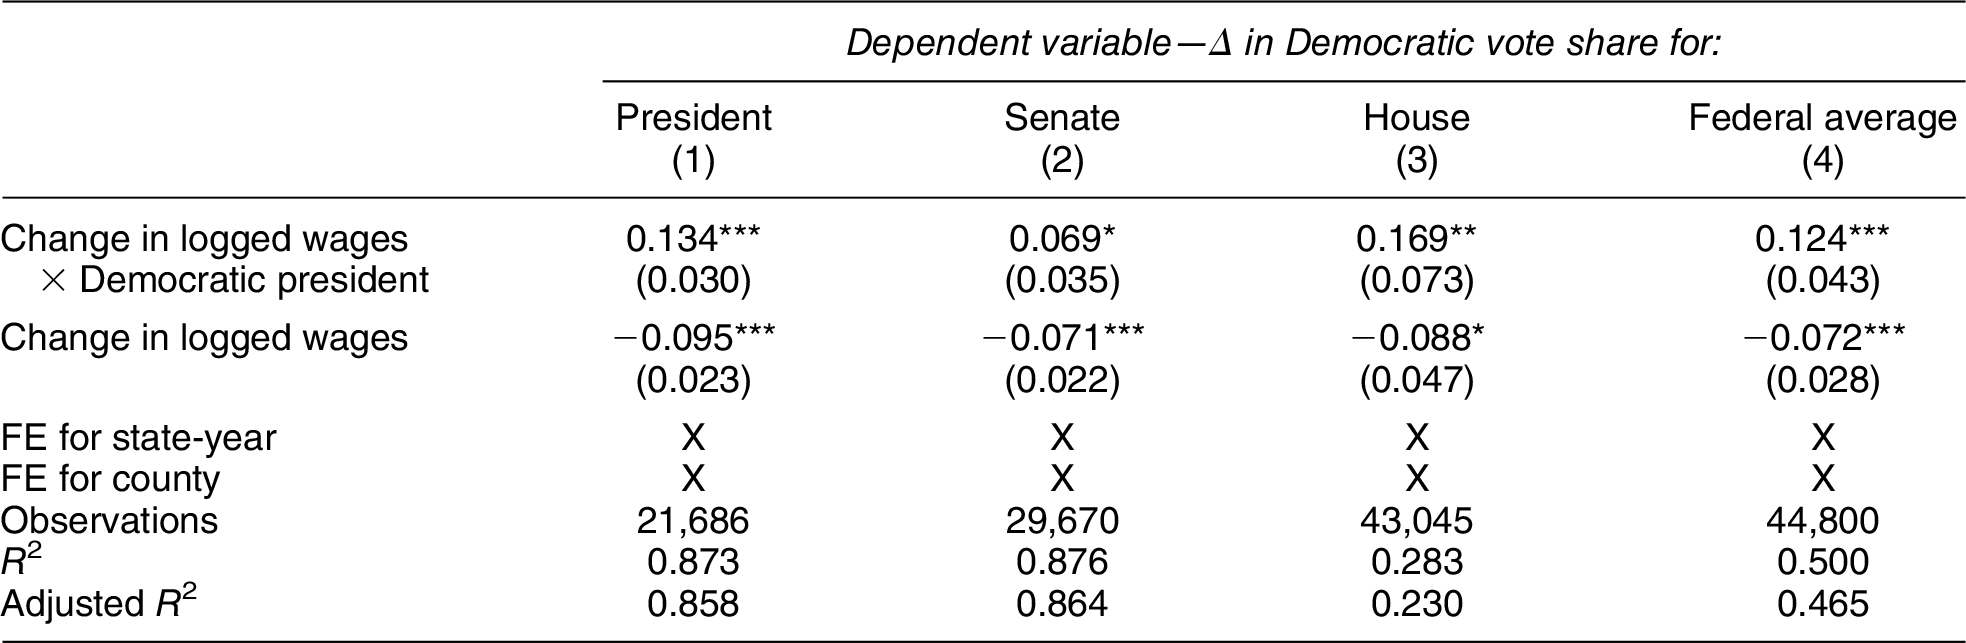
Table 3 shows our results for federal elections. Given that our independent variable is operationalized on a log scale, the coefficients across all models can be interpreted approximately as the change in vote share because of an increase in wage growth of one percent (Gelman and Hill Reference Gelman and Hill2007, 60–1). The interaction term in column (1) indicates that a one percent greater change in local wages leads to a 0.13 percentage point difference in Democrats’ vote shares in presidential elections when there is a Democratic president compared with when there is a Republican president. That is, the Democratic candidate does better when the economy grows and worse when it declines when there is a Democratic president. Columns (2) and (3) show that the president’s party is also rewarded and punished for economic performance in Senate and House elections. In Senate elections, a one percent greater change in local wages leads to a 0.07 percentage point difference in Democratic candidates’ vote shares when there is a Democratic president compared with when there is a Republican president. In House elections, a one percent greater change in local wages leads to a 0.17 percentage point difference in Democratic candidates’ vote shares when there is a Democratic president compared with when there is a Republican president.
Accountability for President’s Party in Federal Elections
Note: Standard errors clustered by county.
* p < 0.1; ** p < 0.05; *** p < 0.01.
Averaging across all these federal elections, an approximately one percent greater change in local wages leads to a 0.124 percentage point difference in Democratic candidates’ vote shares when there is a Democratic president compared with when there is a Republican president.Footnote 21 A one standard deviation change in wages within counties is about 2.3% (Mummolo and Peterson Reference Mummolo and Peterson2018). This implies that one standard deviation greater wage growth leads to about a 0.29 percentage point difference in federal Democratic candidates’ vote shares when there is a Democratic president compared with when there is a Republican one.
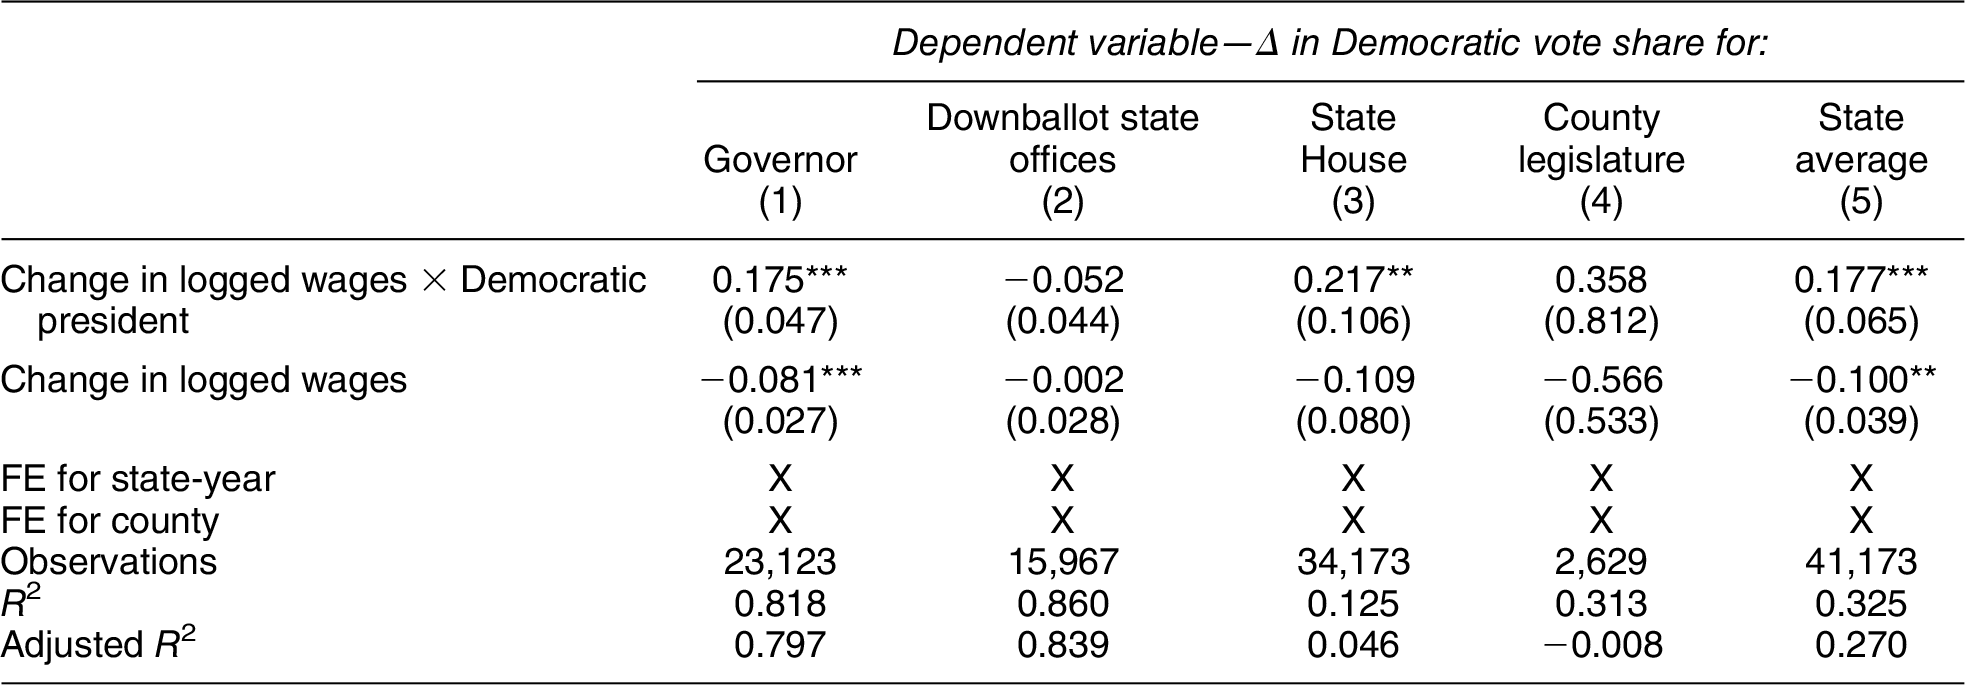
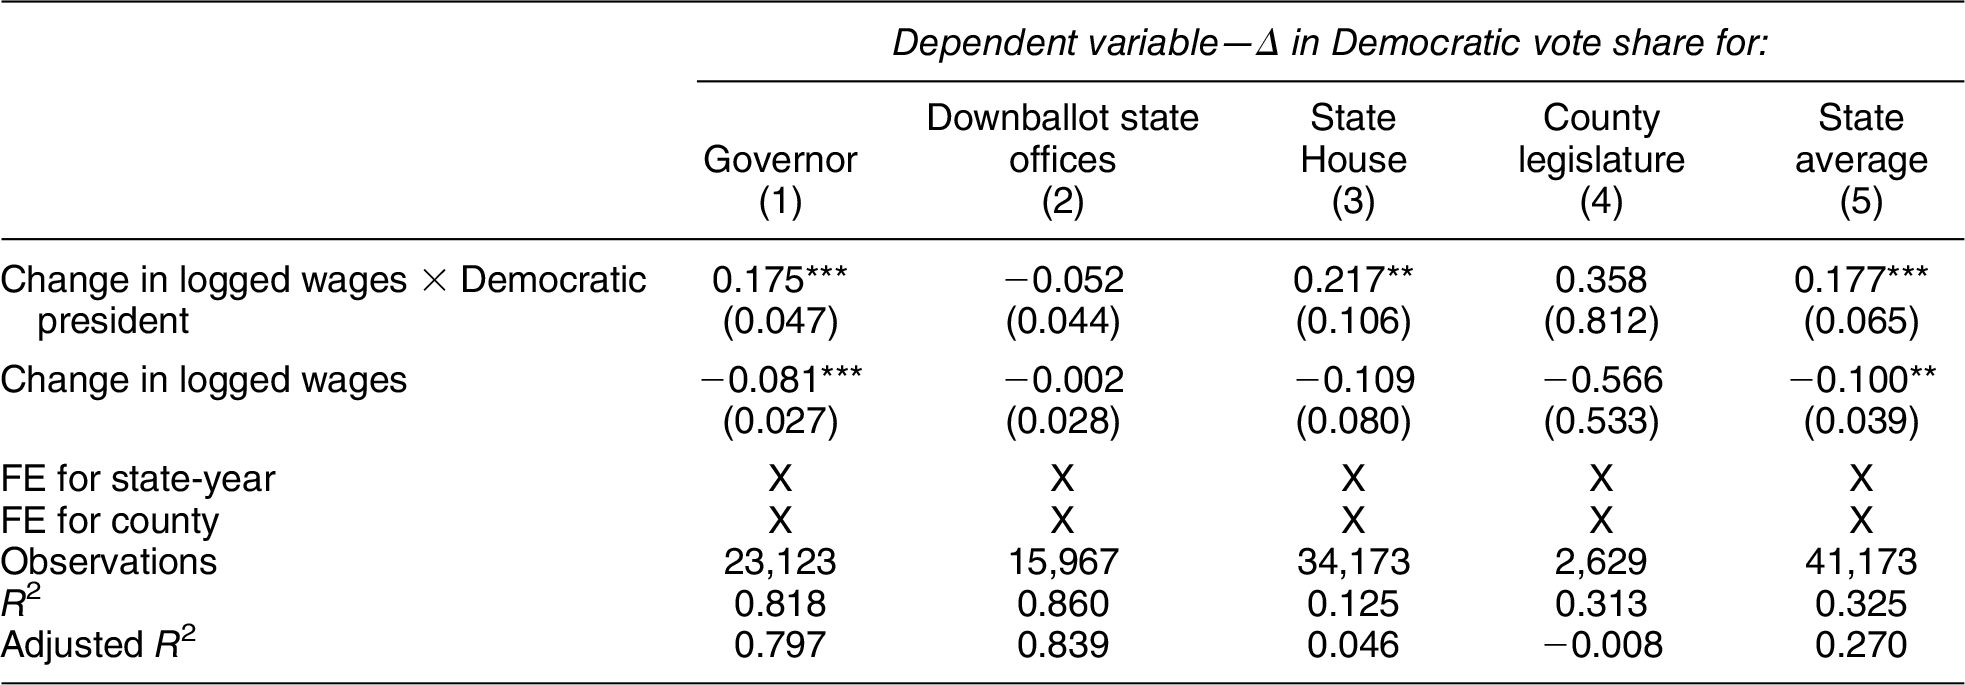
Next, we examine accountability for the president’s party in state and local elections (Table 4). The interaction term in column (1) shows that a one percent greater change in wages leads to a 0.18 percentage point difference in Democratic candidates’ vote shares in gubernatorial elections when there is a Democratic president compared with when there is a Republican president. Column (2) suggests, however, that the local economy has no effect on elections for other state offices such as attorney general and secretary of state. Column (3) shows that an approximately one percent greater change in local wages leads to 0.22 percentage point difference in Democratic candidates’ vote shares in state house elections when there is a Democratic president compared with when there is a Republican president. Column (4) examines accountability for the president’s party in county legislative elections. The point estimates here are also consistent with the results for other federal and state elections. However, the results are not statistically significant.
Accountability for President’s Party in State and Local Elections
Note: Standard errors clustered by county.
* p < 0.1; ** p < 0.05; *** p < 0.01.
Averaging across all state and local offices, an approximately one percent greater change in local wages leads to a 0.18 percentage point difference in Democratic candidates’ vote shares when there is a Democratic president compared with when there is a Republican president, as we show in column (5). This implies that a one standard deviation increase in local wage growth leads to about a 0.41 percentage point difference in Democratic candidates in state and local elections when there is a Democratic president compared with when there is a Republican one.
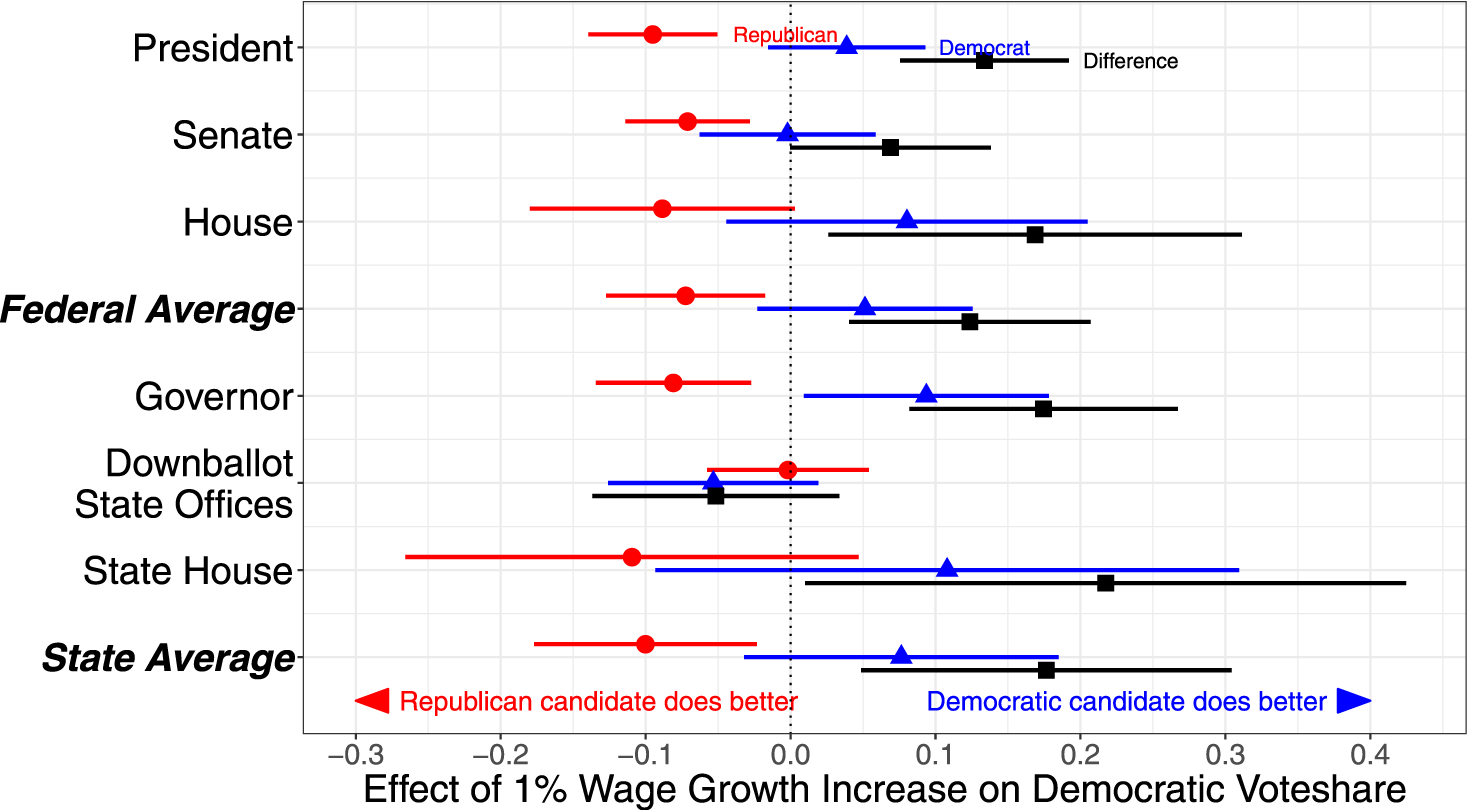
We show the main results from Tables 3 and 4 graphically in Figure 2, using separate points within each office for the effect of the economy on Democratic party vote share under a Democratic president (blue triangles) and under a Republican president (red circles). We also plot the difference between the two (black squares), which represents the interaction terms from Tables 3 and 4. The top panel shows these results in federal elections. It shows that the interaction effect representing partisan accountability is similar across federal races. The baseline effects of the economy under a Democratic president and under a Republican president are similar in presidential and U.S. House elections, though slightly smaller in Senate elections. Averaging across federal races, a 1% increase in local wage growth leads to a 0.07 percentage point decrease in Democratic vote share when there is a Republican president. Under a Democratic president, this same increase in wage growth leads to a 0.05 percentage point increase in Democratic vote share.
Accountability for the President’s Party
Note: This graph shows the effect of a 1% increase in local wage growth on the change in Democratic vote share, split by the incumbent president’s party in federal and state elections.
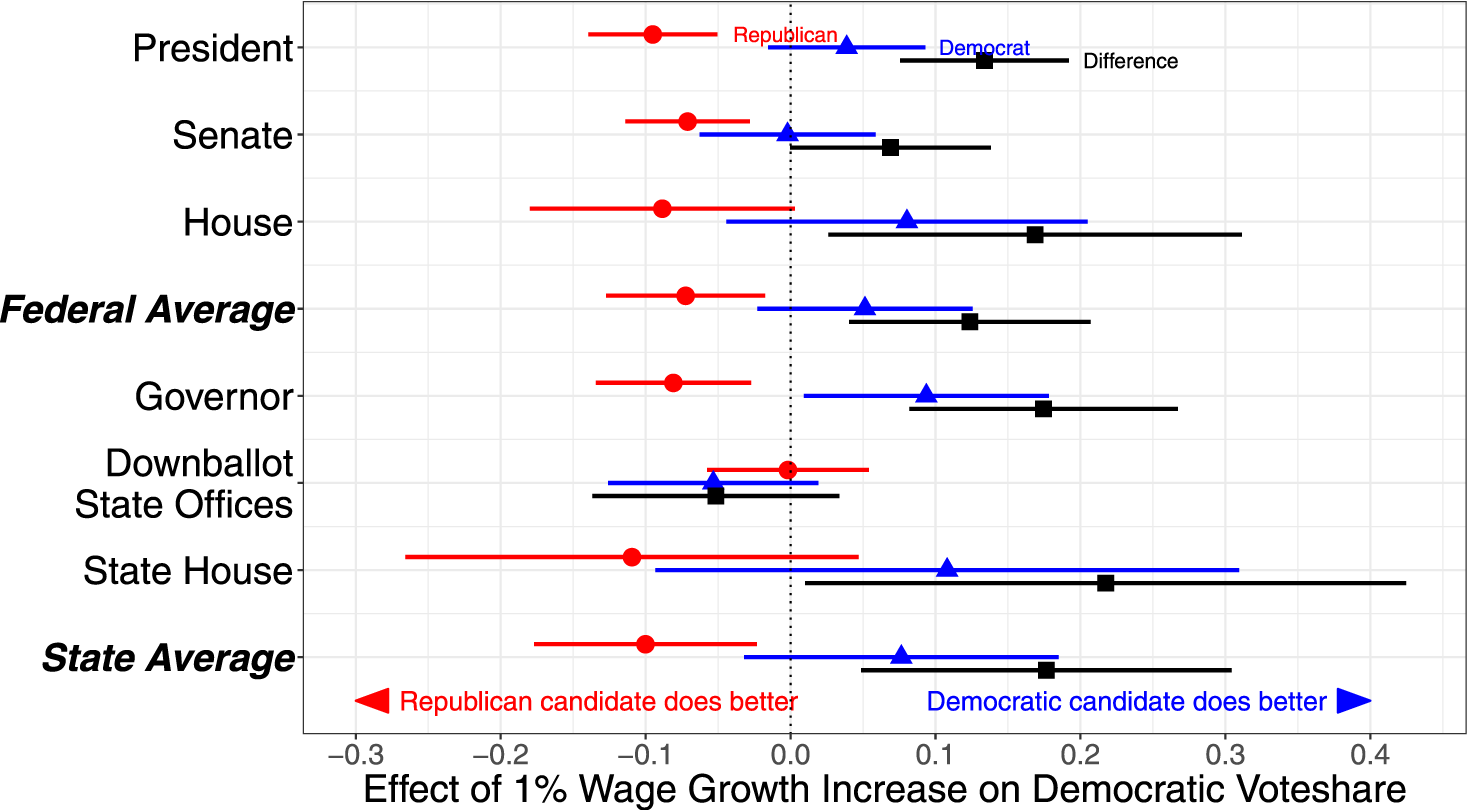
The bottom panel of Figure 2 shows the results from Table 4 in elections for state offices. Once again, the results are generally similar across elections. They are also similar to the results from federal elections. Averaging across state races, an approximately 1% increase in local wage growth leads to a 0.1 percentage point decrease in Democratic vote share in state elections when there is a Republican president, but a 0.08 percentage point increase in Democratic vote share when there is a Democratic president. Overall, Figure 2 illustrates that the president’s party is rewarded and punished for the economy across nearly all levels of government. Moreover, economic accountability for the president’s party is broadly similar in both federal and state elections. However, it is important to emphasize that the size of these effects are relatively modest. In addition, in Online Appendix C, we show that these effects are driven by the changes in the economy in the year of the election (rather than previous years during an incumbent’s tenure). This suggests that the small but systematic impact of the economy on voting is driven primarily by late-term shifts in economic performance (Achen and Bartels Reference Achen and Bartels2017; Healy and Lenz Reference Healy and Lenz2014)
Robustness Checks of Accountability for President’s Party
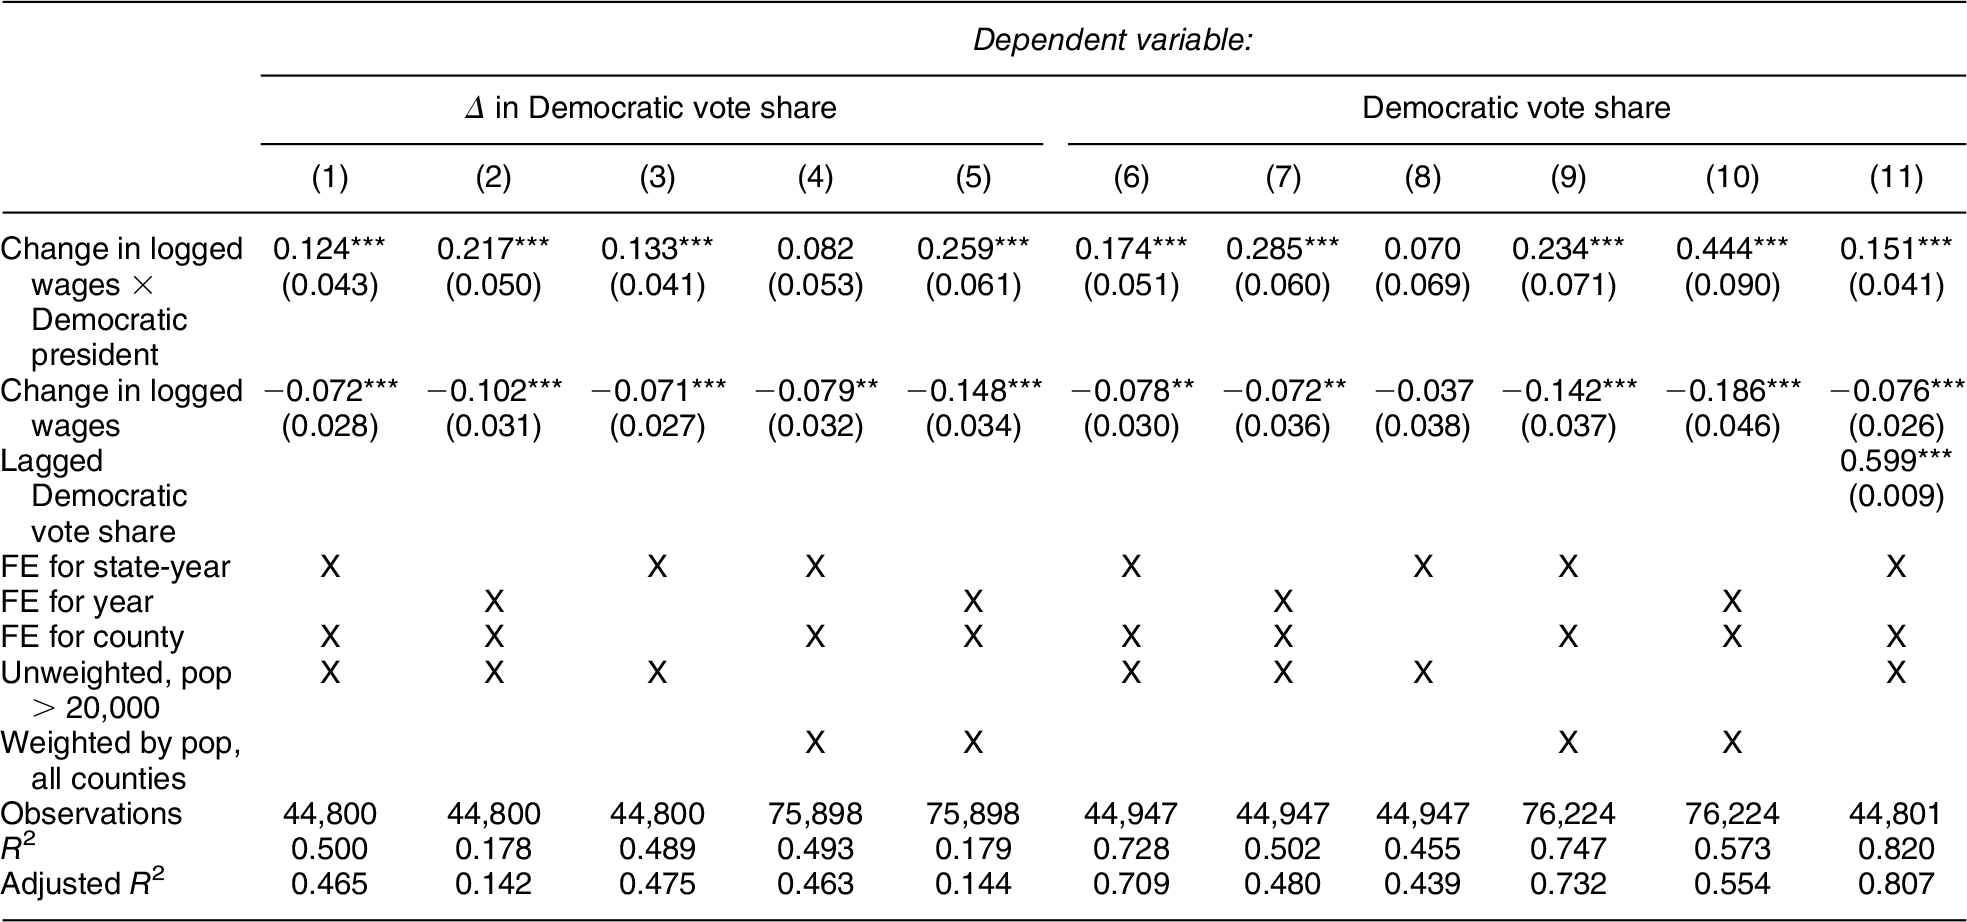
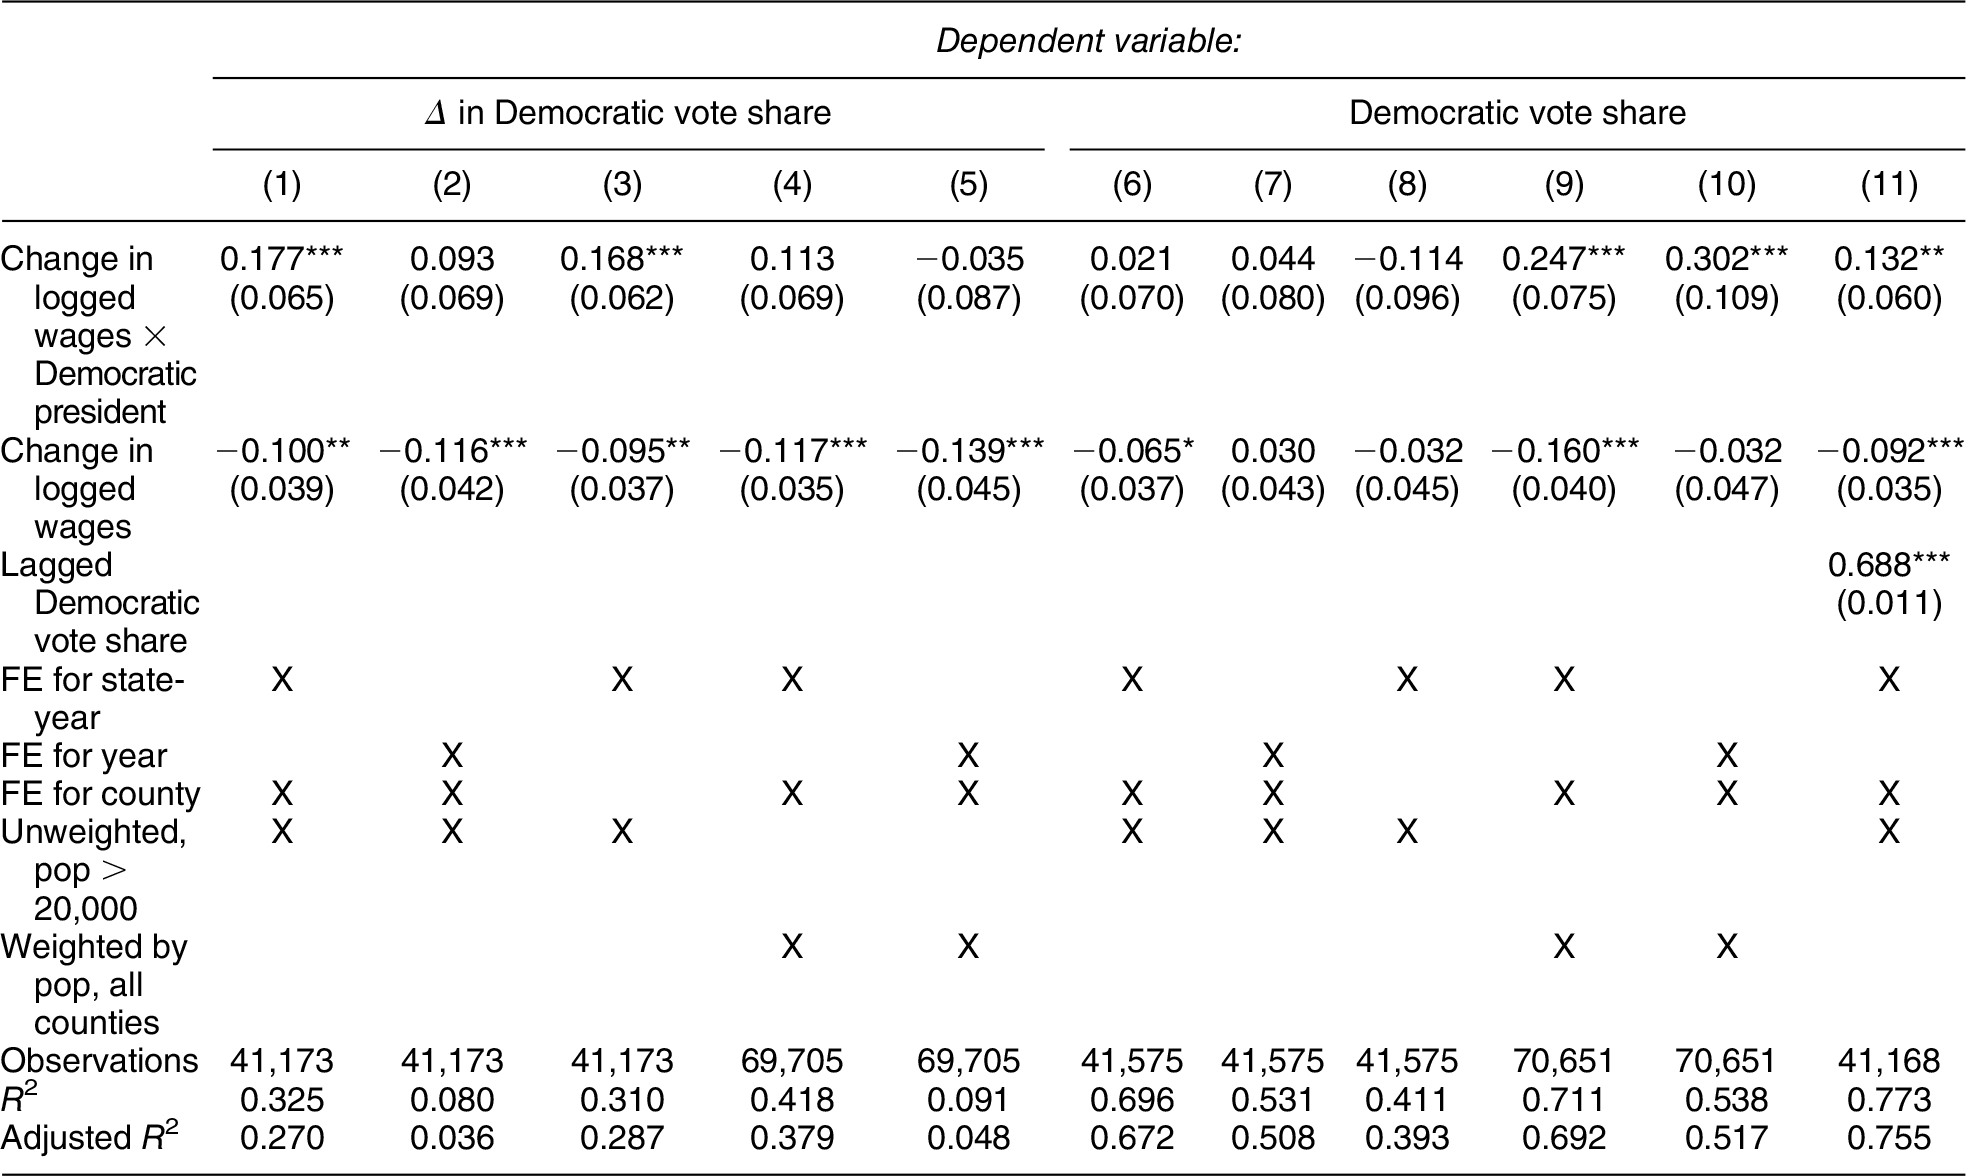
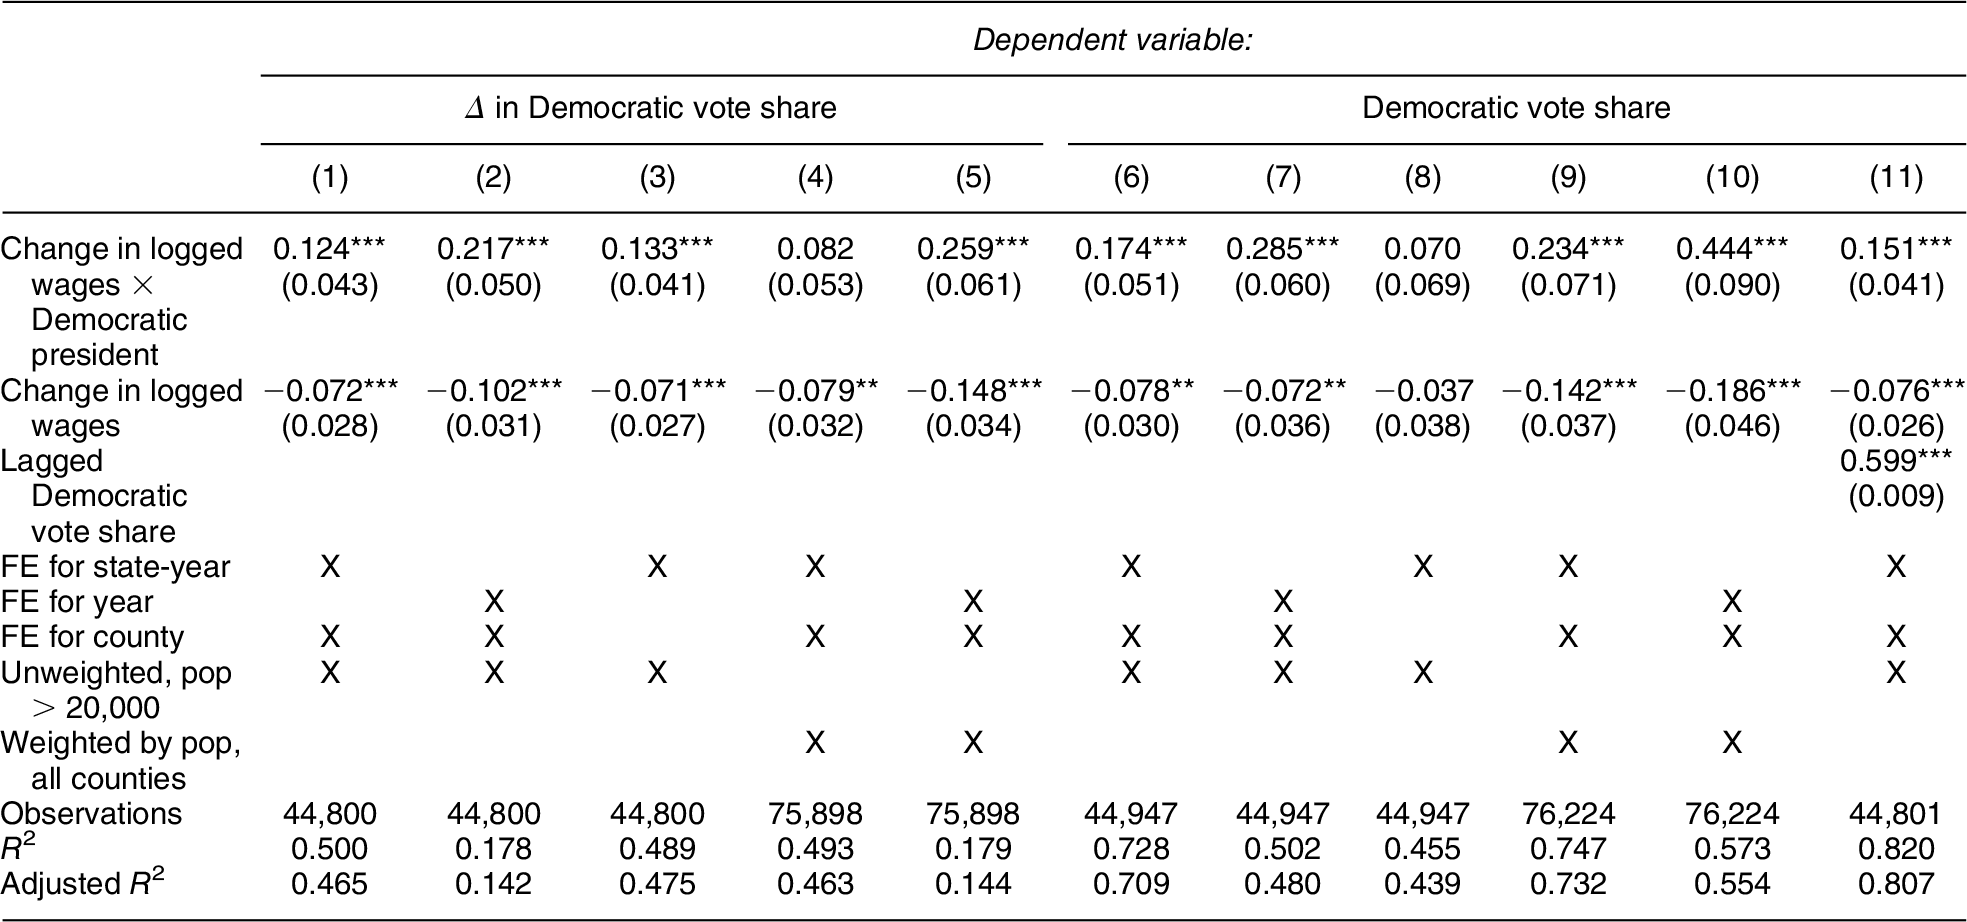
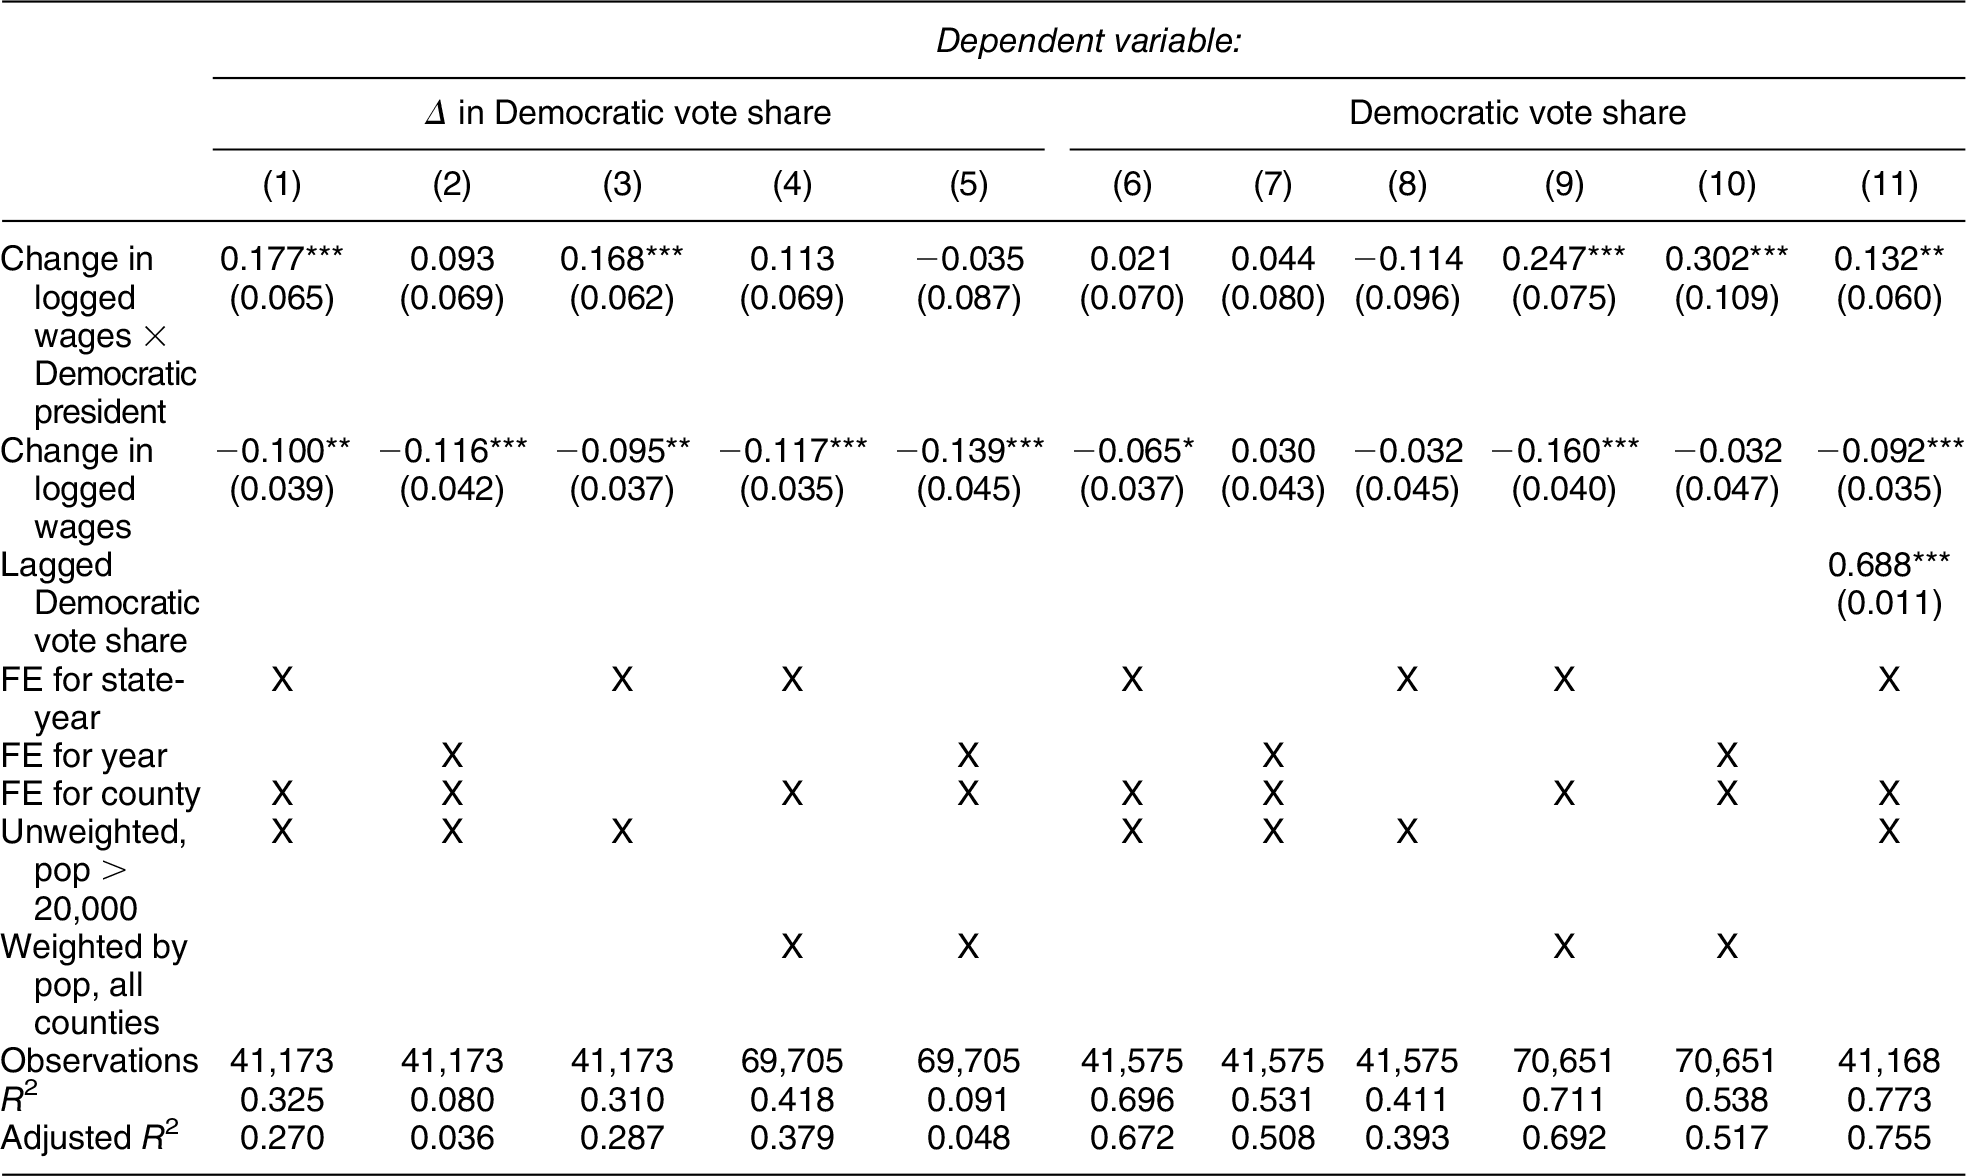
The preceding analyses showed a strong relationship between the performance of the local economy and the incumbent president’s party in both federal and state elections. In Tables 5 and 6, we examine the robustness of these results to differences in model specifications.
• First, in column (1), we show the model that we use in our main analyses, which uses the change in Democratic vote share as the dependent variable. This specification includes fixed effects for county and state-year. Finally, it uses counties with more than 20,000 people.
• In column (2), we examine a model that is identical to column (1), except that we substitute year fixed effects for state-year ones. This is similar to the specification commonly used in prior studies (e.g., Healy and Lenz Reference Healy and Lenz2017; Kriner and Reeves Reference Kriner and Reeves2012).
• In column (3), we examine a model that is identical to column (1), except that we omit county fixed effects.
• In column (4), we examine a model that is similar to column (1), except that it includes all counties and weights the results by population.
• In column (5), we examine a model that is identical to column (4), except that we substitute year fixed effects for state-year ones.
• Columns (6)–(10) replicate models (1)–(5), but they use levels of Democratic vote share as the outcome rather than changes in Democratic vote share.
• In column (11), we examine a model similar to that in column (6), but including a lagged dependent variable.
Robustness of Results for Accountability for President’s Party in Federal Elections
Note: Standard errors clustered by county.
* p < 0.1; ** p < 0.05; *** p < 0.01.
Robustness of Results for Accountability for President’s Party in State/Local Elections
Note: Standard errors clustered by county.
* p < 0.1; ** p < 0.05; *** p < 0.01.
Table 5 shows the results averaging across elections for federal offices. The point estimates are significant in nearly every model, and the substantive size of the results are always similar.Footnote 22 The only substantive difference across specifications is that the point estimates for the effect of the economy are generally larger when we use levels rather than deltas to capture election results. However, it is important to note that the specifications using levels for the outcome generally do not pass placebo tests (Online Appendix B). Thus, they should be interpreted with caution.
The results when using the average across state and local offices in Table 6 are somewhat less robust to alternative model specifications. They are only statistically significant in five of the 11 model specifications. But the point estimates are in the expected direction in nearly every model. Overall, the results in this section show that our results are robust to differences in model specifications.
Accountability for Incumbents
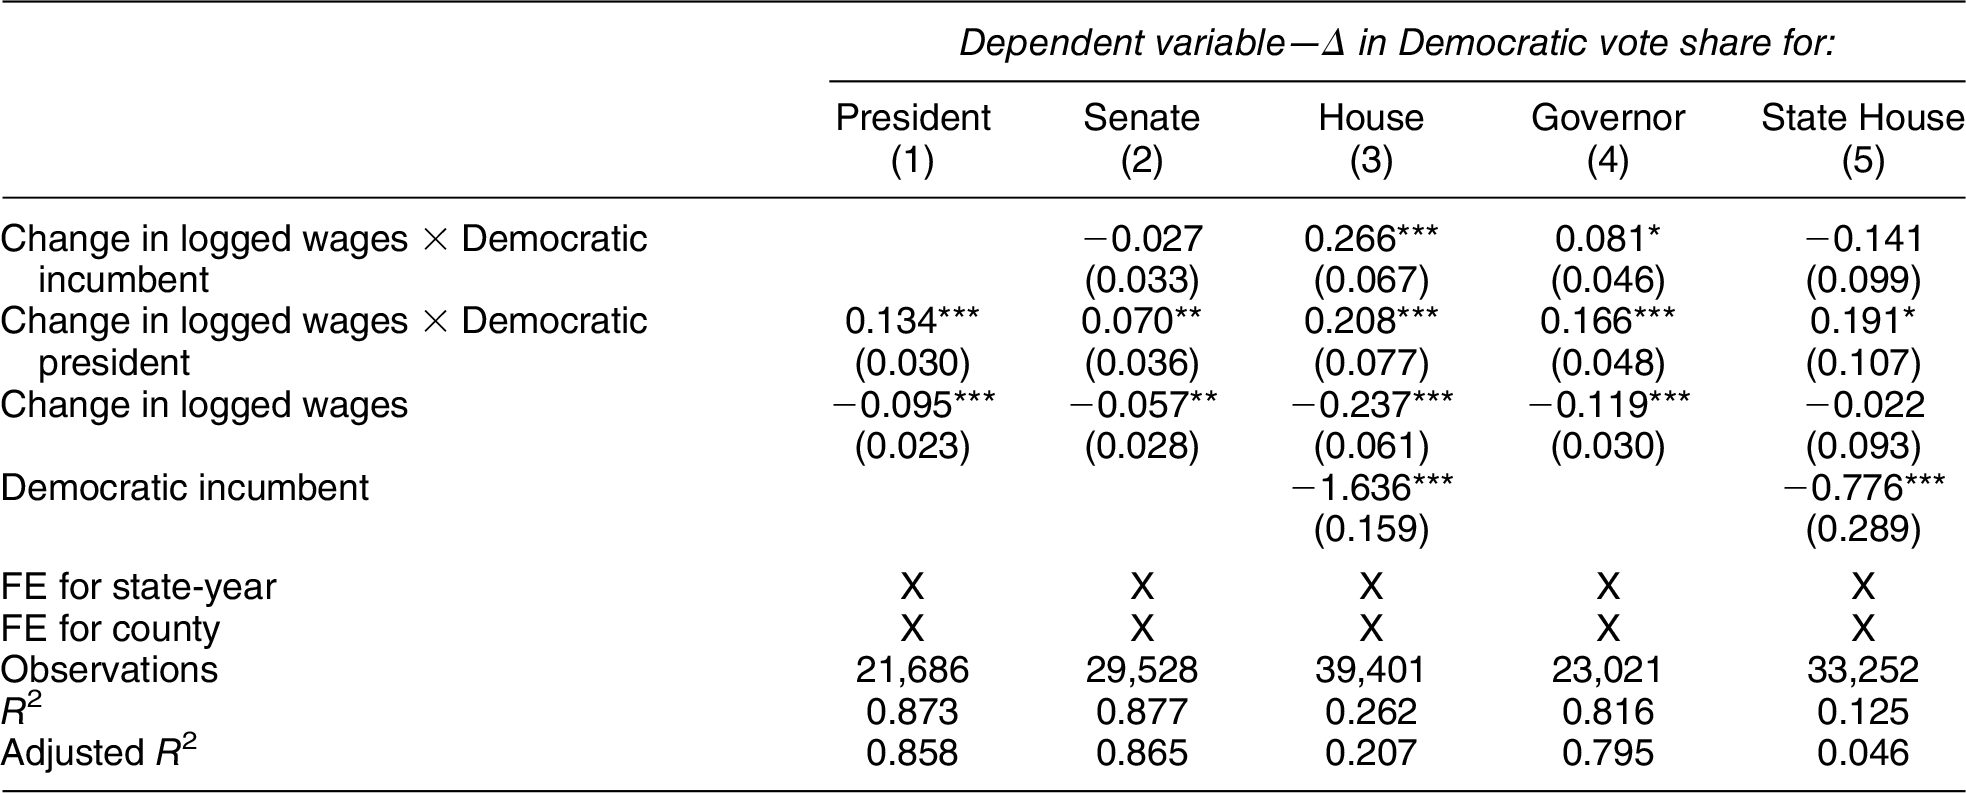
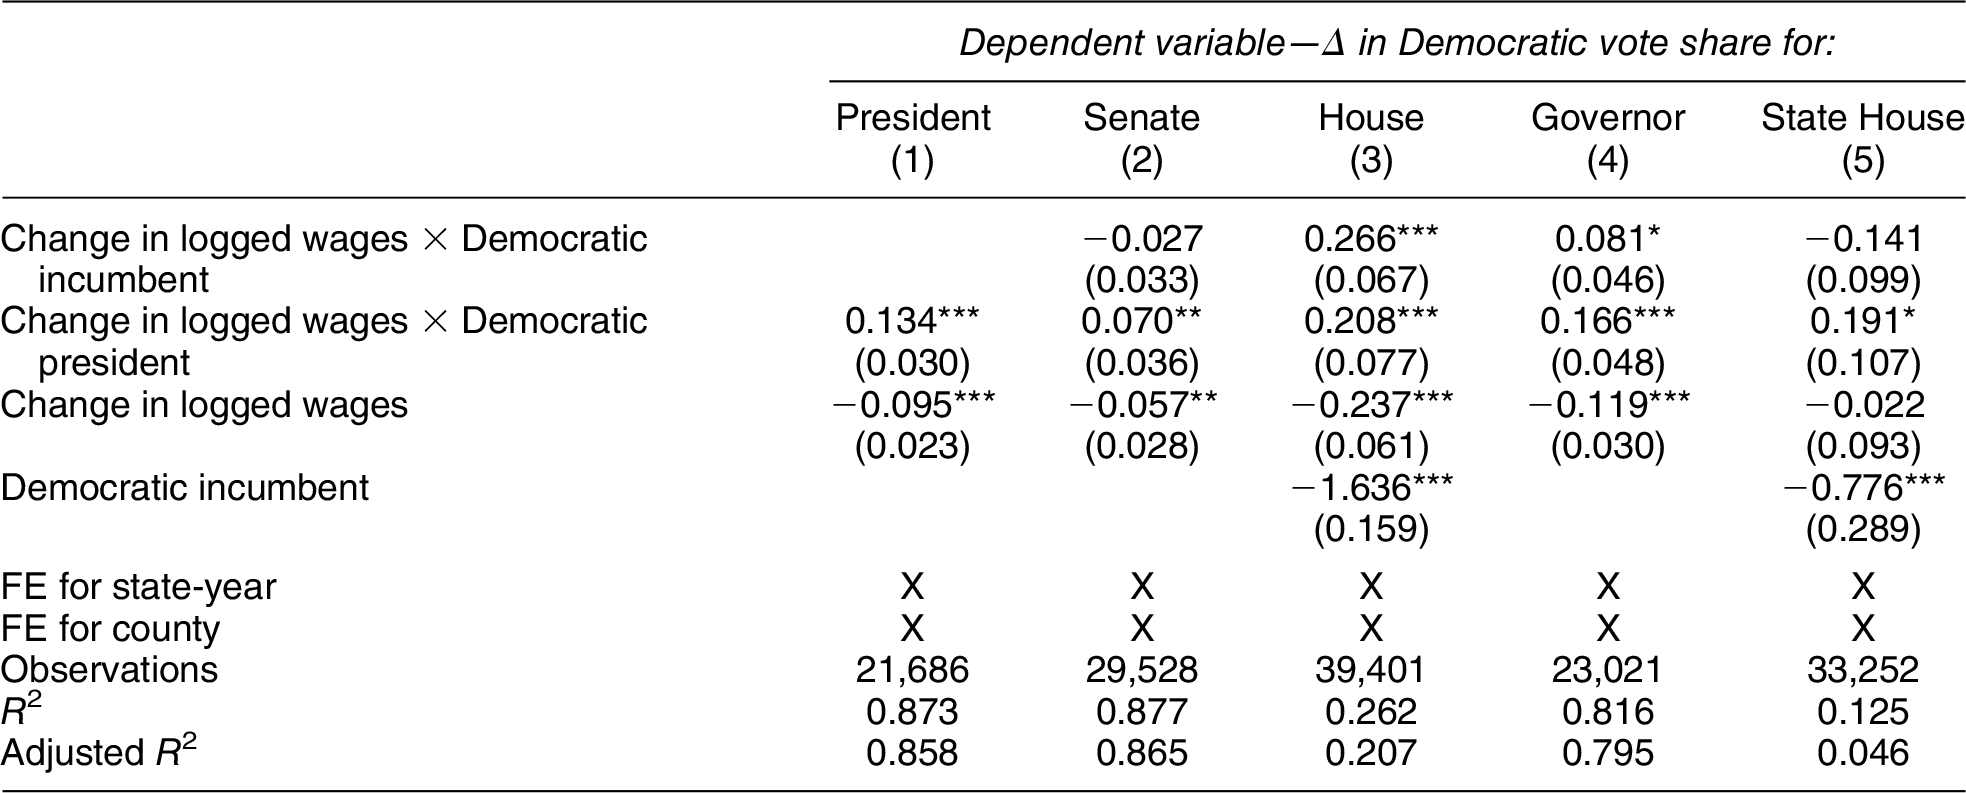
In this section, we examine whether the party that controls offices other than the president influences retrospective voting above and beyond the effect of sharing a partisan label with the President. For instance, are House candidates from the same party as the incumbent House representative in their district rewarded for a strong economy?
Table 7 shows the results. Looking across offices, the results continue to show that the president’s party is rewarded for a strong economy and punished for a weak one (second row). In all offices except the state house, the interaction between wages and the indicator for a Democratic president is positive and statistically significant. A one percent greater increase in wage growth leads to differences in Democratic vote share of between 0.07 and 0.21 percentage points when the president is a Democrat compared with when the president is a Republican.
Accountability for Incumbents
Note: Standard errors clustered by county.
* p < 0.1; ** p < 0.05; *** p < 0.01.
Moreover, there is strong evidence that the party of the current governor and U.S. House seat matters. The party of the incumbent in these elections is awarded a substantial boost in a strong economy—an increase of 0.08 percentage points for governor and 0.27 percentage points for the House from one percent greater wage growth. We find little evidence, however, that voters hold accountable candidates of the party of the current Senator or state house member.Footnote 23
HETEROGENEITY OVER TIME
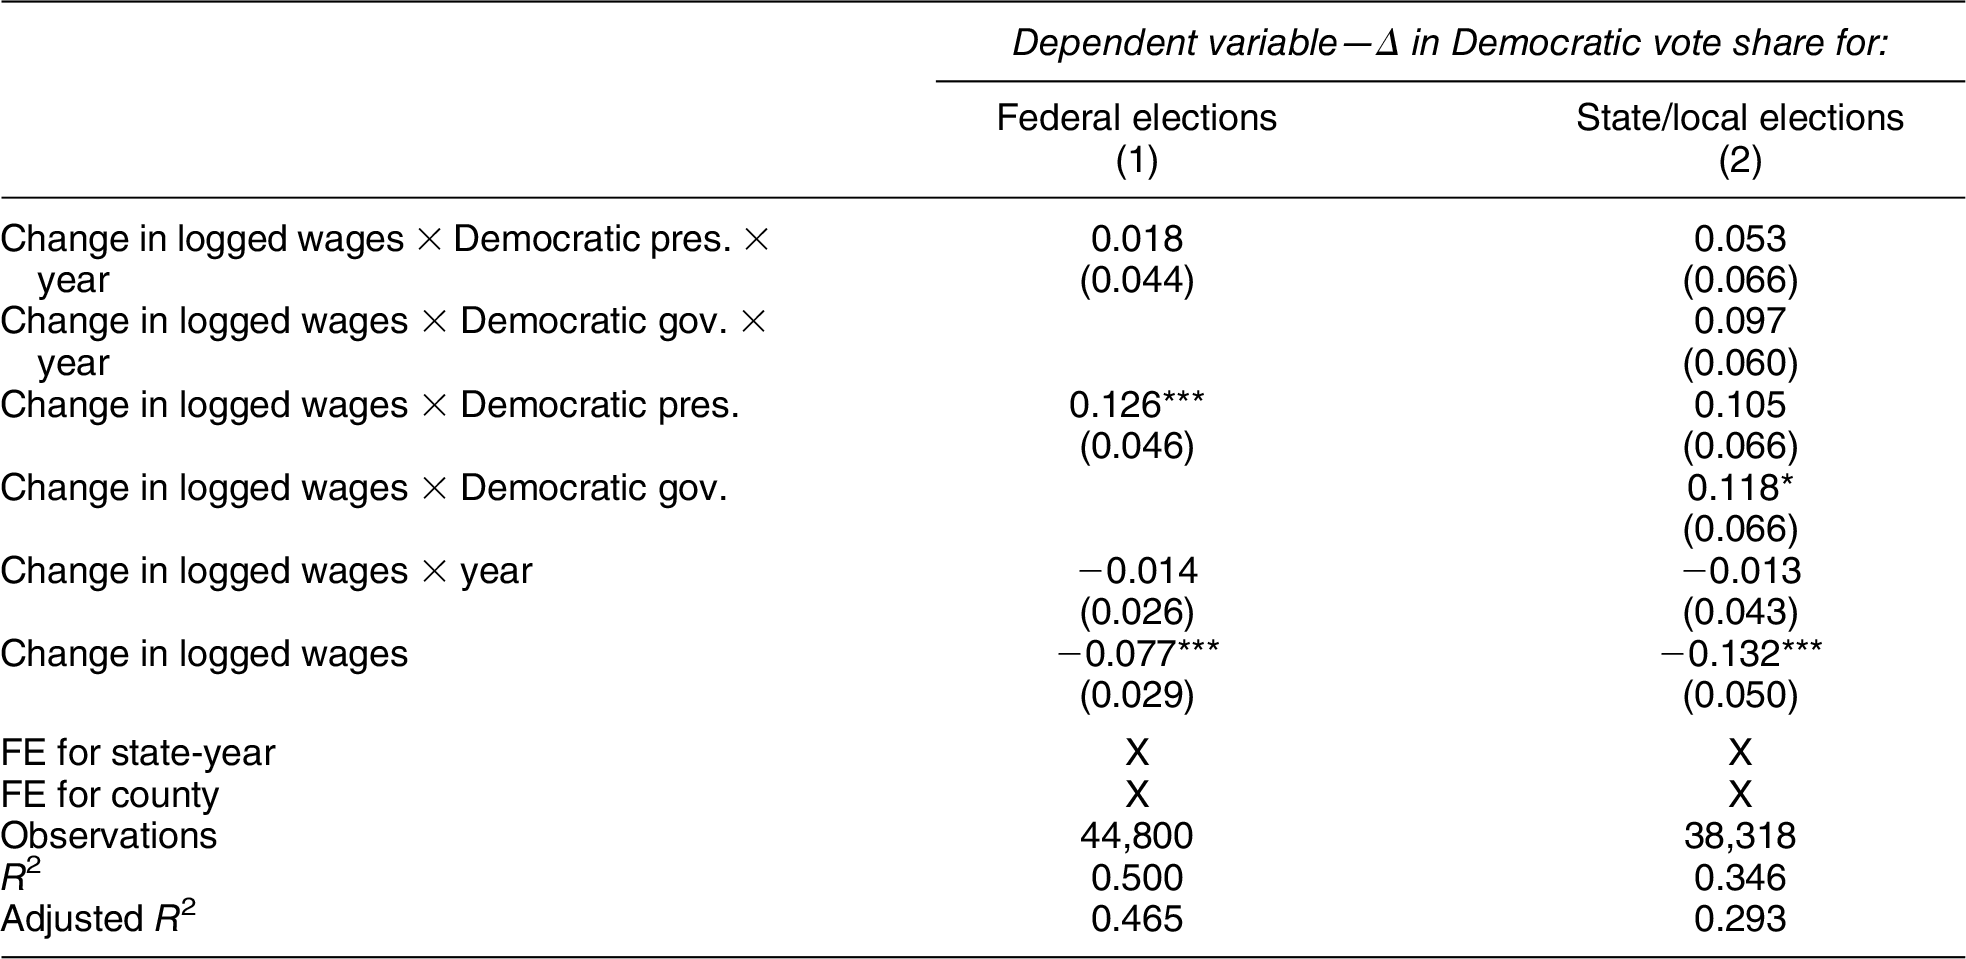
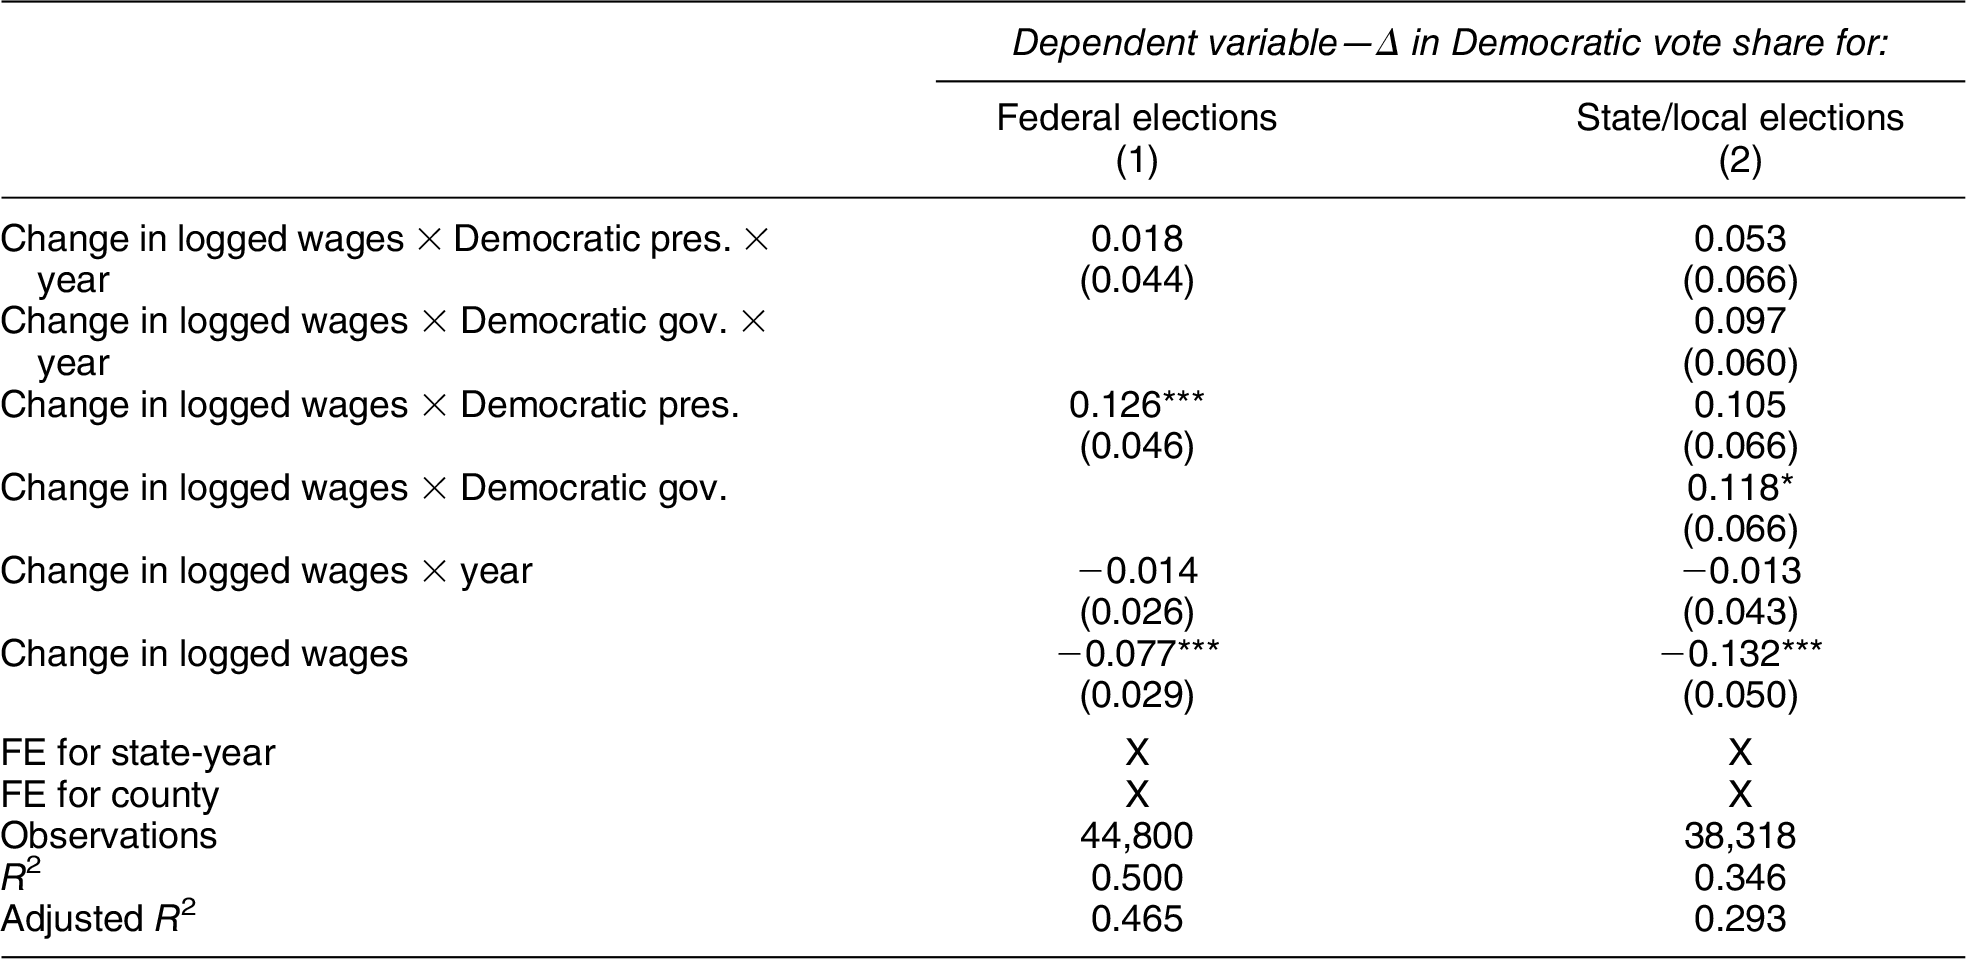
We next investigate whether economic accountability in federal, state, and local elections has changed over time. To do so, we replicate our main analyses from Tables 3 and 4 but interact the main treatment variables for accountability with a standardized variable for the year.
We report the results of these analyses in Table 8. The coefficient of interest that would correspond with a change in accountability over time is that on the triple interaction between wages, the indicator for a Democratic incumbent, and the year. However, we find no clear evidence of changes over time in retrospective voting for either the party of the president or governor in federal (column 1) or in state (column 2) elections. In Online Appendix G, we analyze time trends separately for presidential, U.S. House, Senate, governor, and state house elections. And in Online Appendix H, we analyze accountability in federal and state elections in the era before 1990 and the era after 1990. In these analyses, we also find no consistent evidence of significant changes over time in retrospective voting for the local economy.Footnote 24
Changes in Accountability Over Time
Note: Standard errors clustered by county.
* p < 0.1; ** p < 0.05; *** p < 0.01.
LOCAL MEDIA AND ACCOUNTABILITY
In the previous sections, we have found strong evidence that the president’s party is held accountable in state and federal elections. Previous literature has also demonstrated that economic accountability may be contingent on other institutional factors. One important institutional question is whether the media influences retrospective voting in elections. There are a variety of theoretical reasons to believe that media coverage of the local economy facilitates accountability. For instance, media coverage has important effects on people’s knowledge about politics (Hayes and Lawless Reference Hayes and Lawless2015; Snyder and Strömberg Reference Snyder and Strömberg2010). Some work has even directly suggested that counties that constitute a larger portion of their media market are likely to have more media coverage of the local economy, which may affect retrospective voting (Hopkins and Pettingill Reference Hopkins and Pettingill2018). Yet there is limited evidence on the link between the media and local economic voting.
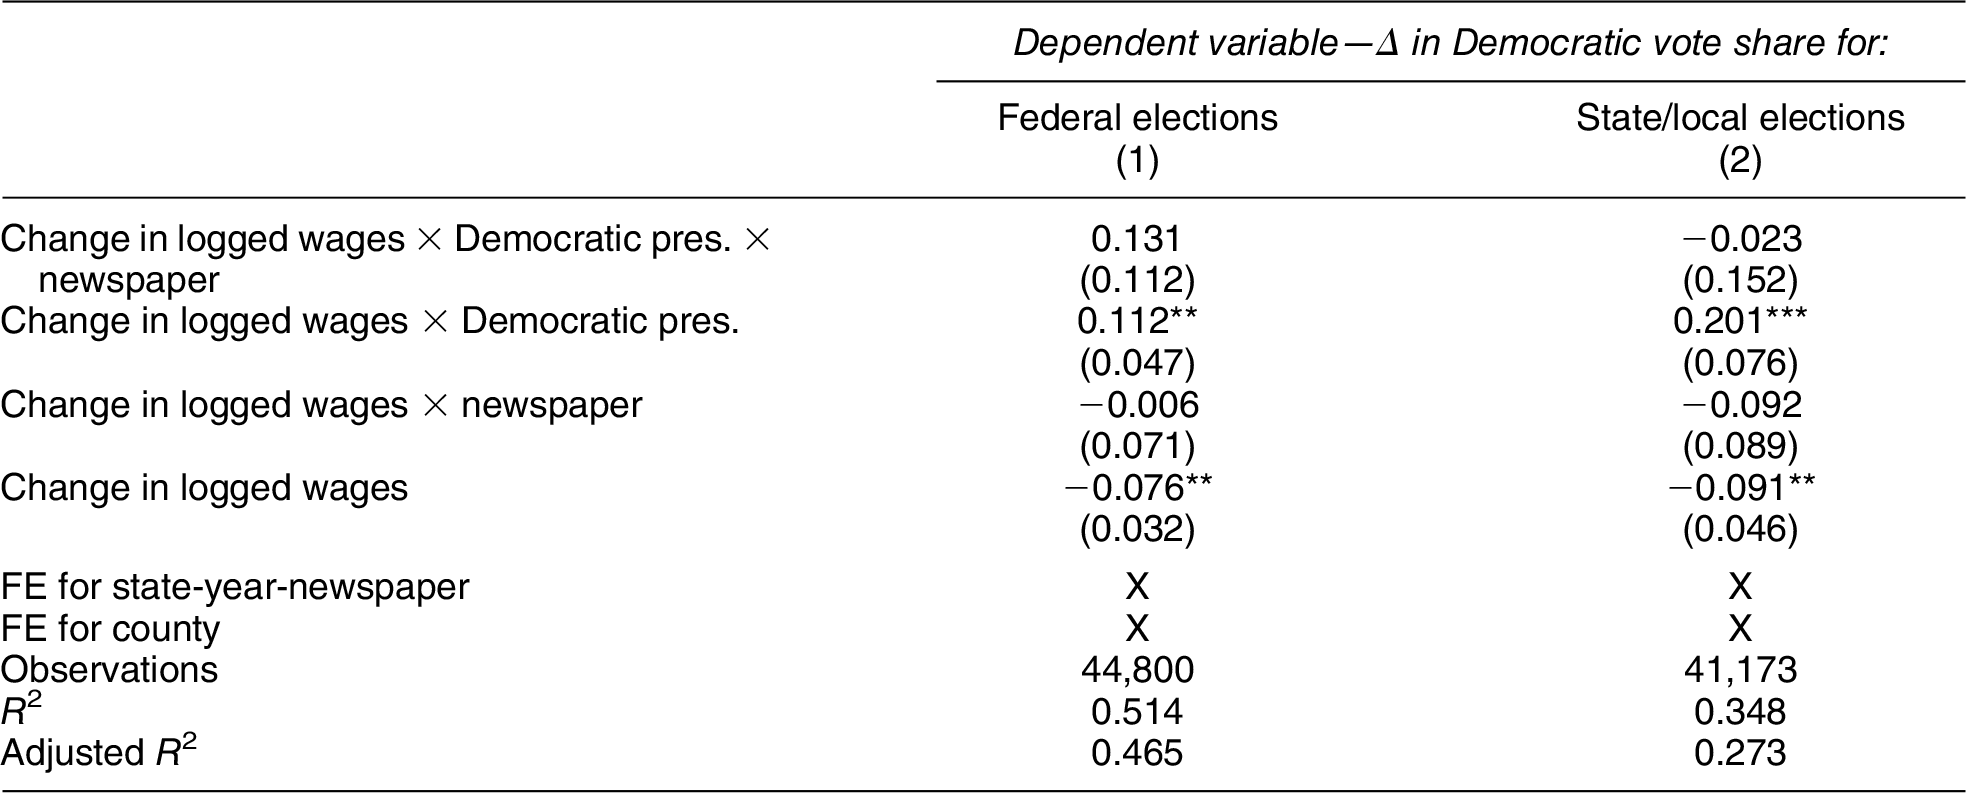
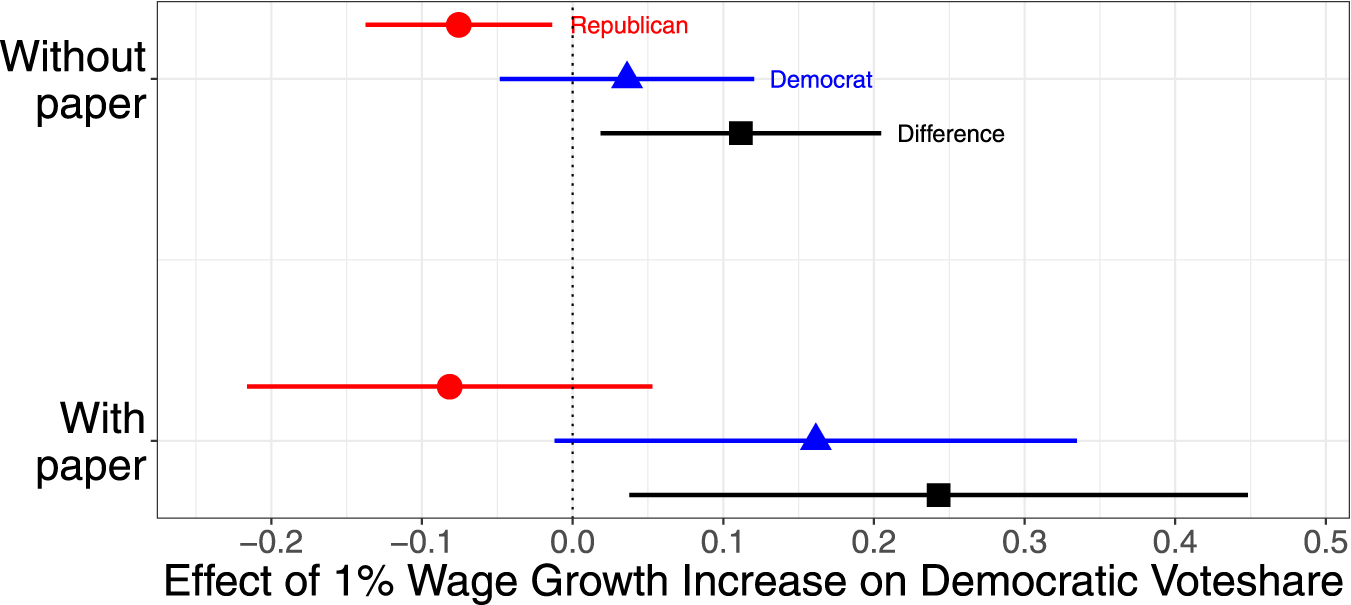
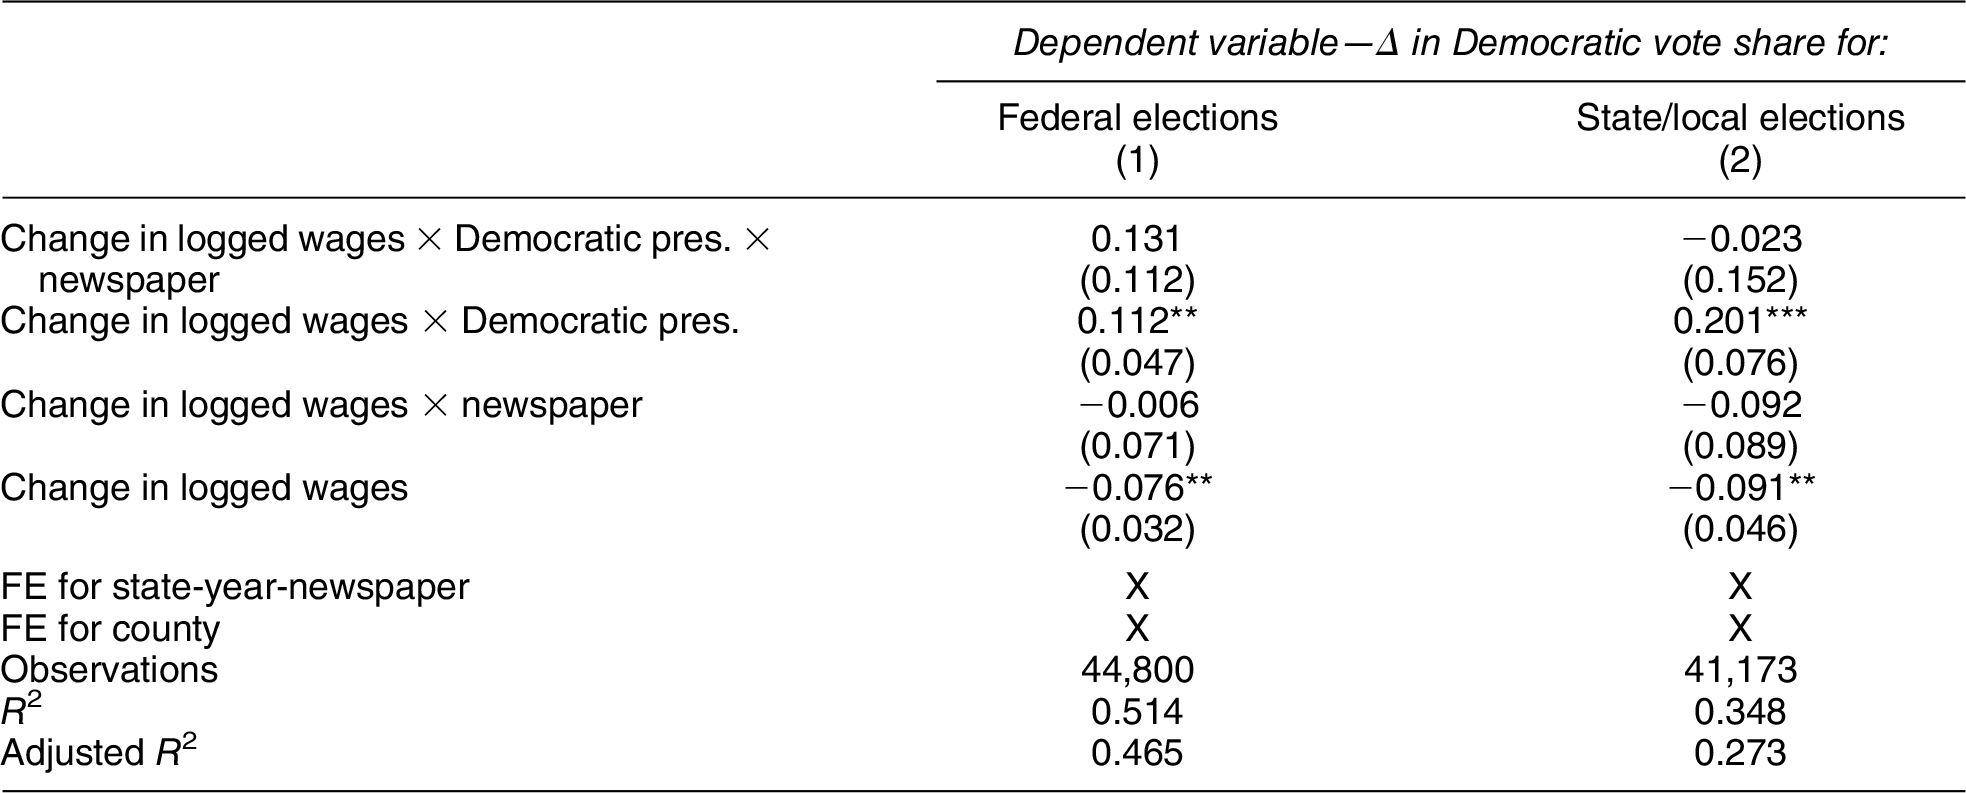
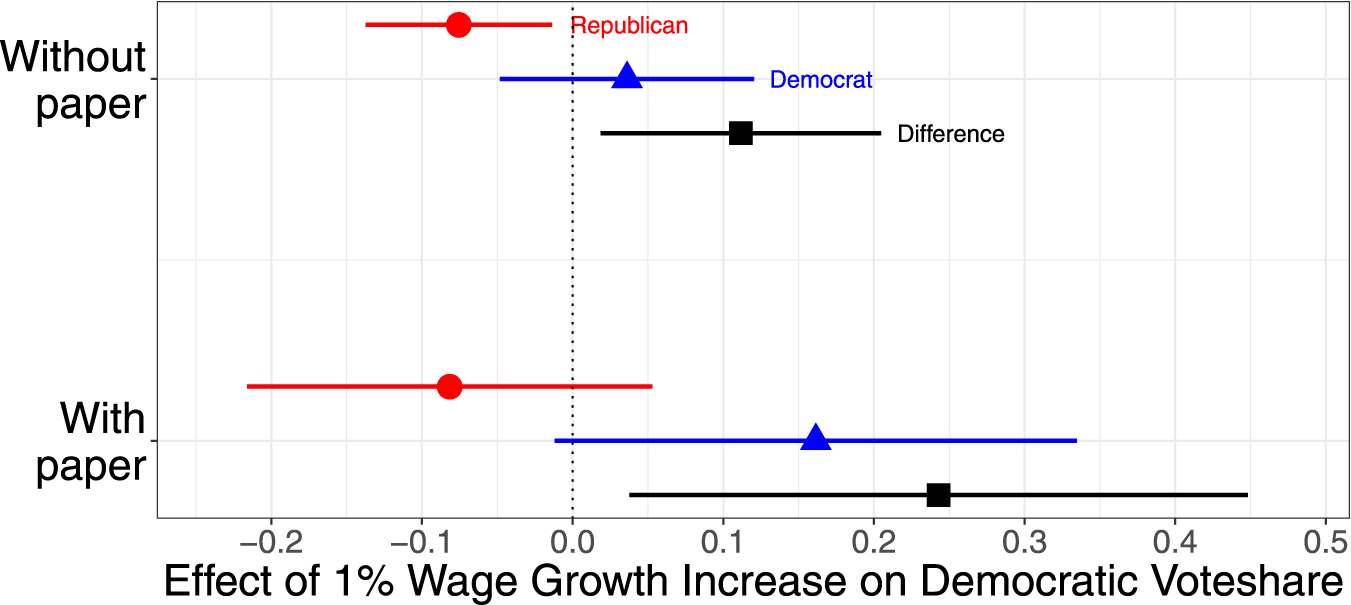
To examine this question, we harness data on the circulation of local newspapers and replicate our main analyses of economic voting but interact our main independent variables with a variable capturing the availability of media in that county. Our media coverage variable measures whether counties form the plurality of their dominant newspaper’s circulation area and is based on circulation data from 2011.Footnote 25 Admittedly, these data are cross-sectional in nature and so do not enable us to assess over-time changes in media coverage within counties, which would be the best possible way to examine this question. Using this static measure, however, we assess whether counties with better media coverage in 2011 demonstrate a stronger pattern of economic voting.Footnote 26 To do so, we focus on two models—one that averages across federal elections and one that averages across state and local elections, which we report in Table 9. In each model, we create an interaction between the local economy, the party of the president, and our measure of media availability. We find some suggestive evidence that newspapers may increase accountability for the president’s party in federal elections, as indicated by the positive triple interaction term in column (1) and the relative size of the difference coefficients in Figure 3.Footnote 27 But we find no evidence that newspapers influence retrospective voting in state and local elections. In Online Appendix I, we analyze the role of the media separately for presidential, U.S. House, Senate, governor, and state house elections. In these analyses, we also find only suggestive evidence that the media moderates retrospective voting in federal elections.
Media and Accountability
Note: Standard errors clustered by county.
* p < 0.1; ** p < 0.05; *** p < 0.01.
Accountability for the President’s Party in Federal Elections
Note: This graph shows the effect of a 1% increase in local wage growth on the change in Democratic vote share, split by the incumbent president’s party and the presence of a newspaper in the county, averaged across federal elections.
It is worth noting several limitations of our research design on the role of the media as a moderator for accountability. First, our measure of newspaper circulation is only measured cross-sectionally in a single year (2011). Of course, there have been changes in the newspaper industry in recent years, and many smaller newspapers have closed, leading to an overall decline in coverage of politics—especially state and local politics (Darr, Hitt, and Dunaway Reference Darr, Hitt and Dunaway2018; Martin and McCrain Reference Martin and McCrain2019; Peterson Reference Peterson2019). Second, our analysis here lacks a causal identification strategy. There could be any number of differences between counties with newspapers and those that lack them and any of these factors might confound a causal interpretation of these analyses. For instance, counties with newspapers tend to be larger and more dense. Nonetheless, our tentative findings on the limited role of the media suggest that the media does not play a crucial role in enabling retrospective voting.
CONCLUSION
In this article, we compile the first comprehensive evidence on retrospective voting for the economy at all levels of government in the United States. There are strong theoretic and empirical reasons to believe that economic voting exists in elections, both nationally and subnationally. However, previous work on whether politicians are rewarded and punished for the economy has focused almost entirely on presidential elections. When it has focused on subnational elections, it has found mixed or contingent evidence of economic voting.
We find evidence that the president’s party is rewarded and punished for the local economy at multiple levels of government in the United States. Voters reward and punish candidates for the local economy in presidential, senate, house, gubernatorial, and state house elections based on whether or not they share a partisan label with the president. A one percent increase in wage growth at the county level leads to an increase in vote share of candidates from the incumbent president’s party of 0.12 percentage points in federal elections and 0.18 percentage points in state and local elections, on average. By contrast, we find limited evidence of these patterns according to the party of downballot incumbent officeholders. Only in U.S. House and gubernatorial elections is the party that controls that level of government rewarded and punished for economic conditions. Candidates from the party in power in other offices, on the other hand, are not rewarded and punished for the performance of the economy. These findings support a largely president-centric, or nationalized, theory of elections, in which voters link politicians at all levels of government to the president based on partisan labels.
Overall, our findings reinforce previous work on retrospective voting based on the national economy, which have shown that the economy has an influence on elections across both state and federal government. The substantive size of our findings on retrospective voting based on the local economy is similar to recent findings in comparative politics (Larsen et al. Reference Larsen, Hjorth, Dinesen and Sønderskov2019), as well as other recent work in American politics on presidential elections (Healy and Lenz Reference Healy and Lenz2017).Footnote 28 Although the effects of the national economy are hard to causally identify, descriptive evidence suggests that these effects may occur in addition to the relatively small effects of the local economy that we are able to causally identify in this article.
Moreover, the fact that these effects are driven by changes in the economy in the final year before the election, as we show in Online Appendix C and as others have shown in federal elections (e.g., Achen and Bartels Reference Achen and Bartels2017; Healy and Lenz Reference Healy and Lenz2014), suggests that voters have a recency bias when holding government accountable in subnational elections as well. The president and members of her party therefore have a clear incentive to grow the economy late in their tenure. In anticipation of voters’ myopia in the arena of economic performance, strategic politicians at all levels of government may target resources and policies for economic growth toward the period immediately before elections, despite potential negative long-term consequences (Tufte Reference Tufte1978).
In addition, strategic politicians have incentives to target geographic areas likely to have close elections with distributive spending and other policies to grow the economy. Indeed, our findings are consistent with past work showing that voters reward incumbent presidents (or their party’s nominee) for increased federal spending in their communities (e.g., Chen Reference Chen2013; Kriner and Reeves Reference Kriner and Reeves2012). The results from this article suggest that the president’s party could reap electoral rewards from growing the economy in battleground states that are likely to be pivotal in presidential elections. Our results also show that the president’s party has strong incentives to grow the economy in areas that are likely to have close Senate, House, gubernatorial, or state legislative elections as well. Thus, our work provides an electoral rationale for previous research showing that members of the president’s party tend to get more distributive spending in their districts (Berry, Burden, and Howell Reference Berry, Burden and Howell2010; Dynes and Huber Reference Dynes and Huber2015; Kriner and Reeves Reference Kriner and Reeves2015).
More tentatively, our work also provides an electoral rationale for the behavior of elites at the subnational level. Past work has shown that subnational incumbents may focus on economic development both in their policymaking (Logan and Molotch Reference Logan and Molotch1987) and in their communication (Holman Reference Holman2016) to try to boost their electoral fortunes. Our results show how candidates from an incumbent officeholder’s party, as well as the president's party, receive an increase in their vote share from better economic performance in some races, indicating that these efforts may pay off.
SUPPLEMENTARY MATERIAL
To view supplementary material for this article, please visit https://doi.org/10.1017/S0003055420000027.
Replication materials can be found on Dataverse at: https://doi.org/10.7910/DVN/YDBMNI.




Comments
No Comments have been published for this article.