Introduction
Parasites represent an easy and cost-effective method for gathering ecological and evolutionary information from their hosts (Williams et al., Reference Williams, MacKenzie and McCarthy1992; Arthur, Reference Arthur, Flegel and MacRae1997; MacKenzie & Abaunza, Reference MacKenzie, Abaunza, Cadrin, Friedland and Waldman2005). For this reason, parasites have been used successfully as population tags for marine fish species (Lester et al., Reference Lester, Sewell, Barnes and Evans1988, Reference Lester, Thompson, Moss and Barker2001; MacKenzie, Reference MacKenzie1990; George-Nascimento & Arancibia, Reference George-Nascimento and Arancibia1992, Reference George-Nascimento and Arancibia1994; Arthur & Albert, Reference Arthur and Albert1993; Boje et al., Reference Boje, Riget and Køie1997; George-Nascimento, Reference George-Nascimento2000; Blaylock et al., Reference Blaylock, Margolis and Holmes2003; Timi et al., Reference Timi, Luque and Sardella2005). A major field of application is stock discrimination: spatial and/or temporal comparison of parasite burdens allows delimitation of ecological stocks, i.e. subpopulations of fish distinguished by behavioural differences, but between which there may be a considerable amount of gene flow (Lester, Reference Lester1990; MacKenzie, Reference MacKenzie2002). This information is most valuable to fisheries because parasites help in identifying and managing discrete population units (Sindermann, Reference Sindermann1983; Lester, Reference Lester1990; Arthur, Reference Arthur, Flegel and MacRae1997). Recently, the use of parasites as tags has been extended to deal with traceability problems. Studies of traceability attempt to predict the harvest location of a sample of fish or, ideally, individual fish (Power et al., Reference Power, Balbuena and Raga2005). Traceability can thus become fundamental to control illegal, unreported and unregulated fishing (see, for example, Margolis, Reference Margolis1993), to solve fishing conflicts between neighbouring countries, and to provide confidence and safety to consumers.
The use of parasites for stock discrimination requires, first, selecting appropriate parasite species. Most authors agree that suitable candidate taxa should at least exhibit significantly different levels of infection between geographical areas, do not reproduce in or on their hosts, persist in or on them for long periods (>1 year) and maintain relatively constant levels of infection from year to year (Sindermann, Reference Sindermann1983; MacKenzie, Reference MacKenzie1983, Reference MacKenzie1987, Reference MacKenzie2002; Lester, Reference Lester1990; Moser, Reference Moser1991, Williams et al., Reference Williams, MacKenzie and McCarthy1992; Arthur, Reference Arthur, Flegel and MacRae1997; MacKenzie & Abaunza, Reference MacKenzie and Abaunza1998, Reference MacKenzie, Abaunza, Cadrin, Friedland and Waldman2005). However, these requirements are rarely found in most cases and, therefore, a compromise is usually sought (Sindermann, Reference Sindermann1983). Parasitological data can be analysed using univariate or multivariate methods. In the former, infection parameters (e.g. prevalence, mean abundance) of selected parasites are compared among regions (e.g. Leaman & Kabata, Reference Leaman and Kabata1987; Kabata et al., Reference Kabata, McFarlane and Whitaker1988; Hemmingsen et al., Reference Hemmingsen, Lombardo and MacKenzie1991; Moser & Hsieh, Reference Moser and Hsieh1992; Somdal & Schram, Reference Somdal and Schram1992; Stanley et al., Reference Stanley, Lee and Whitaker1992; Moore, Reference Moore2001), whereas in the latter, data from a subset of parasite species are combined in a single analysis. The multivariate technique most commonly used is discriminant analysis (Arthur & Arai, Reference Arthur and Arai1980; Arthur, Reference Arthur1983; Arthur & Albert, Reference Arthur and Albert1993; Boje et al., Reference Boje, Riget and Køie1997; Hoff et al., Reference Hoff, Nikolai and Baldanova1997; Blaylock et al., Reference Blaylock, Margolis and Holmes2003; Melendy et al., Reference Melendy, McClelland and Hurlbut2005). Traceability studies based on parasitological data are scarce but have also employed univariate and multivariate analyses. Margolis (Reference Margolis1993) used infection data from a brain myxosporean to identify the river of origin of sockeye salmon Oncorhynchus nerka. Recently, Power et al. (Reference Power, Balbuena and Raga2005) compared four different predictive techniques, i.e. linear and quadratic discriminant analysis, k-nearest neighbour and artificial neural networks to establish the harvest location of bogue Boops boops in Spanish waters.
Parasitological comparisons among fish samples are meaningful only if confounding factors affecting infection levels are controlled for. For instance, long-lived parasites tend to accumulate in larger (older) fish and, therefore, control for this effect is advisable when comparing samples with heterogeneous fish size (age) distribution (Lester et al., Reference Lester, Sewell, Barnes and Evans1988, Reference Lester, Thompson, Moss and Barker2001; George-Nascimento & Arancibia, Reference George-Nascimento and Arancibia1992, Reference George-Nascimento and Arancibia1994; Arthur & Albert, Reference Arthur and Albert1993; Boje et al., Reference Boje, Riget and Køie1997; Oliva & Ballón, Reference Oliva and Ballón2002; Blaylock et al., Reference Blaylock, Margolis and Holmes2003; Marcogliese et al., Reference Marcogliese, Albert, Gagnon and Sévigny2003; Timi, Reference Timi2003; Melendy et al., Reference Melendy, McClelland and Hurlbut2005; Williams & Lester, Reference Williams and Lester2006). Infection levels can also change among seasons or years, thus these variables can potentially confound spatial differences (Arthur & Arai, Reference Arthur and Arai1980; Leaman & Kabata, Reference Leaman and Kabata1987, Lester et al., Reference Lester, Sewell, Barnes and Evans1988; Hemmingsen et al., Reference Hemmingsen, Lombardo and MacKenzie1991; George-Nascimento & Arancibia, Reference George-Nascimento and Arancibia1992, Reference George-Nascimento and Arancibia1994; Moore, Reference Moore2001; Sardella & Timi, Reference Sardella and Timi2004). Although studies using parasites as markers usually deal with these types of problems, there might be a more subtle flaw that has seldom been addressed. Many studies carry out a single sampling of fish in several localities, then select suitable parasite species to investigate spatial discrimination, then identify potential stocks, or predict harvest locality, based on significant differences in infection levels (e.g. Arthur & Albert, Reference Arthur and Albert1993; Boje et al., Reference Boje, Riget and Køie1997; Oliva & Ballón, Reference Oliva and Ballón2002; Moore et al., 2003; Yamaguchi et al., Reference Yamaguchi, Yokoyama, Ogawa and Taniuchi2003; Sardella & Timi, Reference Sardella and Timi2004; Power et al., Reference Power, Balbuena and Raga2005; Timi et al., Reference Timi, Luque and Sardella2005). However, this procedure is just revealing differences among samples, thus it is implicitly assumed that infection levels will be more similar between repeated samples from the same locality than between samples from different localities. However, this might not be the case: further sampling in the same localities, but not exactly the same sites, could reveal wide small-scale spatial heterogeneity in infection levels that was missed with a single sampling or by pooling samples from the same localities. Technically, these studies suffer from a problem of pseudoreplication due precisely to the lack of sampling replication (Hulbert, 1984; Heffner et al., Reference Heffner, Butler and Reilly1996). This by no means implies that the inferences made are wrong; however, we submit that the problem of pseudoreplication is pervasive and should be considered more explicitly in sampling design and interpretation of data.
In this study we illustrate this problem based on a parasitological study of the striped red mullet Mullus surmuletus, a coastal demersal fish species with a high economic value, which is currently overexploited in the Spanish Mediterranean (FAO, 2004). We found significant differences in infection levels among localities, but when fish were sampled several times in the same localities, inter-sample variability clearly confounded differences among localities. The results suggest that, at least in this case, using unique samples or pooling data from several samples (two forms of pseudoreplication) may result in wrong inferences about stock structure and the ability to predict harvest localities.
Materials and methods
Samples
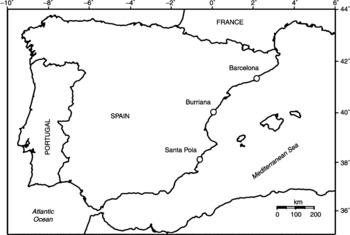
Fish were bought in three Mediterranean ports of Spain – Barcelona, Burriana and Santa Pola – separated from each other by c. 300 km (fig. 1). In each port, fish samples were collected in early summer and mid-autumn of 2003 and 2004. Sampling intervals never exceeded 15 days between localities. Fish were caught by trammel or bottom trawling by artisanal fishing boats. Boats returned to the port on the same day, and fishermen reported fishing areas covering a radius of 2–10 nm from the port. Fish were placed on ice until they arrived at the laboratory, where they were measured, wrapped individually in aluminium foil, bagged and frozen at − 20 °C until examination for parasites. To minimize the influence of host size on parasite infections, a subsample of 25 fish with a range of standard length (SL) from 12.9 to 17.0 cm was chosen per locality, season and year (300 fish total). Host mean SL ( ± SD) from Barcelona was 14.95 ± 8.53 cm, from Burriana 14.91 ± 8.15 cm, and from Santa Pola 14.84 ± 8.70 cm. Kruskal–Wallis and Kolmogorov–Smirnoff tests indicated no significant differences in median size and size distribution among samples, respectively (P>0.05).
Map of Spain showing sampling localities in the present study.

After thawing, the external surface of each fish was washed with saline. Gills were removed, rinsed in saline and the arches examined individually. Fish were then dissected and eviscerated, the internal surfaces and oral cavity being rinsed with saline. The heart, liver, spleen, kidney, urinary bladder, gonads and brain were separated, opened and rinsed with saline and examined for parasites. Likewise, the gut was divided into five parts (oesophagus, stomach, pyloric caeca, intestine and anus) and each part was washed in saline and examined separately. After examination, all organs listed above were pressed individually between glass plates and further examined for parasites.
Finally, the body musculature was removed and examined in the same way. All examinations were made under a stereomicroscope (6–40 × ). Parasites were fixed and conserved in 70% ethanol. Metazoan parasites were identified to the lowest taxonomic level possible. Trematodes and cestodes were stained with iron acetocarmine, dehydrated through an alcohol series, cleared in dimethyl phthalate and examined as permanent mounts in Canada Balsam. Nematodes and acanthocephalans were identified after being cleared in lactic acid.
Statistical analyses
For the study of stock discrimination we selected parasites with relatively high prevalence and/or abundance in at least one locality, and which were assumed to be long lived (>1 year) (see MacKenzie, Reference MacKenzie1983; McClelland & Marcogliese, Reference McClelland and Marcogliese1994). Hierarchical clustering was used to identify groups of samples based on the frequency of occurrence of these species (note that sample size is the same in all samples, 25 fish). We expected samples collected in the same locality to be clustered together. Frequency data were fourth-root transformed; then, Bray–Curtis resemblances between samples were calculated, and hierarchical clustering using a group average link was performed (Clarke & Gorley, Reference Clarke and Gorley2006). For completeness, we repeated the same analysis using the entire set of parasite species per sample. To obtain statistically significant evidence of genuine clusters, we carried out 1000 permutations with the Primer v.6 software (Clarke & Gorley, Reference Clarke and Gorley2006). This procedure tests whether each node of the complete dendrogram has ‘significant’ internal structure (for details see Clarke & Gorley, Reference Clarke and Gorley2006).
We compared abundance data of each long-lived parasite species among localities using a Kruskal–Wallis test. Species showing significant differences were selected for a MANOVA using locality, season and year as factors. Our goal was to check whether differences between localities were consistent regardless of season and year (i.e. that no significant interaction between locality and the other two factors occurred) and, therefore, the three factors were considered as fixed (see Newman et al., Reference Newman, Bergelson and Grafen1997). Parasite data were non-normal even after transformations. We therefore adopted the procedure suggested by Conover (Reference Conover1999): we performed the analysis with fourth-root transformed data (the transformation that best approached normality), and with rank-transformed data; results were then interpreted in the light of both analyses. Note that MANOVA on ranked variables is proven to have good performance when compared with the parametric alternative if parametric assumptions are violated (Finch, Reference Finch2005). Analyses were made with SPSS 14.0 software (SPSS Inc., Chicago, Illinois, USA).
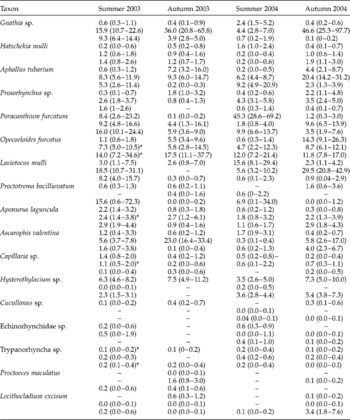
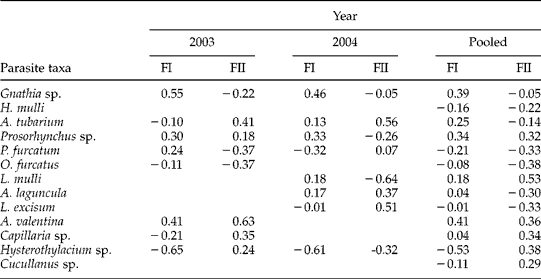
For the analysis of traceability we performed Linear Discriminant Analyses (LDA) based on log-transformed abundance [log10(x+1)] of parasite taxa with prevalence >5% in at least one sample (17 taxa) (table 1). The goal was to assess the success at predicting the locality of fish captures. Predictive power was measured as the percentage of fish correctly assigned to their locality. We considered three scenarios. First, stepwise LDAs were carried out using a subset of data from each year. Second, a single stepwise LDA was performed for the entire dataset. In both cases, the stability of predictions (i.e. the lack of overfitting) was assessed with two methods. First, we predicted the locality of each individual fish using a leaving-one-out method with the SPSS 14.0 software. Second, we obtained 2000 bootstrapped LDAs with the SYSTAT 11.0 software (Systat Software Inc., Hounslow, London, UK), and then we calculated the mean and 95% confidence interval of percent correct assignation, both globally and for each locality.
Mean abundance (95% confidence interval based on 20,000 replications) of 17 parasite taxa found in four samples of 25 red striped mullets Mullus surmuletus collected in three localities of the Spanish Mediterranean (n=300). For each parasite taxon: upper row, Barcelona; middle row, Burriana; lower row, Santa Pola.

* Indicates cases in which the 95% confidence interval (CI) overlapped in the four samples.
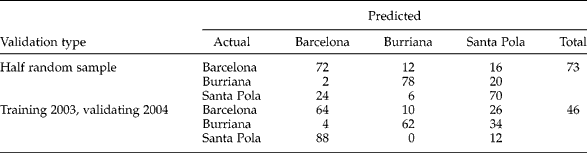
A third cross-validation procedure was devised to assess specifically the possibility of pseudoreplication. We partitioned the entire data sample into a training subset made up from 75 fish chosen randomly from each locality (n = 150). An LDA was applied to these data, and the resulting discriminant functions were used to predict the harvest locality of the other half data set (n = 50). Alternatively, we used samples from 2003 (n = 150) to build the discriminant functions and used them to predict harvest locality of samples from 2004.
We used Sterne's exact method to set 95% confidence intervals (CI) for prevalence (Reiczigel, Reference Reiczigel2003) and 20,000 bootstrap replications to set 95% CIs for mean abundance of each parasite taxon (Rózsa et al., Reference Rózsa, Reiczigel and Majoros2000).
Results
Infection parameters per sample of the 17 most prevalent parasite taxa found in striped red mullets are shown in table 1. All but five parasite taxa reproduce in mullets, since adults were found. The parasite fauna was dominated by digeneans (nine species) and nematodes (four species). Copepods, isopods, acanthocephalans and cestodes were each represented by a single taxon. No qualitative differences of parasite fauna were found among localities (table 1). However, there were substantial changes in the mean abundance of most parasite taxa among samples from the same locality. The 95% CI of mean abundance overlapped among samples only in 6 out of 32 cases per parasite taxa per locality (note that in 19 cases, parasites were absent in at least one locality and no comparison was made) (table 1).
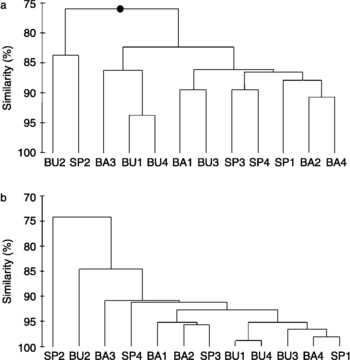
Four metazoan parasites were preliminarily selected for stock discrimination, i.e. metacercariae of Aphallus tubarium and Prosorhynchus sp. (encysted in the musculature), larvae of the nematode Hysterothylacium sp. (encysted in the mesenterium), and larvae of the cestode Trypanorhyncha sp. (encysted in the musculature) (table 1). We found significant differences in prevalence of all species (Fisher's Exact test, P < 0.00 001) except Trypanorhyncha sp. (P = 0.98). However, a cluster analysis based on the prevalence of the three former species indicated no clear spatial segregation of samples by locality (fig. 2a). The permutation test identified two significant clusters, namely, the autumn samples from Burriana and Santa Pola, 2003, and the remaining samples (fig. 2a). When the cluster analysis was repeated using the prevalence data from the 17 parasite taxa, no spatial segregation of samples was apparent, and no significant clusters of samples were found (fig. 2b).
Cluster analysis of parasite prevalence data from 12 samples of Mullus surmuletus collected in three localities. Initials identify locality: BA, Barcelona; BU, Burriana; SP, Santa Pola; and numbers identify period: 1, summer 2003; 2, autumn 2003; 3, summer 2004; 4, autumn, 2004). (a) Analysis based on prevalence of three long-lived parasite taxa; (b) analysis based on prevalence of 17 parasite taxa (see text for details).

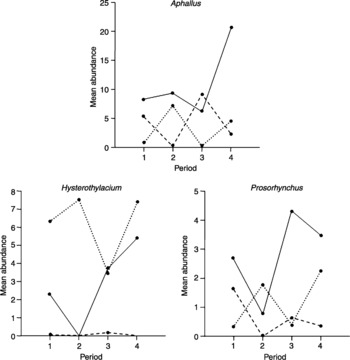
Kruskal–Wallis tests also indicated highly significant differences among localities in the abundance of A. tubarium (chi-square = 84.2, 2 df, P < 0.00 001) Prosorhynchus sp. (chi-square = 56.1, P < 0.00 001) and Hysterothylacium sp. (chi-square = 146.2, P < 0.00 001), but not Trypanorhyncha sp. (chi-square = 0.17, P = 0.92). However, mean abundance of the three former species varied sharply among samples within the same locality, and no consistent differences were found between localities (fig. 3). This pattern was confirmed statistically by MANOVA. Analyses using fourth-root transformed abundances or ranked abundances rendered the same qualitative patterns. The results obtained with fourth-root transformed data indicated highly significant interactions between locality and season (F (6,572) = 21.1, P < 0.0001), locality and year (F (6,572) = 18.5, P < 0.0001), and locality, year and season (F (6,572) = 4.3, P < 0.0001). (Univariate results are omitted for brevity.)
Plots showing mean abundance of three long-lived parasites of Mullus surmuletus per locality and period. Dotted line, Barcelona; solid line, Burriana; broken line, Santa Pola. Periods: 1, summer 2003; 2, autumn 2003; 3, summer 2004; 4, autumn: 2004. 95% Confidence intervals of means are omitted for clarity but are shown in table 1.

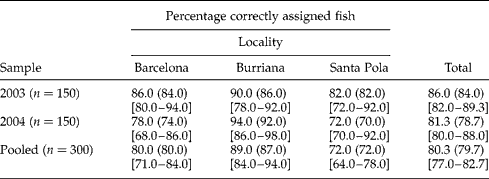
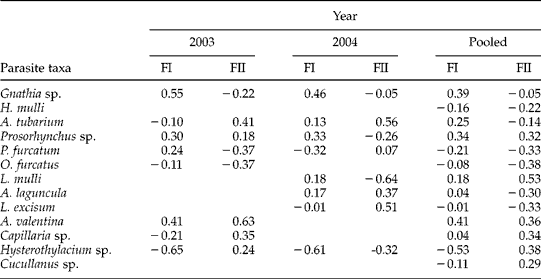
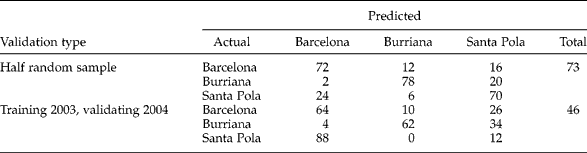
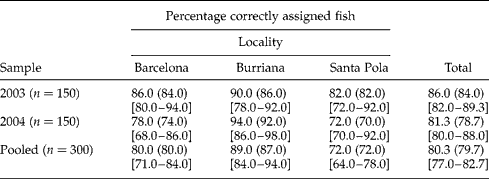
Separate stepwise LDAs with abundances of 17 parasite species in 2003 and 2004 correctly assigned 86.0% [95% CI 85.8 (82.0–89.3)] and 81.3% [95% CI 84.4 (80.0–88.0)] of fish, respectively, to their harvest localities (table 2). In the LDA using pooled data from both years, the overall percentage of success was 80.3% [95% CI 79.8 (77.0–82.7)] (table 2). Predictive success was similar among localities, and no signs of overfitting were found because leave-one-out percent estimates were similar to the observed values, and bootstrap confidence intervals were narrow (table 2). It is important to emphasize that the parasite taxa selected for discrimination differed in each analysis (table 3). When a half of the overall sample was randomly selected to build the LDA, and a half to evaluate predictive success, 73% of fish were correctly assigned to their harvest locality (table 4). However, predictive power dropped considerably when data from 2003 were used to build discriminant functions and to assign fish from 2004: only 46% fish of the overall sample were correctly assigned to locality, with values per locality ranging from 12% (Santa Pola) to 64% (Burriana).
Percent correctly assigned individual striped red mullets Mullus surmuletus using linear discriminant analysis based on the abundance of 17 metazoan parasite taxa. Values in parentheses represent the percentage of correctly assigned fish using the leave-one-out method; values in square brackets are the 95% confidence intervals calculated from 2000 bootstrap samples.
Classification results of linear discriminant analysis showing percentage striped red mullets correctly assigned to their harvest locality after two validation procedures: (1) a half of the total sample (n=300) collected from 2003 and 2004 was randomly selected to build the discriminant functions, and the other half to validate predictions; (2) the sample of 2003 (n=150) was used to build discriminant functions, and the sample of 2004 (n=150) to validate predictions.
Discussion
Composition of the metazoan parasite fauna of M. surmuletus was similar between the three localities analysed in this study and, therefore, no qualitative differences could be used to define stocks or to trace the geographical origin of fish samples. Regarding quantitative data, there were contrasting results depending on the method of analysis. When data from each locality were pooled, clear differences in infection levels of long-lived species were observed among localities, and LDAs based on all parasite taxa could predict harvest locality with reasonable success. However, this procedure is misleading because it omits consideration of the actual sampling design. In fact, we found highly significant variability of infection levels of most parasite taxa among samples, even those collected from the same locality. Moreover, neither cluster analysis based on prevalence of long-lived species, nor the MANOVA based on their mean abundances allowed us to find consistent differences between different localities. In other words, stock delimitation was not possible at the spatial scale of locality (c. 300 km). On the other hand, prediction of harvest locality was extremely poor when fish for training LDAs and fish whose locality was to be predicted came from different years. This result demonstrated that traceability of red striped mullets based on parasitological data was unreliable.
The high variability of infection levels between striped red mullet samples could result from the interplay of three factors. First, red striped mullets are presumably exposed to a limited pool of parasites due to their sedentary habits. After pelagic larval and juvenile stages (Deudero, Reference Deudero2002), striped red mullets are recruited to benthic habitats where they only undergo ontogenetic short-distance movements to deeper waters (Machias et al., Reference Machias, Somarakis and Tsimenides1998). The size range of fish analysed in this study was almost identical among samples (13–17 cm of SL) and probably corresponds to an age range of 1–2 years (Morales-Nin, Reference Morales-Nin1991). Second, transmission rates of most parasites are expected to vary on very small spatial scales. In the Spanish Mediterranean, the abundance of macrobenthic invertebrates and demersal fish varies significantly at scales from hundreds of metres to a few kilometres (e.g. Sánchez-Jerez et al., Reference Sánchez-Jerez, Barberá Cebrián and Ramos Esplá1999; Valle et al., Reference Valle, Bayle Sempere and Ramos Esplá2001; Arroyo et al., Reference Arroyo, Salas, Rueda and Gofas2006; Moranta et al., Reference Moranta, Palmer, Morey, Ruiz and Morales-Nin2006). Benthic invertebrates, particularly molluscs, act as putative intermediate hosts for most parasites found in striped red mullets, whereas the local fish community may define different patterns of parasite exchange between mullets and other fish (see Marcogliese, Reference Marcogliese2002). Part of the observed variability of infecting levels between samples could also be associated with temporal changes. For instance, the structure of local benthic–demersal communities can change significantly between seasons (Pinedo et al., Reference Pinedo, Sardá and Martín1996; Rueda et al., Reference Rueda, Fernández-Casado, Salas and Gofas2001), and this would also influence parasite transmission. Finally, in the localities of study, trammel and bottom trawl fisheries deploy their gear in sites separated by a few kilometres within their operational range, and these sites change from day to day (E. Ferrer-Castelló, personal observation). In other words, we hypothesize that each of the fish samples of this study was composed of individuals that had been exposed to small-scale patches (in the range of a few kilometres at most) in which transmission varied significantly. The sedentary habits of mullets would hamper substantial mixing of fish and, therefore, variability of infection levels, even of the long-lived parasites, would be maintained from sample to sample. In summary, small-scale spatial variability of parasite communities is so high that it confounds differences between localities.
The realization that sampling programmes for parasites of marine fish must account for small-scale spatial variation is not new (see, for example, Grutter, Reference Grutter1998), but our study demonstrates that studies on stock discrimination and fish traceability could benefit greatly from an understanding of variability of infection levels at different spatial scales. Studies using parasites as population tags have relied increasingly on sampling designs in which single samples of fish are compared among localities (Arthur & Albert, Reference Arthur and Albert1993; Boje et al., Reference Boje, Riget and Køie1997; Oliva & Ballón, Reference Oliva and Ballón2002; Yamaguchi et al., Reference Yamaguchi, Yokoyama, Ogawa and Taniuchi2003; Sardella & Timi, Reference Sardella and Timi2004; Power et al., Reference Power, Balbuena and Raga2005; Timi et al., Reference Timi, Luque and Sardella2005). If we had followed this scheme, we could have concluded that at least three parasite taxa (Aphallus tubarium, Prosorhynchus sp. and Hysterothylacium sp.) are useful to discriminate stocks of striped red mullet, or that parasite assemblages have remarkable success in predicting the harvest locality. However, both conclusions are obviously unwarranted. The case of striped red mullet is particularly clear because it is a demersal species with sedentary habits. In other studies, conclusions based on single comparisons of parasite fauna appear to be ecologically sound (e.g. in the case of migratory species) and are sometimes supported by other population markers. Still, it is important to remind ourselves that many of these studies suffer from a pseudoreplication problem (see Millar & Anderson, Reference Millar and Anderson2004). For this reason, we strongly recommend proper sampling replication on several spatial and temporal scales whenever possible. This seems to us the best way to obtain useful knowledge for the management of fishery resources.
Acknowledgements
We especially thank Aneta Kostadinova for fundamental technical support and advice. Thanks are also due to Vicente Chiva, Estebán Antón, Francisco Devesa, Juan Antonio Balbuena for their assistance in collecting fish samples, and Tamara García, Gema Alama, Beatriz García, María José Faus, Oscar Sanisidro, Daniel Jareño for assistance in parasitological analysis. This project was supported by Project REN2003-1758 of the Ministry of Education and Science of Spain (MEC) and the Project A/3003/05 of the Spanish Agency for International Cooperation (Ministry of Foreign Affairs). E. F-C. benefits from a FPU grant, and F.J.A., from a ‘Ramón y Cajal’ Contract, from the MEC.