Introduction
The ability of individuals to manage emotional experience and to adapt to a specific emotional context is disturbed in many psychiatric illnesses (APA, 2000; Bannon et al. Reference Bannon, Gonsalvez, Croft and Boyce2002). In so-called emotion regulation disorders like major depression, anxiety, and obsessive compulsive disorder (OCD) such disturbances are a central characteristic of the disease (Bannon et al. Reference Bannon, Gonsalvez, Croft and Boyce2002; Blair et al. Reference Blair, Geraci, Hollon, Otero, DeVido, Majestic, Jacobs, Blair and Pine2010). These disturbances are reflected in neurobiological abnormalities (Fan & Xiao, Reference Fan and Xiao2013; Bruhl et al. Reference Bruhl, Delsignore, Komossa and Weidt2014; Dutta et al. Reference Dutta, McKie and Deakin2014).
In OCD patients, obsessions are characterized by recurrent, persistent and irrational impulses, thoughts and images that cause significant negative emotions (APA, 2000). Compulsions are characterized by repetitive, ritualistic behaviours or mental acts that the patients feels obliged to perform to prevent harm, reduce negative emotions or neutralize obsessive thoughts (Bannon et al. Reference Bannon, Gonsalvez, Croft and Boyce2002).
Social anxiety disorder (SAD) patients are afraid of and avoid situations associated with potential exposure to unfamiliar social conditions (APA, 2000).
In OCD patients there is growing evidence of orbitofrontal-striatal abnormalities compared to healthy control (HC) subjects (Kwon et al. Reference Kwon, Jang, Choi and Kang2009). Regional blood flow in the prefrontal cortex, insular (Schienle et al. Reference Schienle, Schafer, Stark, Walter and Vaitl2005), and anterior cingulate cortex (ACC; Morgieve et al. Reference Morgieve, N'Diaye, Haynes, Granger, Clair, Pelissolo and Mallet2014) has been found to be enhanced. Further evidence for orbitofrontal abnormalities comes from diffusion tensor-imaging studies that generally report microstructural alterations of the orbitofrontal cortex (OFC), ACC and prefrontal cortex (Piras et al. Reference Piras, Piras, Caltagirone and Spalletta2013). Such fronto-striatal abnormalities are hypothesized to underlie executive deficits in OCD patients (de Wit et al. Reference de Wit, de Vries, van der Werf, Cath, Heslenfeld, Veltman, van Balkom, Veltman and van den Heuvel2012; Gillan et al. Reference Gillan, Apergis Schoute, Morein Zamir, Urcelay, Sule, Fineberg, Sahakian and Robbins2015). Evidence for alterations in limbic circuits, particularly amygdala and insula, is scarce (Holzschneider & Mulert, Reference Holzschneider and Mulert2011).
In SAD, a recently published meta-analysis confirmed the hyper-reactivity of amygdala, insular cortex, ACC, and dorsolateral prefrontal cortex (DLPFC) compared to HCs; regardless whether specific or unspecific emotional stimuli were used during functional magnetic resonance imaging (fMRI; Bruhl et al. Reference Bruhl, Delsignore, Komossa and Weidt2014). This confirms models of a hyper-reactive limbic system, which is not only hypersensitive to specific feared stimuli (i.e. negative faces) but to emotional stimuli in general (Shah et al. Reference Shah, Klumpp, Angstadt, Nathan and Phan2009; Bruhl et al. Reference Bruhl, Rufer, Delsignore, Kaffenberger, Jancke and Herwig2011).
Taken together, fMRI studies suggest differential mechanisms in OCD and SAD but also overlapping abnormalities. However, studies directly comparing neurobiological similarities and differences between OCD and anxiety disorders have rarely been performed (Rauch et al. Reference Rauch, Savage, Alpert, Fischman and Jenike1997).
To investigate common and distinctive alterations in emotion processing in OCD and SAD we employed a paradigm involving the cued anticipation and perception of emotional stimuli (Bruhl et al. Reference Bruhl, Rufer, Delsignore, Kaffenberger, Jancke and Herwig2011). Notably, we used emotional pictures that were general and unspecific in content, chosen not to be provocative of social fears (e.g. angry/disapproving face) or of OCD (e.g. disorganized scene) and to be unambiguous in valence. Stimuli related to either one of the disorders would clearly have biased the circuits towards the respective disorder and would therefore have been difficult to compare across the disorders (Peterson et al. Reference Peterson, Thome, Frewen and Lanius2014). Many symptoms in OCD and anxiety disorders are not only evoked when actually facing a provoking stimulus, but also during the anticipation of these situations (Reuther et al. Reference Reuther, Davis, Rudy, Jenkins, Whiting and May2013; Rotge et al. Reference Rotge, Langbour, Dilharreguy, Bordessoulles, Guehl, Bioulac, Martin-Guehl, Jaafari, Aouizerate, Allard and Burbaud2015). Therefore, we used the cued anticipation and perception of general unspecific emotional stimuli as a model to investigate the network involved in general emotion processing across disorders.
Our first aim was to compare a combined patient group (OCD and SAD) with HCs to find general abnormalities in brain function across both groups. The second aim was to compare OCD and SAD patients to identify neurobiological differences between these diseases.
Our hypotheses were: (1) Emotion processing circuits (e.g. amygdala and insula) in the combined OCD-SAD patient group will be hyper-reactive compared to HCs. (2) Due to the scarcity of systematic studies on emotional stimuli (unspecific or specific) comparing OCD and anxiety disorders, hypotheses of the direction of differential activation in certain regions of interest (ROIs) were difficult to reach. Taking studies comparing patients with HCs and mostly using specific stimuli as a basis, OCD patients would show hyper-reactivity in the striatum, caudate, ventromedial prefrontal cortex (VMPFC) and OFC compared to SAD patients, and SAD patients would show stronger activations in amygdala, and DLPFC compared to OCD patients. A further ROI was the rostral ACC.
Method and materials
Subjects
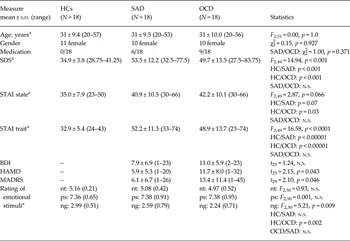
Fifty-four subjects participated in the study: 18 outpatients with a current diagnosis of OCD, 18 outpatients with a current diagnosis of generalized SAD, and 18 HCs. Participants in the three groups were matched for age and gender (Table 1). All participants gave their written consent prior to study procedures. All participants were right-handed (Annett, Reference Annett1970). OCD and SAD were diagnosed by experienced clinicians and confirmed using the Mini International Neuropsychiatric Interview (M.I.N.I.; Sheehan et al. Reference Sheehan, Lecrubier, Sheehan, Amorim, Janavs, Weiller, Hergueta, Baker and Dunbar1998). HCs were screened for the absence of any current or previous mental and neurological disorders in a semi-structured clinical interview based on the M.I.N.I.
Demographic and psychometric description of the participants

HCs, Healthy controls; SAD, social anxiety disorder; OCD, obsessive compulsive disorder; SDS, Self-rating Depression Scale; STAI, State-Trait Anxiety Inventory; BDI, Beck Depression Inventory; HAMD, Hamilton Depression Scale; MADRS, Montgomery–Asberg Depression Rating Scale; nt, neutral; ps, positive; ng, negative.
a ANOVA with post-hoc comparisons.
SAD and OCD patients did not differ in their self-ratings for state and trait anxiety (State-Trait Anxiety Inventory; Spielberger et al. Reference Spielberger, Gorsuch and Lushene1970) or depressive symptoms [Self-rating Depression Scale (SDS; Zung, Reference Zung1965); and Beck Depression Inventory (BDI; Beck et al. Reference Beck, Ward, Mendelson, Mock and Erbaugh1961)] (Table 1). OCD patients showed higher depression levels than SAD patients in the clinical interview ratings [Hamilton Depression Scale (HAMD; Hamilton, Reference Hamilton1960) and Montgomery–Asberg Depression Rating Scale (MADRS; Montgomery & Asberg, Reference Montgomery and Asberg1979)]. The severity of depression was on average mild and not clinically relevant.
Patient groups did not differ in their medication level: nine patients of the OCD group were medicated with antidepressants (SSRI, n = 8; SNRI, n = 1) and six patients of the SAD group were medicated with antidepressants (SSRI, n = 5; SNRI, n = 1), (χ2 = 1.0, p = 0.371, df = 1). Most of the OCD patients reported obsessions and compulsion, two obsessions only and five compulsions only. We did not include patients with predominant hoarding symptoms.
Exclusion criteria for all subjects were pregnancy, medication other than antidepressants, psychiatric diagnoses other than OCD/SAD and depression (OCD/SAD had to be the prior diagnosis), neurological disorders, head trauma, excessive use or dependency of alcohol, cigarettes, caffeine and illegal drugs, and contraindications for fMRI.
Experimental design
During fMRI, subjects performed an emotional anticipation and perception task that allows investigation of the anticipation and perception phase separately (for references see Bruhl et al. Reference Bruhl, Herwig, Delsignore, Jancke and Rufer2013). The task consists of 56 trials that each start with a cue (duration 1000 ms) depicting either a ‘positive’ symbol (∪), a ‘negative’ symbol (∩), or ‘neutral’ symbol (–) indicating the emotional valence of the upcoming picture, or a symbol (|) indicating ‘unknown’ (after which either a negative or positive picture appears, 50% chance). After the cue a blank black screen with a white fixation cross appeared for 6920 ms (cue + anticipation = 7920 ms = 4 MRI volumes/TR). Thereafter, the respective emotional picture from the International Affective Picture System (IAPS; Lang et al. Reference Lang, Bradley and Cuthbert2005) was presented for 7920 ms (4 × TR). A baseline period of 15 840 ms (8 × TR) allowed the mean blood oxygen level-dependent (BOLD) signal to wear off before the next trial. Each of the conditions (positive, negative, neutral, unknown) comprised 14 trials in a pseudo-randomized order. Subjects were instructed to consciously anticipate the cued emotional picture (anticipation) and then look at the presented emotional picture (perception). Because some of the negative pictures contained blood and other disgust-evoking aspects; after the scan, the participants were presented the stimuli again and were asked to rate them on valence for a 9-point Likert scale ranging from 1 (negative) to 9 (positive) and to report whether the pictures provoked typical disorder symptoms.
fMRI acquisition
Imaging was performed with a 3.0 T GE Signa HD Scanner (GE Medical Systems, USA, 8-channel head coil). Echo-planar imaging (EPI) was performed for fMRI [repetition time (TR)/echo time (TE) 1980/32 ms, 22 sequential axial slices, whole brain, slice thickness/gap 5/0.5 mm, voxel size 3.4 × 3.4 × 5.0 mm, field of view 220 mm]. Altogether, 908 volumes were obtained within one run, 16 per trial. High-resolution 3D T1-weighted anatomical volumes were acquired (TR/TE 9.9/2.9 ms; voxel size 1 × 1 × 1 mm, axial orientation) for co-registration with the functional data. Stimuli were presented via digital goggles (Resonance Technologies, USA). In addition, T2-weighted anatomical volumes were acquired to detect potential T2-sensitive brain abnormalities.
fMRI analysis and statistics
fMRI data were analysed using Brain Voyager QX 2.6 (Brain Innovation, The Netherlands; Goebel et al. Reference Goebel, Esposito and Formisano2006). Preprocessing of the functional scans included motion correction, slice scan-time correction, high-frequency temporal filtering, and linear detrending. The design matrix contained nine predictors [baseline; anticipation and perception of each positive (ps), negative (ng), neutral (nt), and unknown (uk) stimuli].
A hypothesis-driven ROI analysis within predefined spherical ROIs was performed. Anatomical ROIs were as follows: amygdala [according to the Talairach Client applet (Lancaster et al. Reference Lancaster, Woldorff, Parsons, Liotti, Freitas, Rainey, Kochunov, Nickerson, Mikiten and Fox2000), diameter 10 mm, 515 mm3, centre x, y, z = 19/−9, −5, −17], caudate head/body (defined by averaging the clusters reported by van den Heuvel et al. Reference van den Heuvel, Mataix-Cols, Zwitser, Cath, van der Werf, Groenewegen, van Balkom and Veltman2011 and Gillan et al. Reference Gillan, Apergis Schoute, Morein Zamir, Urcelay, Sule, Fineberg, Sahakian and Robbins2015), transformation of MNI to Talairach coordinates using the Yale BioImage Suite (Lacadie et al. Reference Lacadie, Fulbright, Rajeevan, Constable and Papademetris2008), diameter 10 mm, 515 mm3, centre x, y, z = 10/−10, 14, 8), rostral ACC (according to Liu et al. Reference Liu, Hairston, Schrier and Fan2011: diameter 10 mm, 515 mm3, centre x, y, z = 7/−7, 26, 24), DLPFC (according to Veltman et al. Reference Veltman, Rombouts and Dolan2003: diameter 15 mm, 1791 mm3, centre x, y, z = 42/−42, 10, 34), anterior insula (according to Greenberg et al. Reference Greenberg, Carlson, Rubin, Cha and Mujica-Parodi2015: diameter 15 mm, 1791 mm3, centre x, y, z = 34/−34, 13, 4), and VMPFC/OFC (according to Stern et al. Reference Stern, Welsh, Fitzgerald, Gehring, Lister, Himle, Abelson and Taylor2011: diameter 20 mm, 4169 mm3, centre x, y, z = 0, 44, −2).
On the subject-level, fixed-effects analyses were calculated for the anticipation phase including the contrasts ‘positive’ v. ‘neutral’ (aps > ant), ‘negative’ v. ‘neutral’ (ang > ant), and ‘unknown’ v. ‘neutral’ (auk > ant), and for the perception phase including the contrasts ‘positive’ v. ‘neutral’ (pps > pnt), and ‘negative’ v. ‘neutral’ (png > pnt). On the group level, we computed random-effects models for the comparison between OCD-SAD v. HCs and OCD v. SAD. In the first model we investigated general disorder effects extracting the mean beta-weights of each of the ROIs and compared these between the combined OCD-SAD patient group and HCs. In the second model we compared the mean beta-weights of each of the ROIs between OCD and SAD. To control for multiple comparisons, we applied the Benjamini–Hochberg procedure using a false discovery rate (FDR) of q = 0.1, which is similarly conservative as the Bonferroni comparison (McDonald, Reference McDonald2014). Differences in all group comparisons were conducted in SPSS v. 22 (SPSS Inc. USA), using Student's t tests as well as two separate mixed ANOVAs for the anticipation and the perception period with the between-subjects factor ‘group’ (i.e. HCs v. SAD/OCD) and the within-subjects factors ‘condition’ (i.e. aps > ant/ang > ant/auk-ant and pps > pnt/png > pnt, respectively).
Ethical standards
The authors assert that all procedures contributing to this work comply with the ethical standards of the relevant national and institutional committees on human experimentation and with the Helsinki Declaration of 1975, as revised in 2008. The study was approved by the ethics committee of the Canton of Zurich.
Results
Picture rating
All participants rated the pictures in accordance with the valence (Table 1). We found no group difference in the rating of the neutral and positive stimuli between the groups. OCD patients rated the negative pictures significantly more negative than HCs, but not different from SAD patients. They reported that the pictures did not evoke OCD typical symptoms and there was no correlation between the subjective ratings and the activity in amygdala and insula (data not shown).
Brain regions with differential activation in the combined OCD-SAD group compared to HCs
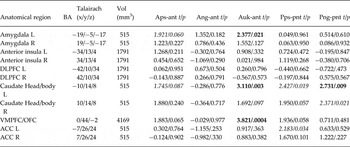
In this group comparison (Table 2), the strongest differences were found in the left caudate head/body, where the anticipation of unknown, potentially negative stimuli as well as the perception of both negative stimuli resulted in a significantly stronger activation in the OCD-SAD patients than in HCs. During the unknown anticipation, OCD-SAD patients showed similarly increased activation compared to HCs in VMPFC and left amygdala. There were no ROIs in which HCs activated significantly stronger than OCD-SAD patients. The results of the mixed ANOVAs were identical and are given in the supplementary material (Supplementary Table S1, Supplementary Fig. S1). There was no significant main effect of depression (SDS) and no interaction between SDS and condition in the ANOVA. There was no correlation between the beta-weights in the ROIs and the scores of depression (SDS) and trait anxiety (STAI-T) across the groups.
Common differences in OCD-SAD patients compared to healthy controls
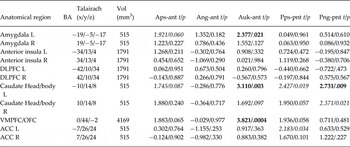
OCD, Obsessive compulsive disorder; SAD, social anxiety disorder; aps, anticipation of positive stimuli; ant, anticipation of neutral stimuli; ang, anticipation of negative stimuli; auk, anticipation of unknown stimuli; pps, perception of positive stimuli; pnt, perception of neutral stimuli; png, perception of negative stimuli, L, left, R, right; DLPFC, dorsolateral prefrontal cortex; VMPFC/OFC, ventromedial prefrontal cortex/orbitofrontal cortex; ACC, rostral anterior cingulate cortex. Contrasts marked in bold/underlining are statistically significant. Statistical threshold: q < 0.1 (FDR corrected), contrasts given in italics are significant at corrected trend level (q < 0.25 FDR).
Comparison between the patient groups
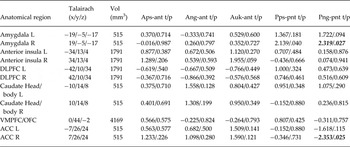
Overall, we found fewer differences between the two patient groups than between the combined OCD-SAD patient group and HCs. We found no significant differences between SAD and OCD during the anticipation. During the perception of emotional stimuli, the right amygdala was more active in OCD for negative stimuli, with a trend during the positive perception condition. At a trend level the right rostral ACC was less active during the perception of negative stimuli in OCD patients (Table 3).
Differences between the two disorders (OCD > SAD)
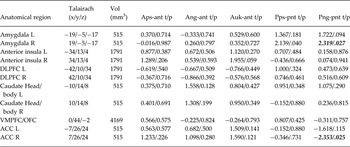
OCD, Obsessive compulsive disorder; SAD, social anxiety disorder; aps, anticipation of positive stimuli; ant, anticipation of neutral stimuli; ang, anticipation of negative stimuli; auk, anticipation of unknown stimuli; pps, perception of positive stimuli; pnt, perception of neutral stimuli; png, perception of negative stimuli, L, left, R, right; DLPFC, dorsolateral prefrontal cortex; VMPFC/OFC, ventromedial prefrontal cortex/orbitofrontal cortex; ACC, rostral anterior cingulate cortex. Contrasts marked in italics/underlining are statistically significant at corrected trend level (q < 0.25 FDR).
Discussion
To our knowledge, this is the first study to compare the neural correlates of general emotion processing in OCD and SAD with disease-unspecific emotional stimuli. Our aim was to reveal common and differential neurobiological alterations in emotional processing in patients with OCD and SAD during anticipation and perception of these emotional stimuli.
The main findings when comparing the combined OCD-SAD patient group to HCs were the hyper-reactivity in left amygdala, caudate, and VMPFC/OFC during the anticipation period in the OCD-SAD patient group. During the perception period we found a higher activation of the caudate in the combined OCD-SAD patient group.
The comparison between the patient groups revealed no differences during the anticipation of emotional stimuli. During the perception, the amygdala was more and the rostral ACC less activated in OCD than in SAD patients. Our results are consistent with our hypotheses that emotion processing circuits are more strongly activated in OCD-SAD patients than in HCs when perceiving unspecific emotional stimuli. However, differences between OCD and SAD were rather small and did not demonstrate the hypothesized hyper-reactivity of the limbic circuit in SAD or of fronto-striatal areas in OCD.
Common alterations in OCD and SAD patients compared to HCs
As hypothesized, activation in the amygdala and VMPFC/OFC was higher in OCD-SAD patients than in HCs during the anticipation of ‘unknown’ stimuli. The amygdala has been consistently found to be hyper-reactive in patients with SAD and OCD compared to HCs in response to emotional stimuli (Cardoner et al. Reference Cardoner, Harrison, Pujol, Soriano-Mas, Hernandez-Ribas, Lopez-Sola, Real, Deus, Ortiz, Alonso and Menchon2011; Bruhl et al. Reference Bruhl, Delsignore, Komossa and Weidt2014; Simon et al. Reference Simon, Adler, Kaufmann and Kathmann2014), potentially reflecting a common alteration in both diseases and also in other emotion regulation disorders, like major depression (e.g. Grotegerd et al. Reference Grotegerd, Stuhrmann, Kugel, Schmidt, Redlich, Zwanzger, Rauch, Heindel, Zwitserlood, Arolt, Suslow and Dannlowski2014).
The VMPFC/OFC is supposedly involved in emotion processing, particularly in attributing salience during the anticipation of stimuli (Diekhof et al. Reference Diekhof, Kaps, Falkai and Gruber2012). Previous studies have reported stronger activation in SAD and OCD (Adler et al. Reference Adler, McDonough-Ryan, Sax, Holland, Arndt and Strakowski2000; Quadflieg et al. Reference Quadflieg, Mohr, Mentzel, Miltner and Straube2008; Blair et al. Reference Blair, Geraci, Hollon, Otero, DeVido, Majestic, Jacobs, Blair and Pine2010), meta-analyses in SAD (Bruhl et al. Reference Bruhl, Delsignore, Komossa and Weidt2014) and OCD (Rotge et al. Reference Rotge, Guehl, Dilharreguy, Cuny, Tignol, Bioulac, Allard, Burbaud and Aouizerate2008) and support the increased sensitivity of emotion processing circuits as a common feature.
In our study, during the anticipation of ‘unknown’ emotional stimuli the caudate was significantly more activated in the combined patient group compared to HCs, but not different between the OCD and SAD patients. For HCs, there is evidence of an involvement of the caudate in emotional processing (Alexander et al. Reference Alexander, Crutcher and DeLong1990; Arsalidou et al. Reference Arsalidou, Duerden and Taylor2013). In SAD, a recently published meta-analysis reported mixed results in the caudate compared to HCs (Bruhl et al. Reference Bruhl, Delsignore, Komossa and Weidt2014). In OCD the majority of studies found increased reactivity in the caudate (Rauch et al. Reference Rauch, Jenike, Alpert, Baer, Breiter, Savage and Fischman1994; Saxena et al. Reference Saxena, Brody, Maidment, Smith, Zohrabi, Katz, Baker and Baxter2004). Taken together, our results and results of previous studies suggest that the caudate plays a role in emotional processing and is part of the emotion processing circuit.
Unexpectedly, insula activation did not differ between HCs and OCD-SAD patients. Insula activation has not only been found to be increased in patients suffering from SAD and OCD (Schienle et al. Reference Schienle, Schafer, Stark, Walter and Vaitl2005; Bruhl et al. Reference Bruhl, Delsignore, Komossa and Weidt2014), but also in anxious HCs during the anticipation of ‘aversive’, ‘positive’ and ‘uncertain’ stimuli (Simmons et al. Reference Simmons, Stein, Strigo, Arce, Hitchcock and Paulus2011). Previous studies using disease-unspecific stimuli reported mixed results of insula hypo-activation (Sareen et al. Reference Sareen, Campbell, Leslie, Malisza, Stein, Paulus, Kravetsky, Kjernisted, Walker and Reiss2007) or less pronounced hyper-activation (Schienle et al. Reference Schienle, Schafer, Stark, Walter and Vaitl2005; Shah et al. Reference Shah, Klumpp, Angstadt, Nathan and Phan2009). However, it is noteworthy that some studies showed a correlation of insula activity with trait anxiety in healthy populations (Stein et al. Reference Stein, Garner, Keuthen, Franklin, Walkup and Woods2007; Simmons et al. Reference Simmons, Stein, Strigo, Arce, Hitchcock and Paulus2011). Therefore, we would have expected increased insular activation in the OCD-SAD patient group already due to their significantly higher trait anxiety scores.
Differential activation between OCD and SAD
Overall we found no differential activations between the two patient groups during the anticipation period. During the perception period the amygdala was slightly more active in OCD than in SAD patients. This result was rather surprising, especially as a large meta-analysis in SAD patients found markedly increased activation of the amygdala region compared to HCs (Bruhl et al. Reference Bruhl, Delsignore, Komossa and Weidt2014), but OCD studies have reported mixed results or even hypo-activation of the amygdala region compared to HCs (Cannistraro et al. Reference Cannistraro, Wright, Wedig, Martis, Shin, Wilhelm and Rauch2004; Cardoner et al. Reference Cardoner, Harrison, Pujol, Soriano-Mas, Hernandez-Ribas, Lopez-Sola, Real, Deus, Ortiz, Alonso and Menchon2011). Potential reasons for this finding could be: (1) The use of unspecific stimuli. It is possible that disease-specific emotional stimuli might have revealed differential activation patterns. (2) Our findings might point to disease-overarching mechanisms of amygdala activation in these two disorders when stimulated with unspecific emotional pictures, reflecting an unspecific emotional vulnerability (Simon et al. Reference Simon, Kaufmann, Musch, Kischkel and Kathmann2010). Finally, (3) amygdala reactivity might be specifically modulated by certain dimensions of OCD symptoms (Via et al. Reference Via, Cardoner, Pujol, Alonso, Lopez-Sola, Real, Contreras-Rodriguez, Deus, Segalas, Menchon, Soriano-Mas and Harrison2014). We did not differentiate between different OCD symptoms but included OCD patients regardless of their symptoms. Our results are therefore likely to be representative for a typical clinical population of OCD patients. However, as there is at least some evidence that certain functional alterations might be associated with certain OCD symptoms (Via et al. Reference Via, Cardoner, Pujol, Alonso, Lopez-Sola, Real, Contreras-Rodriguez, Deus, Segalas, Menchon, Soriano-Mas and Harrison2014) our results might be influenced by the rather mixed OCD sample.
While we found the VMPFC/OFC to be hyper-reactive compared to HCs, we found no differences between OCD and SAD patients. Until now, only few studies have used unspecific emotional stimulation. In SAD (Shah et al. Reference Shah, Klumpp, Angstadt, Nathan and Phan2009; Bruhl et al. Reference Bruhl, Rufer, Delsignore, Kaffenberger, Jancke and Herwig2011; Gaebler et al. Reference Gaebler, Daniels, Lamke, Fydrich and Walter2014) and in OCD (Phillips et al. Reference Phillips, Marks, Senior, Lythgoe, O'Dwyer, Meehan, Williams, Brammer, Bullmore and McGuire2000) these studies mainly reported no clear difference in the OFC compared to HCs, and only one study in OCD reported hyper-reactivity (Schienle et al. Reference Schienle, Schafer, Stark, Walter and Vaitl2005). This very limited evidence highlights the need for future studies on alterations in general emotion processing beyond disease-specific stimuli.
When comparing OCD and SAD, the rostral ACC was more activated in SAD during the perception of negative pictures which, however, was not a strong effect. In OCD, structural data consistently reported significantly smaller ACC volumes than in HCs (Rotge et al. Reference Rotge, Guehl, Dilharreguy, Tignol, Bioulac, Allard, Burbaud and Aouizerate2009; Radua et al. Reference Radua, van den Heuvel, Surguladze and Mataix-Cols2010; de Wit et al. Reference de Wit, Alonso, Schweren, Mataix-Cols, Lochner, Menchon, Stein, Fouche, Soriano-Mas, Sato, Hoexter, Denys, Nakamae, Nishida, Kwon, Jang, Busatto, Cardoner, Cath, Fukui, Jung, Kim, Miguel, Narumoto, Phillips, Pujol, Remijnse, Sakai, Shin, Yamada, Veltman and van den Heuvel2014), pointing towards a disease-related alteration in this area. fMRI and PET studies provided evidence for a hyper-activation in ACC areas in OCD (Rauch et al. Reference Rauch, Jenike, Alpert, Baer, Breiter, Savage and Fischman1994; Morgieve et al. Reference Morgieve, N'Diaye, Haynes, Granger, Clair, Pelissolo and Mallet2014). In SAD, the ACC has similarly been shown to be hyper-reactive, while structural abnormalities have rarely been found (Bruhl et al. Reference Bruhl, Delsignore, Komossa and Weidt2014). Therefore, stronger activation in SAD during the perception of negative stimuli compared to OCD is possibly linked to known structural brain differences in OCD particularly in the ACC [de Wit et al. Reference de Wit, Alonso, Schweren, Mataix-Cols, Lochner, Menchon, Stein, Fouche, Soriano-Mas, Sato, Hoexter, Denys, Nakamae, Nishida, Kwon, Jang, Busatto, Cardoner, Cath, Fukui, Jung, Kim, Miguel, Narumoto, Phillips, Pujol, Remijnse, Sakai, Shin, Yamada, Veltman and van den Heuvel2014; meta-analysis (Eng et al. Reference Eng, Sim and Chen2015)], which might reduce the measurable activation and could therefore reflect differential pathophysiological processes between OCD and SAD. When comparing studies investigating structural brain differences (grey matter, white matter) between HCs and patients with OCD and with SAD, the results in OCD seem mainly consistent [recent meta-analyses on grey-matter changes (Piras et al. Reference Piras, Piras, Chiapponi, Girardi, Caltagirone and Spalletta2015), white-matter changes (Piras et al. Reference Piras, Piras, Caltagirone and Spalletta2013; Radua et al. Reference Radua, Grau, van den Heuvel, Thiebaut de Schotten, Stein, Canales Rodríguez, Catani and Mataix Cols2014), and their combination (Eng et al. Reference Eng, Sim and Chen2015)], particularly in ACC, VMPFC/OFC and basal ganglia. However, in SAD, studies have reported rather mixed results, at least at the grey-matter level (for review see Bruhl et al. Reference Bruhl, Delsignore, Komossa and Weidt2014). This could indicate that neurobiological factors might play a more important role in OCD compared to SAD.
While the caudate was hyper-active in OCD-SAD patients compared to HCs, there was no differential activation between OCD and SAD patients. The caudate hyper-activation might therefore reflect an unspecific increased arousal response (Kumar et al. Reference Kumar, Berghorst, Nickerson, Dutra, Goer, Greve and Pizzagalli2014) to disease-unspecific emotional stimuli. Overall, the use of disease-unspecific stimuli might have evoked non-maximal reactions and activations such that compensatory mechanisms might have reduced the differences between the groups.
Some limitations that might be important for the interpretation of the present results should be noted. First, in contrast to HCs, subjects in both patient groups received medication, potentially explaining differences between HCs and the combined patient group. Therefore, we think that the current patient samples are representative for typical clinical populations. Second, OCD patients rated the negative pictures more negative than HCs. Some of the negative pictures contained blood and other disgust-evoking aspects, which might explain the negative rating. However, we found no correlation between the subjective ratings and the activity in amygdala and insula and patients reported that the pictures did not evoke disease-typical symptoms.
Conclusion
To conclude, we found that patients with OCD and SAD show very similar alteration patterns in fronto-striatal and limbic regions during unspecific emotional stimulation. Compared to HCs these regions were hyper-activated in the combined OCD-SAD sample. These findings potentially point to disease-overarching mechanisms of neural activation during emotional processing.
Supplementary material
For supplementary material accompanying this paper visit http://dx.doi.org/10.1017/S0033291715002998.
Acknowledgements
We acknowledge funding support from the Swiss National Science Foundation. No granting or other outside parties had any role in the study's design or orchestration, including data collection and analysis, our decision to publish, or preparation of the manuscript. S.W. has received grants from the Gottfried and Julia Bangerter-Rhyner Foundation, Novartis Foundation for medical-biological research, University of Zurich – career development grant ‘Filling the gap’. J.L. is supported by the Swiss National Science Foundation. M.R. has received Speaker honoraria from AstraZeneca and Lundbeck Institute, research grants from the Gottfried and Julia Bangerter-Rhyner Foundation and the Novartis Foundation for medical-biological research. A.D. has received grants from the University of Zurich ‘Matching Fund’ and from the ‘Johnson Foundation’. U.H. has received a grant from the Swiss National Science Foundation. A.B.B. is in receipt of a Fellowship from the Swiss Foundation for Grants in Biology and Medicine (SFGBM) and the Swiss National Science Foundation.
Declaration of Interest
None.