1. INTRODUCTION
There exists considerable interest in channeling high intensity laser pulses through plasmas over distances exceeding the Rayleigh length, due to their wide ranging applications (Dawson et al., Reference Dawson, Hertzberg, Kidder, Vlases, Ahlstrom and Steinhauer1971; Mackinnon et al., Reference Mackinnon, Borghesi, Gaillard, Malka, Willi, Offenberger, Pukhov and Meyer-ter-Vehn1999; Burnett & Corkum, Reference Burnett and Corkum1989; Tajima & Dawson, Reference Tajima and Dawson1979; Sprangle et al., Reference Sprangle, Esarey, Ting and Joyce1988; Li et al., Reference Li, L'Huillier, feray, Lompre and Mainfray1989; Kasparian et al., 2003; Pépin et al., Reference Pépin, Comtois, Vidal, Chien, Desparois, Johnston, Kieffer, La Fontaine, Martin, Rizk, Potvin, Couture, Mercure, Bondiou-Clergerie and Lalande2001; Rodriguez et al., Reference Rodriguez, Sauerbrey, Wille, Wöste, Fujii, André, Mysyrowicz, Klingbeil, Rethmeier, Kalkner, Kasparian, Salmon, Yu and Wolf2002), from laser driven fusion and laser wakefield acceleration (Chen et al., Reference Chen, Unick, Vafaei-Najafabadi, Tusi, Fedosejevs, Naseri, Masson-Laborde and Rozmus2008; Neff et al., Reference Neff, Knobloch, Hoffmann, Tauschwitz and Yu2006; Yu et al., Reference Yu, Yu, Xu, Tian, Chen and Wong2007; Zhou et al., Reference Zhou, Yu and He2007), to control lightning to protect sensitive sites. Saini and Gill (Reference Saini and Gill2006), Gill and Saini (Reference Gill and Saini2007) and Niu et al. (Reference Niu, He, Qiao and Zhou2008) studied nonlinear self focusing of elliptical Gaussian laser beams in collisionless magnetized plasma. Durfee and Milchberg (Reference Durfee and Milchberg1993) demonstrated laser guiding for more than 20 Rayleigh lengths by creating a plasma channel using an ionizing prepulse technique. Braun et al. (Reference Braun, Korn, Liu, Du, Squier and Mourou1995) studied the effect of self-focusing in forming laser filaments in air with infrared femtosecond laser. They observed laser channeling up to 20 m. Later studies (Yang et al., Reference Yang, Zhang, Li, Chen, Teng, Wei and Sheng2002; Fontaine et al., Reference La Fontaine, Vidal, Jiang, Chien, Comtois, Desparois, Johnston, Kieffer, Pépin and Mercure1999; Ladouceur et al., Reference Ladouceur, Baronavski, Lohrmann, Grounds and Girardi2001; Tzortzakis et al., Reference Tzortzakis, Prade, Franco and Mysyrowicz2000) demonstrated narrow laser filament propagation over distances of hundreds of meters, and even beyond, up to 10 km. Intensity dependent losses deplete the energy in the channel and eventually unbalance this trapping process. Yang et al. (Reference Yang, Zhang, Yu, Li and Wei2001, Reference Yang, Zhang, Li, Chen, Teng, Wei and Sheng2002) studied the generation of a long plasma channel by femtosecond laser pulse. They measured the length of plasma channel longer than 5 m with 120 µm channel diameter.
An important issue is the lifetime of the plasma channel. Hao et al. (Reference Hao, Zhang, Li, Lu, Yuan, Zheng, Wang, Kasparian, Rodriguez, Méjean, Yu, Salmon, Wille, Bourayou, Frey, André, Mysyrowicz, Sauerbrey, Wolf and Wöste2003) studied the decay time of a plasma fluorescence signal by injecting a delayed sub-nanosecond laser pulse and reported that the prolongation of plasma duration or channel length is due to heating and further ionization through the inverse Bremsstrahlung absorption of the delayed pulse. Xiao et al. (Reference Xiao, Hong-Bing and Qi-huang2006) modeled the decay kinetics by including electron detachment mechanism and the impact ionization. Zhu et al. (Reference Zhu, Ji, Deng, Liu, Li and Xu2006) reported that the lifetime of plasma channel is greatly enhanced to 350 ns by using four sequential intense 100 fs laser pulses with an external electric field of about 350 KV/m. Narayanan et al. (Reference Narayanan, Singh, Pandey, Shukla and Thareja2007) recently reported the prolongation of plasma channel lifetime in air at a moderate laser intensity (~1013 W/cm2) using a two pulse technique in a pump probe configuration. Air breakdown is incurred by 50 ps laser pulse. A long delayed 532 nm, 6 ns laser pulse of spot size 35 µm is then launched. It is observed that for the delay time of 7 ns the electron density increases by 50%.
In this paper, we study the nonlinear propagation of two Gaussian laser pulses with finite time separation in air, comprising nitrogen, including the effect of self-defocusing. The first picosecond laser ionizes the air by electron avalanche ionization, creating a sharp radial density profile with maximum on axis and undergoes self-defocusing. We neglect tunnel ionization as the intensity is below its threshold. After the passage of the first pulse, the plasma expands radially forming a channel of minimum density on axis using a nanosecond time scale. After a delay when the second nanosecond laser pulse is sent, the plasma is further heated by the inverse Bremsstrahlung process, and collisional ionization leads to an increase of the electron density. This pulse converges due to refraction. In Section 2, we study the propagation of the first pulse including the effects of plasma density evolution and self-defocusing. After the passage of the pulse, we assess the density profile modification via diffusion and recombination. In Section 3, we study the plasma response to the second pulse, and its consequent self-focusing. We also attempt to understand the experimental results by Narayanan et al. (Reference Narayanan, Singh, Pandey, Shukla and Thareja2007). In Section 4, we discuss our results.
2. PLASMA RESPONSE TO THE FIRST PULSE
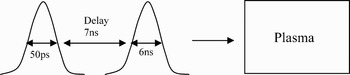
Consider the propagation of two laser pulses with a suitable time delay, through air, modeled as nitrogen gas of molecular density n m0 (Fig. 1). Both the pulses have Gaussian radial intensity profiles. The field of the first laser pulse is
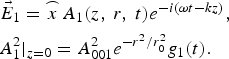
For z > 0, one may write (as shown later)

where v g ≈ c is the group velocity, f is the beam width parameter, and c is the velocity of light in vacuum.
Schematic diagram of two pulse technique.

The laser dissociates the gas molecules (nitrogen) and ionizes ensuing atoms giving two electrons per molecule. The dissociation energy for N2 is 9.76 eV whereas the ionization potential amounts to 15.6 eV for molecular nitrogen and equals 14.53 eV in the case of atomic nitrogen. At laser intensities ≥1013 W/cm2, the electron quiver energy is ≥3eV, and the thermal energy is even larger. Hence, one may reasonably assume that the direct ionization of nitrogen molecules is weak. The molecules quickly dissociate into atoms and the atomic nitrogen undergoes avalanche breakdown according to
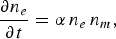
where n m = n m0 – n e/2 and α is the Townsend's first ionization coefficient. Introducing normalized quantities τ = ωt, N e = n e/n cr, N m = n m/n cr, N m0 = n m0/n cr where n cr = mω2/4πe 2, -e, and m are the electron charge and mass, Eq. (3) can be written as

The ionization coefficient α can be written as α = α0 exp[-B(p/E dc)], where α0 = πα2v th, p is the atomic pressure, α is the atomic radius, v th is the thermal velocity of electrons, B = V/λp cm torr, λ is the mean free path, V is the ionization potential, Edc = (v/ω)|E 1| and v is the collision frequency. We expand α and n e in powers of r 2,

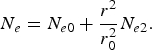
Collecting the coefficients of different powers of r 2 in Eq. (4) we get

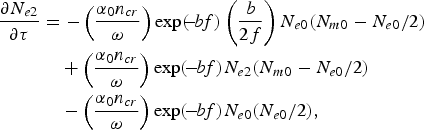
where  . As the ionization proceeds, the electron density acquires a profile with maximum on the laser axis. Such a plasma channel defocuses the laser pulse, weakening the plasma formation process as the laser moves. We shall self-consistently solve Eqs (5) and (6) with the equation for f.
In order to deduce an equation for the beam width parameter f, we begin with the wave equation for the laser field,

where ωpe2 = 4πn ee 2/m. Using Eq. (1) in Eq. (7) and employing the Wentzel-Kramers-Brillouin approximation we get

where  . On introducing z′ = z and t′ = t – z/v g, where v g = kc 2/ω ≈ c, Eq. (8) takes the form

Now onwards, we suppress the superscript prime on z′ and t′ Now onwards, we suppress the superscript prime on z′ and t′ for the sake of brevity. Following the usual paraxial ray theory, we introduce an eikonal A 1 = A 10 (r,z) e iS(r,z), separate out real and imaginary parts of Eq. (9), expand the eikonal in the limit r 2 ≪ r 02 as 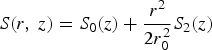 with
 and solve the resulting set by collecting various powers of r 2 on both sides. We recover Eq. (2) for A 102. The equation for beam width parameter turns out to be
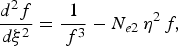
where ξ = z/R d,  , N e2 = n e2/n cr, η = r 0 ω/c.
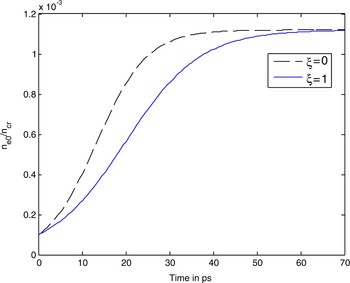
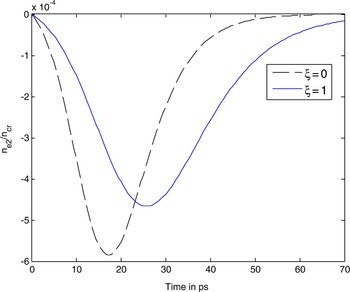
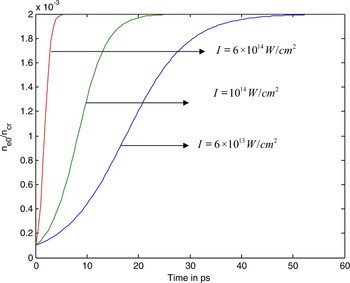
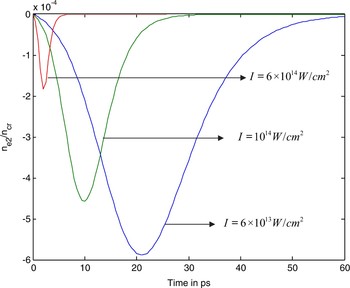
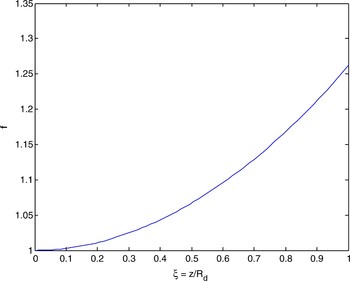
We solve Eqs (5), (6), and (10) numerically for the following parameters: ω = 2 × 10¹⁵ rad/s, n m0/n cr ≈ .001, n m0 ~ 1.4 × 1018 cm−3, α0n cr/ω = 0.74, n cr ≈ 1.254 × 1021 cm−3, laser intensity I = 6 × 10¹³ W/cm2, r 0 = 35 µm, v th ≈ 1.2 × 108 cm/s. The pulse shape is taken to be Gaussian 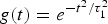 with τ1 = 50 ps. The results are displayed in (Figures 2) to (6). In Figure 2, we plotted the normalized axial electron density n e0/n cr as a function of the normalized time for ξ = 0,1. We observe that at intensity I = 6 × 10¹³ W/cm2, the electron density saturates in ~50 ps. As the intensity increases, the density saturates earlier as the rate of ionization increases as shown in Figure 4. We plotted the variation of normalized axial electron density with normalized time for the first pulse at intensities of I = 6 × 10¹³ W/cm2, 1014 W/cm2, 6 × 10¹⁴ W/cm2 in Figure 4. At ξ = 1, the rise in electron density is slower as the laser spot size has significantly increased and the axial intensity has fallen due to nonlinear refraction and diffraction. In Figure 3, we plotted N e2 = n e2/n cr as a function of the normalized time. At 6 × 10¹³W/cm 2, N e2 = n cr decreases to a minimum, then rises again due to the ionization of the plasma at off-axis values of r, and saturates at a time of ~55 ps. As we increase the intensity, the minimum value shifts to earlier values of time as shown in Figure 5. This is because at low intensity the plasma formation occurs only on the laser axis, hence a stronger variation with r occurs there. In Figure 6, we have shown the variation of the beam width parameter f with normalized distance ξ. The beam width parameter increases with distance due to diffraction and nonlinear refraction induced divergence.
(Color online) Variation of normalized axial electron density with normalized time during the first pulse at ξ = 0,1. The parameters are: ω = 2 × 10¹⁵ rad/s, N m00 ≈ .001, α0n cr/ω = 0.74, I = 6 × 10¹³ W/cm2, v th ≈ 1.2 × 10⁸r 0; 35 µm, ν ≈ 14.82 × 10¹²/s, τ1 = 50 ps.

(Color online) Variation of normalized coefficient of radial density variation with normalized time. Parameters are the same as in Figure 2.

(Color online) Variation of normalized axial electron density with normalized time for the first pulse at different intensities. The parameters are ω = 2 × 10¹⁵ rad/s, N m00 ≈ .001,  , I = 6 × 10¹³ W/cm2, n cr ≈ 1.254 × 10²¹/cm3, Bp/E 0; 1.56 for I = 6 × 10¹³ W/cm2, Bp/E 0; 1.21 for I = 1014 W/cm2, Bp/E 0; .49 for I = 6 × 10¹⁴ W/cm2, τ1 = 50 ps, v th ≈ 1.2 × 10⁸ m/s, r 0; 35 µm, ν ≈ 14.82 × 10¹²/s, τ1 = 50 ps.

(Color online) Variation of normalized radial electron density with normalized time for first pulse for different intensities. Parameters are same as of above Figure 4.

(Color online) Variation of beam width parameter with normalized distance of propagation ξ of the first pulse. Parameters are the same as in Figure 2.

After the first pulse, the plasma expands radially and recombination of electrons with ions sets in. In laser produced plasmas, recombination involves two types of processes: radiative recombination and three-body recombination. When atomic ions participate in recombination, the process may take place with the emission of a photon. The photon removes the excess energy released on formation of a bound state of the electron and ion. In three-body recombination, the electron is first captured by an atom into one of the upper levels, then, under the action of electron collisions of the second kind and also as a radiative transition, the bound electrons fall down step by step to the ground level. The recombination in this varies as T 9/2 with electron temperature and is weak at temperatures ≥ 10 eV.
One may model the variation of plasma density due to recombination and diffusion phenomenologically as follows. After the passage of first pulse, ambipolar radial diffusion of plasma and electron-ion recombination set in. The evolution of axial electron density may be taken as

where β is the recombination coefficient, t′d is the diffusion time. The first term on right-hand-side of Eq. (11) shows the effect of recombination, whereas the second term shows the effect of plasma diffusion. The radial plasma diffusion causes the electron density to rise with r, hence, in the paraxial region r < r 0f, the governing equation can be taken as

A numerical solution of these equations for typical parameters ω = 2 × 10¹⁵ rad/s, β0n cr/ω ≈ 1.965 × 10⁻⁵, α0n cr/ω = 0.74, r 0 = 35 µm, v th ≈ 1.2 × 10⁸, N′m0 ≈ 5.6 × 10⁻⁴ exp(−tp/t d) ν ≈ 14.82 × 10¹²/s, N m2 ≈ 5.6 × 10⁻⁴exp(tp/3.5t d), t d ≈ 10ns, τ2 = 6ns, t p = 4ns, 7ns and 12ns, reveals that the decay of axial density is nearly exponential, and so is the rise of N e2. Hence, we model N e0 and N e2 at the time of arrival of the second pulse as  where τD = ω t d, t d is the density decay time, τp = ωt p, t p is the time interval between two pulses, N e0|τ1 is the axial electron density at the expiry of the first pulse.
3. PLASMA RESPONSE TO THE SECOND PULSE
Now consider the propagation of the second laser pulse after a time delay t p with respect to the first pulse. The field of the second pulse can be written as

where 
 , and the beam width parameter f is different from the previous case.
The laser pulse imparts an oscillatory velocity to the electrons,

and imparts thermal energy at a mean temporal rate of 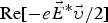 , where Re stands for real part of the complex quantity and * denotes the complex conjugate. The electron temperature rises (Liu & Tripathi, Reference Liu and Tripathi1994; Sodha et al., Reference Sodha, Ghatak and Tripathi1974) according to

where T 0 is the ion/atom temperature, and τɛ is the energy relaxation time. For elastic collisions τɛ = 2m i/mν where m i is the ion mass. At elastic collisions, τɛ is a few times smaller than in the case of non-elastic ones. At n 0 = 1018 cm−3, T e ≥10eV in a nitrogen plasma τɛ ≥ 50 ns. Hence, for the pulse duration of the second pulse, τ2 < 50 ns, the energy relaxation term can be dropped. Taking ν = ν0 (T e/T 0) where l = 1/2 for electron-neutral collisions and l = – 3/2 for electron ion collisions, the integration of Eq. (14) gives
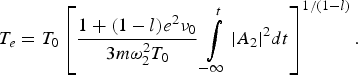
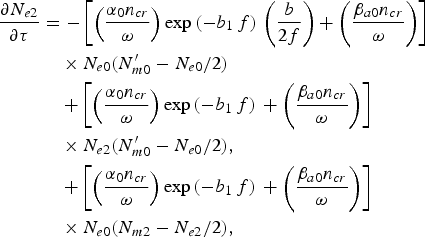
The rising electron temperature increases the ionization rate α and slows down the recombination rate β and the attachment rate βα. The electron density evolves as

where n m/ is the density of neutral atoms at the arrival of the second laser pulse. For atmospheric parameters, the last term in Eq. 16 may be ignored. βα may be taken as βa; β0 (T e – T 0)− l/ with l / typically; 0.5. We express n m/ as
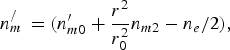
where  is the axial atomic density at the arrival of the second pulse. At the marginal regions, the atomic density increases due to diffusion of ions from the axial region, and their recombination increases. For this reason, we introduced n m2. The normalized value N m2 = n m2/n cr may be taken as N m2 = N m02e −(t p/3.5t d). Expanding α and N e as before in powers of r 2 (see Section 2), taking βa in the form βa0 + βa2r 2/r 02, and separating different powers of r 2 in Eq. (16) we obtain in terms of normalized quantities
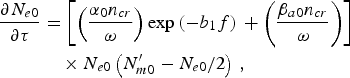
where 
![${\left\vert {A_2} {\bigg\vert } ^2 {dt} \right]^{1/\lpar 1 - l\rpar }\comma \;} $](https://static.cambridge.org/binary/version/id/urn:cambridge.org:id:binary:20151022040155221-0038:S0263034609000056_inline14.gif?pub-status=live) and
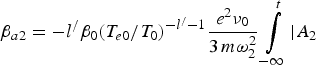
 . The equation governing the beam width parameter is Eq. 10. We solved Eqs 10, (15), and (19) numerically, and the results are shown in Figures (5)–(7).
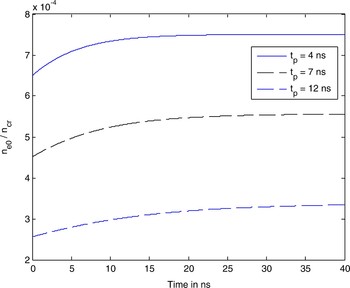
(Color online) Variation of normalized axial electron density with normalized time during the second pulse at intensity I = 1.25 × 10¹³ W/cm2. The parameters are: ω = 2 × 10¹⁵ rad/s, β0n cr/ω ≈ 1.965 × 10⁻⁵, α0n cr/ω = 0.74, r 0 = 35 µm, v th ≈ 1.2 × 10⁸N′m0 ≈ 5.6 × 10⁻⁴ exp(−tp/t d), ν ≈ 14.82 × 10¹²/s, N m2 ≈ 5.6 × 10⁻⁴ exp(tp/3.5t d), t d ≈ 10 ns, τ2 = 6ns, t p = 4ns, 7ns and 12ns.

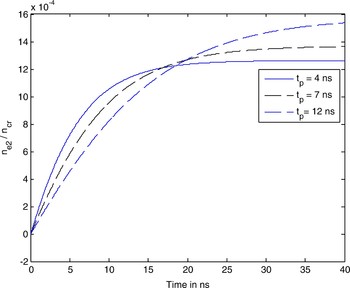
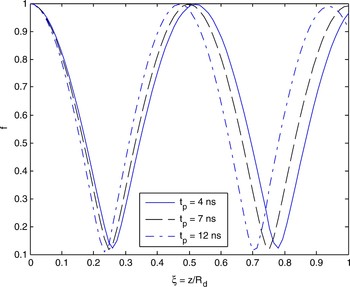
In Figure 7, we plotted normalized axial electron density N e0 = n e0/n cr as a function of the normalized time during the second pulse at intensity I = 1.25 × 10¹² W/cm2. We plotted theses figures for the parameters ω = 2 × 10¹⁵ rad/s, β0n cr/ω ≈ 1.965 × 10⁻⁵, α0n cr/ω = 0.74, N′m0 ≈ 5.6 × 10⁻⁴ exp(−tp/td), r 0 = 35 µm, v th ≈ 1.2 × 10⁸, ν ≈ 14.82 × 10¹²/s, t d ≈ 10ns, N m2 ≈ 5.6 × 10⁻⁴exp(tp/3.5t d), t p = 4ns, 7ns and 12ns, τ2 = 6ns. The axial density saturates at time ~20 ns when the time delay between the two pulses is t p = 4 ns. If the times delay increases then the density decreases. In Figure 8, we plotted N e2 = n e2/n cr in dependence on the normalized time for the second pulse at intensity I = 1.25 × 10¹² W/cm2. The electron density saturates at time ~20 ns when the time delay between the two pulses equals t p = 4 ns. We increase the time delay, the saturation of n e2/n cr occurs later in time. Figure 9 shows the variation of beam width parameter f with normalized distance ξ. For t p = 4 ns, 7 ns, and 12 ns, f varies in a periodic manner with ξ. According to Figure 7 at 4 ns, minimum occurs at somewhat larger z than that for t p = 7 ns, i.e., at t p = 4 ns, f acquires a minimum of f min = 0.14 at ξ = 0.25. As one increases the time gap between the pulses f min occurs at lower values of ξ, indicating stronger rate of self-focusing. As we increase the time delay, the beam focuses faster. This happens due to plasma depletion from the axial region. The oscillatory behavior is caused by the competing nature of self-focusing and diffraction divergence. Initially, when the beam power is greater than the threshold for self-focusing, the nonlinear self-convergence term predominates over diffraction and beam spot size shrinks. If the beam radius decreases, the diffraction effects become stronger. The nonlinear self-focusing effect also increases but at a slower rate due to the saturating effect of nonlinearity. After a while, the diffraction effect dominates and the beam acquires a minimum radius and then diverges. This behavior is reproduced periodically.
Narayanan et al. (Reference Narayanan, Singh, Pandey, Shukla and Thareja2007) recently conducted experimental studies on laser irradiation of air at atmospheric pressure. Two laser pulses with Gaussian radial and temporal profiles were employed. The lifetime of the plasma channel formed by a single pulse of duration ~50 ps (FWHM) and energy of ~80 mJ at the wavelength of 1064 nm was ~10 ns. When a second pulse of duration 6 ns, energy 200 mJ, and wavelength 532 nm was injected into the plasma channel at time delays of 5, 7, and 16 ns relative to the first pulse, the lifetime of the plasma channel was observed to be 23, 40.5, and 16.5 ns, respectively. For these parameters, our calculation shows that the normalized electron density n e0/n cr due to the first pulse saturates in about 30 ps. This is within a factor of 3 from the experimental value. If one chooses a higher value of α0, increased by a factor of 2, one gets the saturation time in the right range. The plasma lifetime enhancement by the second pulse of 6 ns duration, according to our calculation, is on the order of 20 ns. However, it does not depend on the time delay between the pulses, in contrast to the experiment where it has a maximum for an optimum time delay.
(Color online) Variation of normalized coefficient of radial density variation with normalized time. The parameters are the same as in Figure 7.

(Color online) Variation of beam width parameter with normalized distance of propagation ξ of the second pulse. The parameters are same as in Fig. 7.

4. DISCUSSION
The employment of two laser pulses of ps and ns duration below the tunnel ionization threshold appears to be effective in producing prolonged plasma channels. At a nitrogen density of 1018 cm−3, the first pulse of ≥20 ps duration causes complete ionization on the laser axis and partial ionization off axis. The ensuing refractive index profile, in conjunction with the diffraction divergence, causes divergence of the pulse, limiting the length of the ionized channel. After the passage of the pulse, the plasma expands and creates a channel with minimum electron density on the axis. The second pulse of lower duration and much lower intensity is capable of heating the electrons, hence raising the ionization rate and suppressing the recombination ratio. This leads to significant enhancement of the plasma channel lifetime. The formation of the channel by the first pulse requires a time delay of ~5–10 ns between the two pulses to allow radial ambipolar diffusion of the plasma. The second laser pulse undergoes periodic focusing in such a channel leading to a strong heating rate of the electrons, and an enhancement of the plasma lifetime. The two pulse technique of producing prolonged plasma channel appears quite effective. The first pulse forms the plasma that undergoes ambipolar diffusion after the passes of the pulse. The second pulse undergoes self-focusing in the favorable density profile created. The theoretical behavior is in the good agreement with the experiment.
ACKNOWLEDGMENT
The authors are grateful to Prof. V. K. Tripathi, IIT Delhi for fruitful discussions. Updesh Verma is very thankful to the CSIR for financial support.