Introduction
The link between developmental programming and disease in adult life was initially established in a series of landmark epidemiological studies that highlighted low birth weight contributing to risk of disease in adulthood, including hypertension, kidney disease and diabetes,Reference Barker 1 – Reference Hoy, Hughson, Bertram, Douglas-Denton and Amann 3 and it is now well established that changes in maternal environment during the critical prenatal and postnatal developmental periods can have long-lasting effects. The kidneys are particularly prone to perturbations during development and insults are reflected by glomerulomegaly and a decrease in nephron endowment in the offspring.Reference Dorey, Pantaleon, Weir and Moritz 4 , Reference Hoy, Hughson and Zimanyi 5 Further, nephron endowment or nephron number is permanent, such that no new nephrons can be formed after nephrogenesis.Reference Bertram, Cullen-McEwen and Egan 6 In humans, the 34-week gestation point marks the completion of nephrogenesis, and thus assessing nephron number provides an insight into the overall success of fetal and kidney development in utero. In contrast, nephron development in rodents continues until around postnatal days 7–10,Reference Dickinson, Walker, Cullen-McEwen, Wintour and Moritz 7 and as such, both prenatal and postnatal environment can affect nephron number, renal function and the development of hypertension in adult life.Reference Singh, Denton, Bertram, Dowling and Moritz 8 – Reference Wlodek, Mibus and Tan 10
Polycystic kidney disease (PKD) and nephronophthisis (NPHP) are characterized by the development of cystic kidneys, ultimately progressing to end-stage renal disease (ESRD).Reference Grantham 11 , Reference Chapman, Devuyst and Eckardt 12 In addition to renal decline, manifested in decreased glomerular filtration rate and proteinuria, extra-renal manifestations such as hypertension may also be present. In monogenic conditions such as PKD and NPHP, significant clinical heterogeneity and inter/intra familial variability is observed.Reference Otto, Trapp and Schultheiss 13 For instance, in a study of a family spanning over three generations, affected members exhibited large differences in severity and disease manifestations, such as age of onset of ESRD, despite having the same mutation in PKD1.Reference Perrichot, Mercier and de Parscau 14 As such, disease severity and prognosis are not dictated by the mutation alone.Reference Devuyst, Persu and Vo-Cong 15 Fetal developmental programming may be a factor that influences disease severity in PKD,Reference Barker and Martyn 16 , Reference Dipple and McCabe 17 with a Danish study showing low birth weight was associated with an early onset of ESRD in PKD patients.Reference Orskov, Christensen, Feldt-Rasmussen and Strandgaard 18 If maternal environment is an important factor in the ultimate expression of PKD phenotype, it will have an important implication in genetic counselling and clinical treatment of PKD patients.
Based on the above, we hypothesize that in a rodent model of cystic kidney disease, animals will show a reduced nephron number compared with wildtype controls. We further predict that an improvement in the prenatal and/or postnatal environment will confer overall healthier offspring, with improvements in rates of body weight gain, clinical phenotypes such as renal function and blood pressure, cystic parameters and, importantly, nephron number. To examine our hypothesis, we have used the Lewis polycystic kidney (LPK) rat, which is a rodent model of NPHP featuring a spontaneous missense mutation in the Nek8 gene,Reference McCooke, Appels and Barrero 19 with phenotypic similarities to the juvenile cystic kidney (jck) mouse model of PKD.Reference Liu, Lu and Obara 20 The disease progression of LPK has been studied extensively in our previous work where we show hypertension developing from 6 weeks of age and renal failure at 12 weeks of age.Reference Phillips, Hopwood and Loxley 21 We first sought to determine if there was a deficit in nephron number in homozygous LPK rats compared with Lewis wildtype controls. We then compared LPK rats raised under different prenatal and postnatal environmental conditions, taking advantage of heterozygous LPK dams who are clinically normal and the technique of cross-fostering pups. An additional group of LPK rats bred and raised on a non-Lewis background Wistar Kyoto (WKY) with heterozygous mothers were used to investigate improved prenatal and postnatal environment on a distinct genetic background.
Methods
Animals
The LPK animals used for this study arose as an autosomal recessive mutation in Nek8 from a colony of wildtype Lewis (+/+) strain (LEW/SsNArc) rodents at the Animal Resource Centre, Perth, WA, Australia.Reference McCooke, Appels and Barrero 19 All males used for LPK breeding were homozygous for the LPK mutation (−/−). Homozygous female LPK and heterozygous female LPK (LPK +/−) females were used for breeding and cross-fostering, and an additional control heterozygous maternal line (WKY-LPK +/−) was established using WKY/NCrlArc dams crossed to LPK −/− males.
The animals were housed in cages in a room with controlled temperature at approximately 23°C and 12 h light/dark cycle. All animals were provided with food and water ad libitum.
Experimental design
Study one
Lewis born and raised by their biological dams (wildtype Lewis, n=4 dams) and LPK born and raised by their biological homozygous LPK dams (n=4 dams) were used for stereological estimation of glomerular number. A total of five pups (all male) from each strain were used. Animals were weaned at age 3 weeks. At age 12 weeks, animals were euthanized (isoflurane 5% in 100% oxygen and then decapitated) after which the kidneys were removed and fixed with 4% paraformaldehyde for 24 h. They were then stored in 70% ethanol until manual paraffin embedding under standard histological conditions and processing as detailed in the following.
Study two
The following four groups of LPK offspring were established (Table 1):
(i) Pups born from and raised by their biological LPK dams, being animals with a poor prenatal and postnatal phenotype due to the full PKD phenotype and renal disease in the dams (control),
(ii) Pups born from LPK dams cross-fostered as a whole litter onto heterozygous LPK dams, thereby providing improved postnatal environment (LPK:Pn),
(iii) Pups born from and raised by their biological heterozygous LPK dams, thereby providing improved prenatal and postnatal environment (LPK:Pr/Pn),
(iv) Pups born from and raised by their biological heterozygous WKY-LPK dams, being an alternative group testing for improved prenatal and postnatal environment on a distinct genetic backgroundReference Consortium, Saar and Beck 22 (WKY-LPK:Pr/Pn).
Groups used for study two

Pn, postnatal; Pr, prenatal; WKY, Wistar Kyoto; n, number of dams from which offspring were derived; Lewis polycystic kidney (LPK)
Dams (maternal prenatal) were mated with homozygous LPK (−/−) males. In those matings using heterozygous dams (LPK +/−), only the homozygous LPK (−/−) offspring were included in the present study. Litter size was 9±0.9. Number of offspring contributing to each study group is broken down into ♂ (male), ♀ (female). Only the LPK:Pn group were cross-fostered, all other groups remained with the maternal dam.
In the cross-fostered group (LPK:Pn), offspring were cross-fostered 1 day after birth, whereas in all other groups pups remained with the biological dam. All animals were weaned at age 3 weeks. At age 5 weeks, animals were tested for the homozygous LPK mutation by palpation for the presence of enlarged kidneys. Only homozygous offspring were used for the study and were selected from each litter at random to achieve a minimum of n=6 males and 6 females for each group before being transported from the breeding facility to the research institution, where they were housed in standard housing with environmental enrichment.
Experimental procedures
Between the ages of 6 and 16 weeks, pups from each group were tracked weekly for rate of growth (body weight measurement) and fortnightly for renal function (urine analysis) and hypertension [systolic blood pressure (SBP)]. Animals were allowed to age out to 16 weeks to allow full phenotypic discrimination of the effect of prenatal and postnatal maternal environment.
Urine analysis
Animals were placed in individual metabolic cages for up to 4 h to allow adequate collection of urine. Urine samples were analysed for urinary protein/creatinine ratio (UPC) using automated IDEXX VetTest Chemistry Analyser (IDEXX Laboratories, ME, USA), an automated processer using enzymatic-based dry-slide technology. When protein was below the levels of the machine sensitivity (<0.05 mmol/l), UPC was recorded as 0.
Systolic blood pressure
Tail-cuff plethysmography was used to determine SBP (IITC Life Science, CA, USA). Animals were acclimatized to restraint and the recording protocol for 1 week before the first measurement. Animals were placed in a restrainer within a preheated chamber at 32°C and an automatic inflatable cuff placed around the tail. Using photoelectric sensors within the automatic inflatable cuff, real-time systolic readings were recorded using IITC software (IITC Life Science). The average of at least three measurements was taken to determine SBP measurement.
Blood and tissue collection
At study endpoint (16 weeks), final body weight was determined immediately before sacrifice. Half of the animals from each group were euthanized with pentobarbitone sodium (60 mg/kg i.p.) (Virbac, NSW, Australia) for collection of tissue for estimation of glomerular number and determination of cystic parameters. Blood was collected via cardiac puncture into lithium heparin and the animal was then perfused through the base of the left ventricle with 200 ml 0.9% w/v saline followed by the same volume of 4% paraformaldehyde (PFA) (Sigma Aldrich, MO, USA) diluted and dissolved in 0.01 M phosphate buffered saline (pH 4.2) at room temperature. The kidneys were post-fixed in 4% PFA overnight at 4°C and then transferred to 70% ethanol until further analysis. The remaining animals from each group were euthanized with 5% isoflurane in 100% oxygen and decapitated for trunk blood collection into lithium heparin and the kidneys, heart and left ventricle were dissected and relative weights determined. For this reason, relative body weight data are from half the total number of animals used in the study overall.
Blood samples were centrifuged at 2000 rpm for 5 min and the supernatant collected for determination of plasma creatinine, urea, albumin, total protein and globulin using an IDEXX VetTest Chemistry Analyser.
Estimation of nephron number and cystic index
The right kidney was processed through ascending concentrations of ethanol and then Histochoice (Amesco, OH, USA) before final embedding in paraffin (Leica, Wetzlar, Germany). The entire kidney was then transversely sectioned at 10 µm, and based on the total number of sections, 10 pairs of sections dispersed evenly throughout the kidney were systemically selected for estimation of nephron number as previously described using sections stained with lectin peanut agglutinin (PNA).Reference Cullen-McEwen, Armitage, Nyengaard, Moritz and Bertram
23
Images of the kidney were acquired at 5× magnification (Zeiss, Oberkochen, Germany), and from the selected 10 section pairs, appearing and disappearing PNA-positive glomeruli were marked by superimposing consecutive images. The sum of appearing and disappearing PNA-positive glomeruli of all 10 pairs was used to estimate the total nephron number using the equation:
 $$N_{{{\rm glom}}} {\equals}{\rm SSF}{\times}{1 \over 2}{\times}{1 \over 2}{\times}Q^{{\minus}} $$
where N glom is the estimated total nephron number, SSF is the reciprocal of the total sections per kidney (the number of sections between each section pairs) and Q − is the sum of all PNA-positive glomeruli appearing and disappearing between the reference and lookup section.
To determine cystic index, imaged sections (four per animal) were analysed using Fiji.Reference Schindelin, Arganda-Carreras and Frise 24 Images were thresholded and the ‘analyse particles’ function used to measure cyst to kidney area ratio and the average size of each cyst (mm2). The calyx area was excluded from analysis.
Statistical analysis
Results are expressed as mean±s.e.m. and statistical significance was set at P⩽0.05. For study one, an unpaired t-test was used to compare Lewis and LPK. For study two, preliminary general linear model (GLM) analysis of variance (ANOVA) was first performed on the whole data set (all groups, both sexes) to identify potential sex or group effects, including their interaction, and data was also tested for assumption of equal variances (Levene Statistic). If a sex effect or interaction was identified upon preliminary analysis, the data were analysed separately for each sex, otherwise the data were pooled. For single-point variables, a one-way ANOVA was then performed based on intervention groups, followed by Tukey post hoc analysis if indicated. Data that displayed unequal variance were analysed using Welch ANOVA, followed by Games-Howell post hoc analysis. Longitudinal data (body weight, SBP and UPC) were analysed using two-way ANOVA, testing for intervention group and age effects followed by Tukey post hoc analysis as indicated. Linear regression modelling to test for any relationship between bodyweight and renal function was undertaken with plasma urea or creatinine as the dependent variable and bodyweight at 6 and 16 weeks as the independent variables, using a stepwise selection method of entry and listwise exclusion of missing values, with male and female data analysed separately due to the established sex effect on bodyweight. Adjusted R 2 and β-standardized regression coefficients (β) values are provided as an indicator of the relative influence of the body weight parameter. Pearson correlation coefficients were derived from the model, using a one-tailed test for significance (P⩽0.05).
Data were analysed using IBM Statistical Package for the Social Sciences (v22, SPSS; Chicago, IL, USA) and GraphPad Prism software (version 6, La Jolla, CA, USA).
Results
Study one
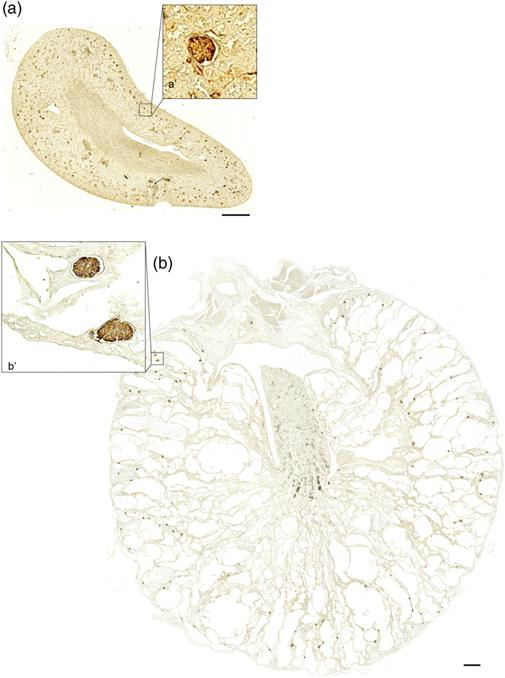
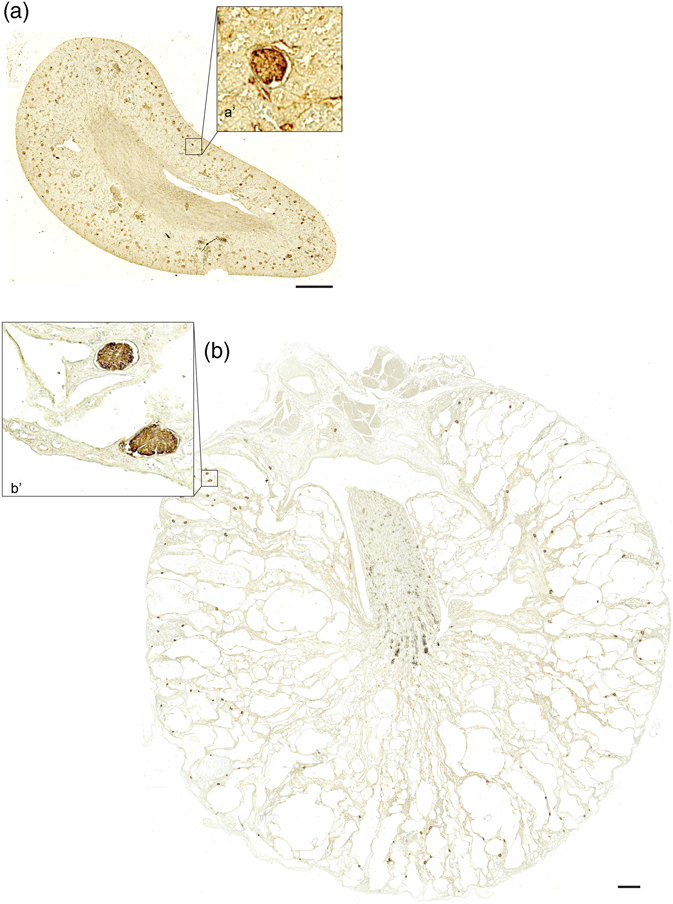
In our previous work, we have detailed the marked difference in phenotype between the Lewis wildtype and LPK animals.Reference Phillips, Hopwood and Loxley 21 A representative image of the LPK cystic renal phenotype is provided in Fig. 1. Nephron numbers were significantly lower in the LPK compared with Lewis controls, corresponding to an approximately 25% reduction in nephron endowment (Lewis 18,564±980 v. LPK: 14,095±453, P<0.05).
Peanut agglutinin (PNA) staining of wildtype Lewis (a, a') and Lewis polycystic kidney (LPK) (b, b') kidneys from animals at 12 weeks of age, illustrating renal morphology and identification of glomeruli (a, b) used for estimation of nephron number. The marked cystic phenotype of the LPK is evident, with cysts distributed throughout the renal parenchyma. No cysts were evident around individual glomeruli (d) in the LPK. Scale bar (a', b') represents 1000 μm.
Study two
Body weight
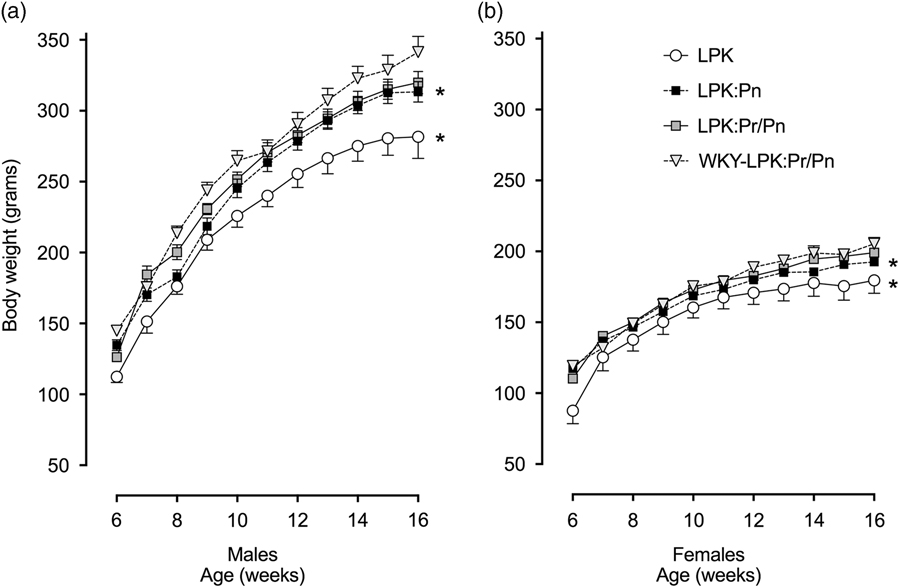
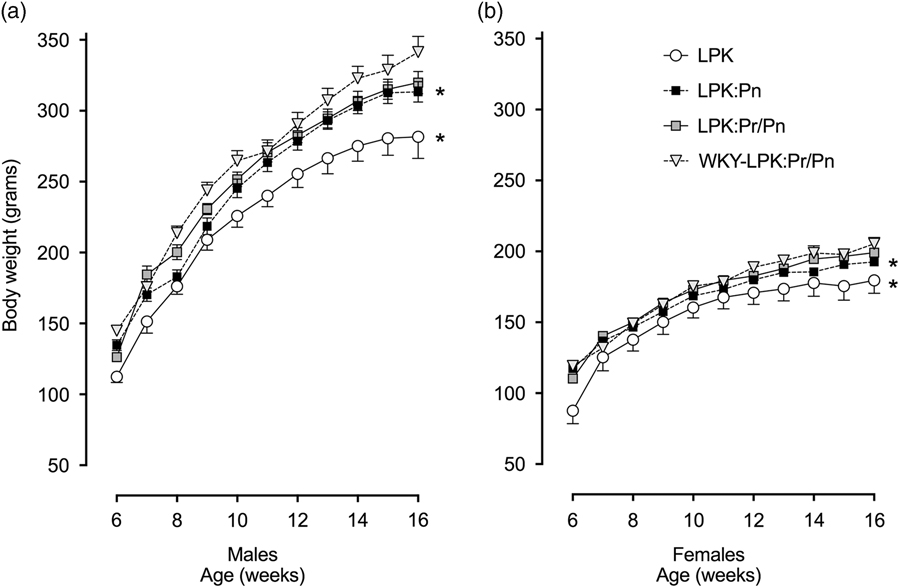
Weekly body weights for the different groups across the study period (6–16 weeks) is illustrated in Fig. 2. Sex differences were present and there were significant age and group effects (all P<0.001). Across the data set as a whole, both male and female control LPK weighed less than all other groups. In the male LPK rats, this difference in body weight was statistically significant compared with all other groups at 14, 15 and 16 weeks, while at age 6 weeks their body weight was significantly less than that of the WKY-LPK:Pr/Pn group. The female LPK weighed significantly less than all other groups at 6 and 15 weeks of age. Over all ages, male and female LPK:Pn also were of lower body weight than the WKY-LPK:Pr/Pn and LPK:Pr/Pn groups, though this was not statistically significant at any specific age.
Body weight growth profiles from 6 to 16 weeks separated into male (panel a) and female (panel b) outcomes. Data points represent mean±s.e.m. (*) indicates significantly different to all other cohorts across the data set as a whole. In the male Lewis polycystic kidney (LPK) controls, this difference in body weight relative to all other groups was statistically significant at 14, 15 and 16 weeks, whereas in the female LPK controls it was evident at 6 and 15 weeks. Furthermore, the male LPK aged 6 weeks weighed significantly less than that of the WKY-LPK:Pr/Pn group. P<0.05. N values are as per Table 1.
SBP
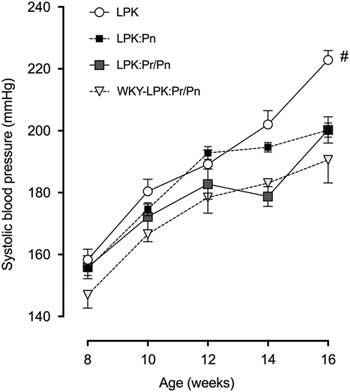
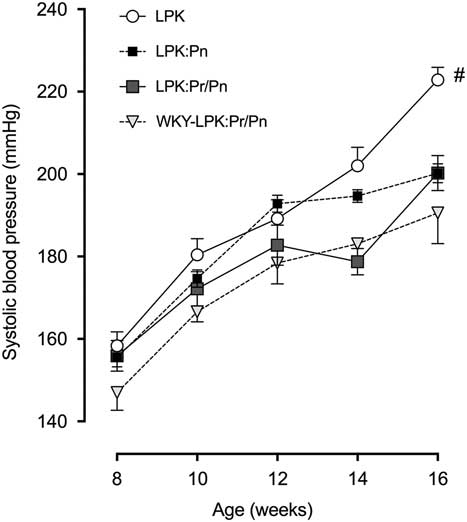
Multivariate GLM analysis of overall SBP indicated significant age and group effects (P⩽0.001) but no sex effect (P=0.206). The combined data set is illustrated in Fig. 3. Blood pressure increased with age in all groups and was overall significantly greater in the LPK animals compared to the animals with improved prenatal and postnatal environments (LPK:Pr/Pn and WKY-LPK:Pr/Pn). This was most evident at age 16 weeks, where the LPK animals had significantly higher blood pressure than all other groups including pups that had been cross-fostered to improve the postnatal environment only (LPK:Pn).
Systolic blood pressure (SBP) from 8 to 16 weeks. Data are combined male and female results represented as means±s.e.m. # indicates significantly different to LPK:Pr/Pn and WKY-LPK:Pr/Pn across the data set as a whole. At 16 weeks, the Lewis polycystic kidney (LPK) control animals were significantly different to all other groups including the LPK:Pn at that age point. P<0.05. N values are as per Table 1.
Urine
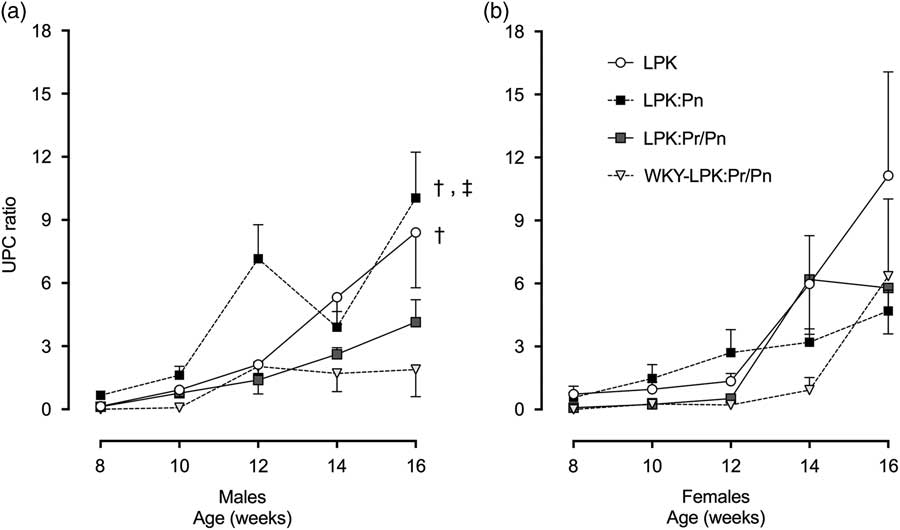
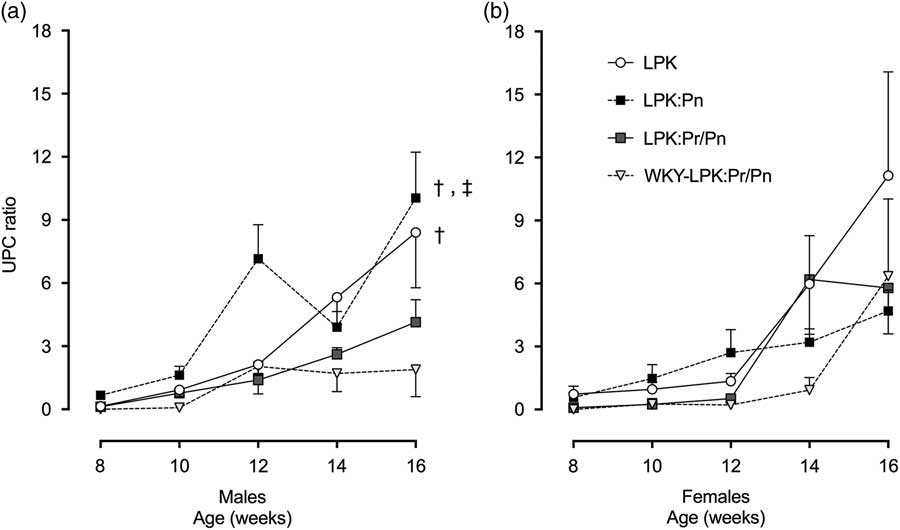
Fortnightly UPC ratio for the different groups across the study period is illustrated in Fig. 4. A significant sex and age effect (both P<0.05) was present. In males and females there was a significant increase in UPC in all groups as the animals aged, consistent with a decline in renal function. In the males there was also a group effect (P<0.001), with UPC being greater in the LPK versus WKY-LPK:Pr/Pn across all age data combined, and the LPK:Pn showing higher UPC than both the LPK:Pr/Pn and WKY-LPK:Pr/Pn groups across all age data combined. This was most evident at age 12 weeks when the UPC in the male LPK:Pn was greater than all other groups.
Changes in urinary protein to creatinine ratio (UPC) from 8 to 16 weeks separated into male (panel a) and female (panel b) outcomes. Data points represent mean±s.e.m. (†) indicates significant difference from WKY-LPK:Pr/Pn across the data set as a whole and (‡) significantly different to LPK:Pr/Pn across the data set as a whole. At age 12 weeks, the male LPK:Pn were significantly different to all other groups at that age point. P<0.05. N values are as per Table 1. LPK, Lewis polycystic kidney.
Organ weights at postmortem
Kidney to body weight ratio
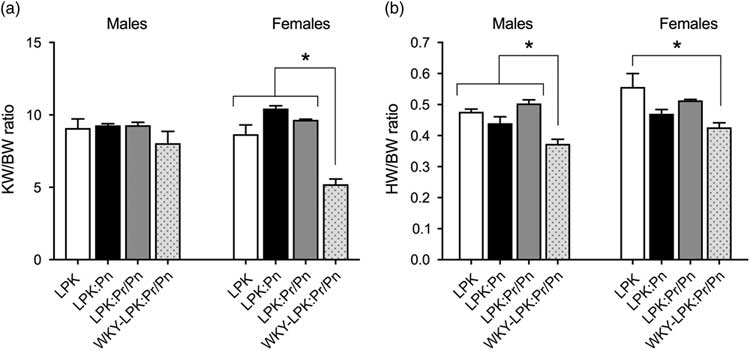
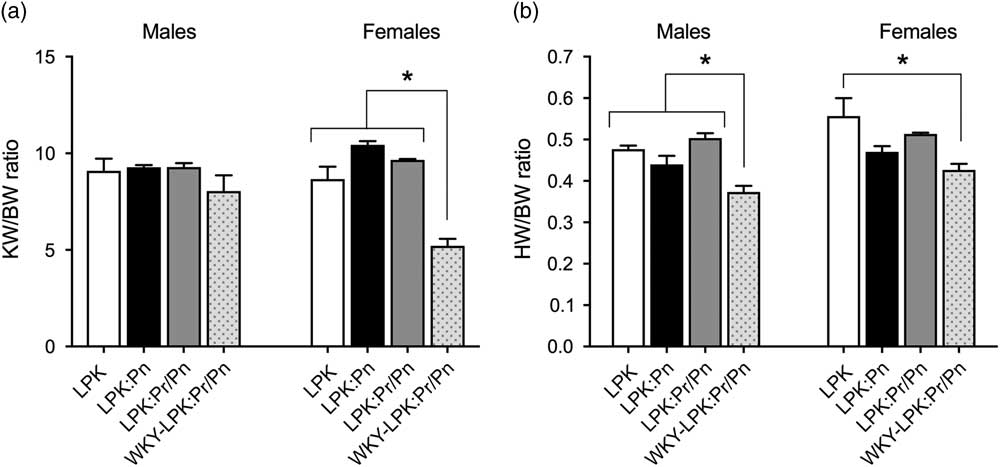
A sex/group interaction was present (P=0.003) when comparing KW/BW ratio. In the males, normalized kidney weight was not significantly different between groups; however, in the females, KW/BW ratio was significantly less in WKY-LPK:Pr/Pn group (P<0.001), indicative of reduced kidney enlargement in these animals (Fig. 5a ).
Kidney weight to body weight (KW/BW; panel a) and heart weight to body weight (HW/BW; panel b) ratio in male and female animals. Data expressed as means±s.e.m. in animals at age 16 weeks. (*) Indicates significantly different to other groups as indicated, P<0.05. N=3 male/3 female per group except for the LPK:Pn female group where n=5. LPK, Lewis polycystic kidney.
Heart to body weight ratio.
Heart weight data normalized to body weight was analysed to determine the extent of cardiac hypertrophy within experimental groups. Analysis identified both a sex and group effect (P=0.006 and P<0.001, respectively). In the male animals, the HW/BW ratio in the WKY-LPK:Pr/Pn was significantly less compared with all other groups (P<0.05; Fig. 5b ). In female animals, HW/BW ratio in the WKY-LPK:Pr/Pn was significantly less compared with the control LPK group (Fig. 5b ). In order to determine if the observed cardiac hypertrophy was related to left ventricular hypertrophy, left ventricular weight was assessed normalized against body weight. There was no sex effect between groups (P=0.066), however, consistent with the heart weight data, there was a reduced ratio of LV/BW in the WKY-LPK:Pr/Pn animals compared with all other groups (P<0.05; LPK: 0.42±0.02, LPK:Pn: 0.38±0.01, LPK:Pr/Pn: 0.40±0.01, WKY-LPK:Pr/Pn: 0.32±0.00. n=3 male/3 females per group except for the LPK:Pn female group where n=5).
Plasma biochemistry
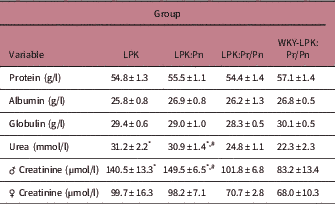
Group data summarizing plasma biochemistry results are presented in Table 2. Assessment of plasma total protein and globulin did not yield any sex differences or group differences among the four groups (all P>0.05). Plasma albumin demonstrated a sex effect but no group effect, with albumin being less in male than female animals across all groups (25±0.6 v. 27.7±0.7 g/l, P=0.005). Plasma urea levels showed a significant difference between groups but no sex effect (P=0.087) and thus data were pooled, with levels being significantly less in WKY-LPK:Pr/Pn animals compared with the LPK and the LPK:Pn groups. Urea was significantly less in the LPK:Pr/Pn compared with the LPK:Pn (both P<0.05). Plasma creatinine demonstrated both a sex and group effect (both P<0.001). Overall, creatinine levels were significantly more in male animals compared with female animals (118.8±7.5 v. 86.1±5.4 μmol/l, P=0.001). In the male animals, the WKY-LPK:Pr/Pn animals demonstrated significantly lower levels compared to both the control LPK and LPK:Pn groups; however, there was no significant difference between groups in the female cohort.
Plasma biochemical data at study endpoint
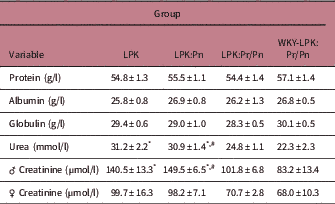
Values are expressed as mean±s.e.m. n values are as per Table 1. Preliminary analysis identified no sex effect and so male/female data were pooled except for the creatinine data where a sex effect was evident. *Significantly different to WKY-LPK:Pr/Pn, #Significantly different to LPK:Pr/Pn, P<0.05.
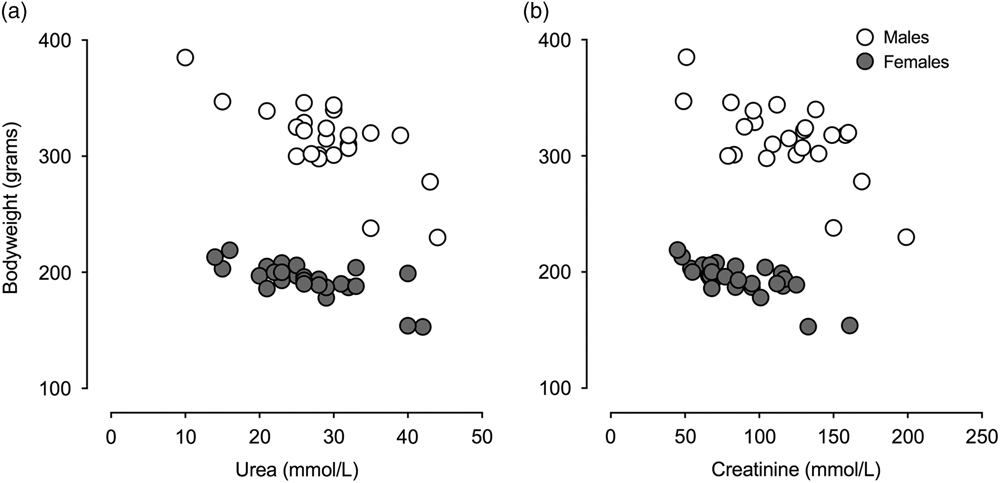
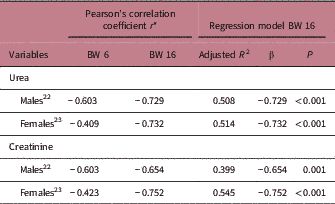
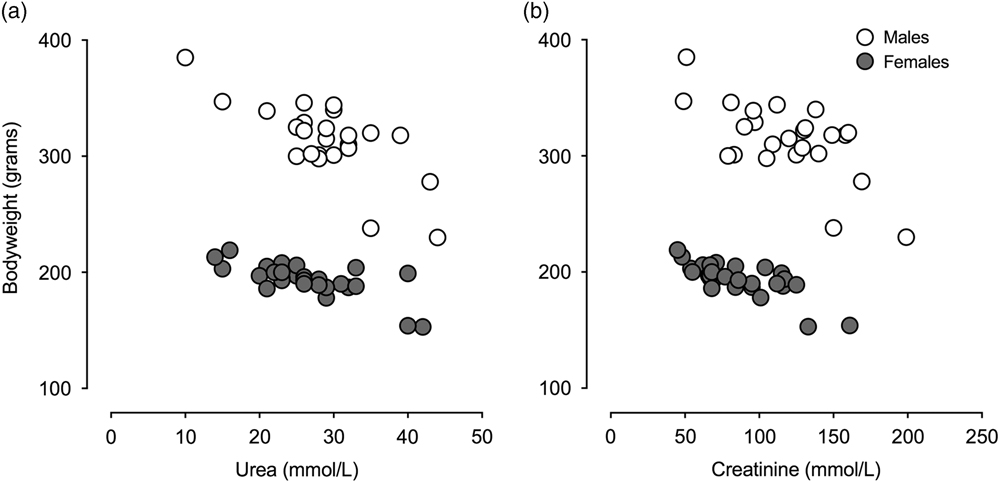
Although there was a significant negative relationship between body weight and both urea and creatinine at 6 and 16 weeks, in the regression model, body weight at 16 weeks was the only significant predictor variable for either urea or creatinine in male and female animals. Regression outputs are provided in Table 3 and individual data points are illustrated in Fig. 6.
Individual data points for male and female animals illustrating relationship between plasma urea (a) and creatinine (b) and body weight at age 16 weeks.
Outputs of linear regression modelling for bodyweight and renal function
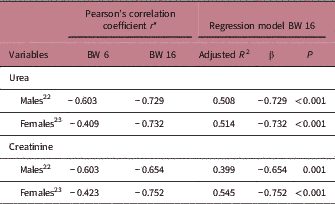
Linear regression modelling demonstrating the relationship between plasma biochemistry indicators of renal function and bodyweight. Table provides Pearson’s correlation coefficients r* (all P<0.05) and the linear regression model summary in male and female animals from all study groups for urea and creatinine as the dependent and body weight (BW) at age 6 and 16 weeks as the predictive variables. β: beta standardized regression coefficients. The number of data pairs for each correlation is indicated by superscript.
Cystic index and estimation of nephron number
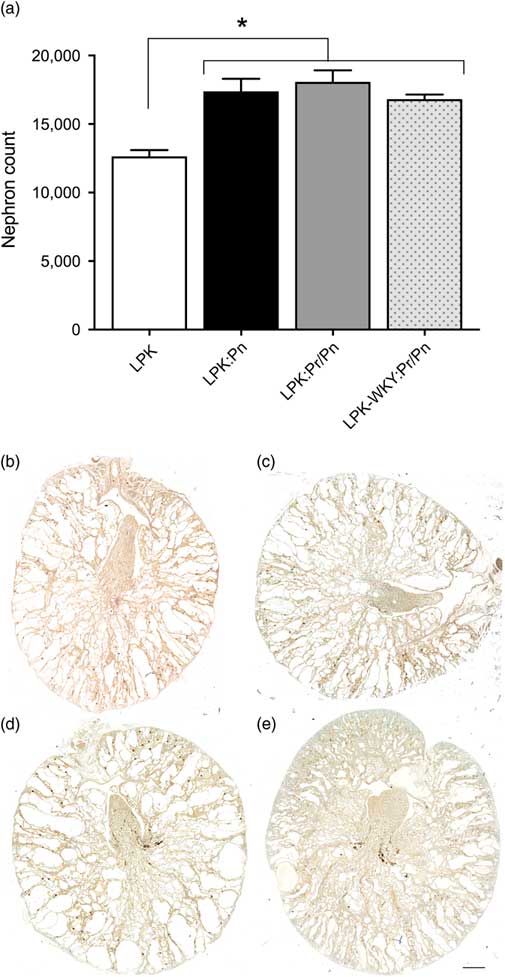
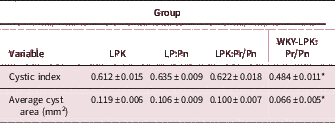
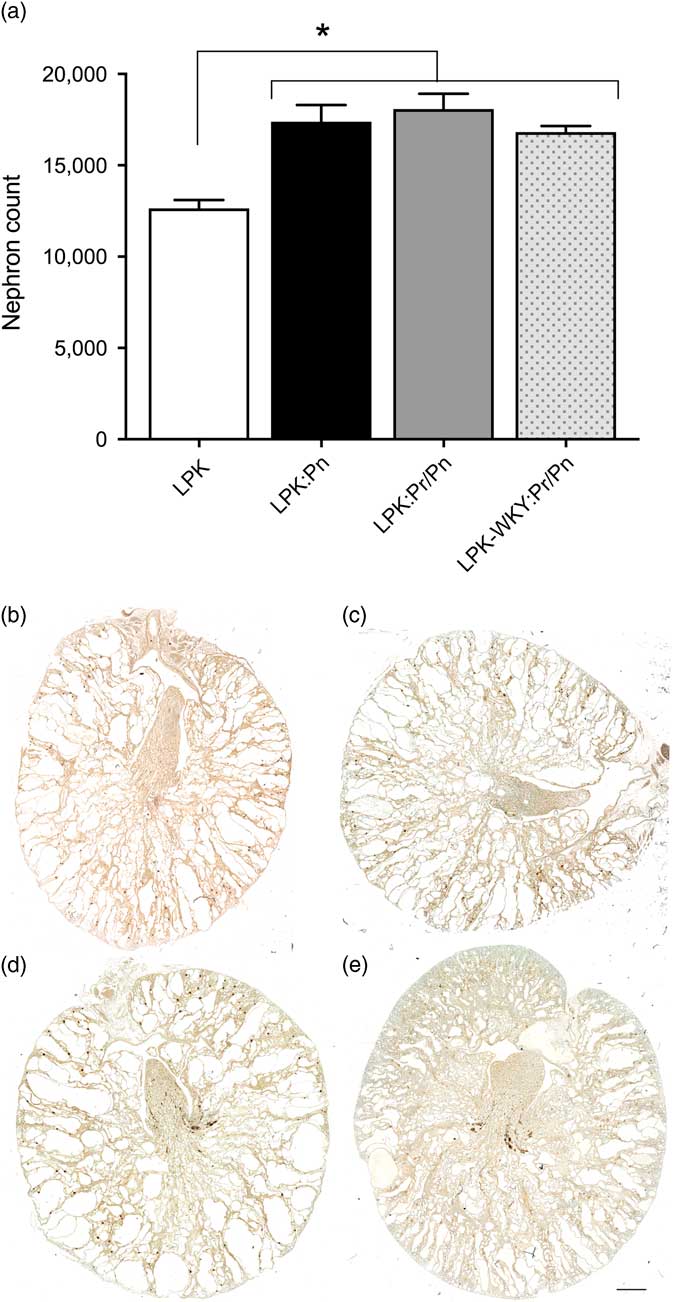
Renal morphology in all groups showed large kidneys with cystic lesions distributed throughout (Fig. 7). Preliminary GLM analysis of cystic index and cyst area both demonstrated a group effect (P⩽0.001) but no sex effect (P=0.53 and 0.839, respectively). Post hoc analysis indicated that both cystic index and cyst area were significantly less in the WKY-LPK:Pr/Pn compared with all other groups (P<0.05, Table 4).
Estimated nephron count and representative images of cystic kidneys in animals at 16 weeks of age. Panel a represents combined male and female nephron count data and is expressed as means±s.e.m. (*) Indicates significantly different to all other groups with P<0.05. N values are as per Table 4. Lower panels are illustrative images of kidneys from animals from each of the different maternal environment groups: Panels b: LPK (control Lewis polycystic kidney), c: LPK:Pn (improved postnatal environment), d: LPK:Pr/Pn (improved prenatal and postnatal environment) and e: WKY-LPK:Pr/Pn (improved prenatal and postnatal environment on Wistar Kyoto genetic background). Scale bar in panel e represents 1000 μm.
Cystic parameters
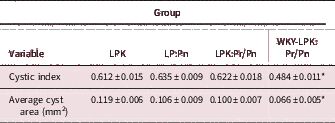
Values are expressed as mean±s.e.m. Preliminary analysis identified no sex effect and so male/female data are pooled. n=5 (2–3 males/females per group) except for the WKY-LPK:Pr/Pn group where n=6 (3 males and 3 females). (*) Significantly different to all other groups, P<0.05.
Preliminary analysis of estimated nephron number indicated a group effect (P=0.001) but no sex effect (P=0.417). Post hoc analysis indicated estimated nephron numbers were significantly lower in the control LPK compared with all other groups, corresponding to an approximately 27% reduction in nephron number (Fig. 7).
Discussion
The development of cystic kidneys, as seen in PKD and NPHP, eventuates in the progressive loss of renal function and is accompanied by extra-renal manifestations such as hypertension.Reference Chapman, Devuyst and Eckardt 12 There is considerable phenotypic variation in the presentation of PKD, consistent with the influence of environment and other modifying factors influencing disease outcomes.Reference Edmunds, Jayapalan, DiMarco, Saboorian and Aukema 25 A number of diseases including renal, cardiovascular and metabolic disease can be ‘programmed’ in utero,Reference Gluckman, Hanson, Cooper and Thornburg 2 , Reference Hales and Ozanne 26 with insult during either prenatal and/or postnatal development inducing permanent damage that can influence future disease onset, severity and progression.Reference Eriksson, Forsen and Tuomilehto 27 In the present study, we first determined that LPK rats had a significant nephron deficit compared with their wildtype Lewis counterparts. We then investigated the impact of improved prenatal and/or postnatal environment on nephron endowment and associated disease severity and progression in the rodent model. The impact of an improved postnatal environment was assessed by the cross-fostering of pups from homozygous LPK dams to healthy heterozygous LPK dams, while the impact of improved prenatal and postnatal environment was assessed by the inclusion of pups bred from and raised by heterozygous LPK dams. In addition, we included an additional group of pups bred from heterozygous WKY-LPK dams, assessing the impact of a healthy prenatal and postnatal environment on a different genetic background.
Rats from a healthy prenatal and postnatal environment showed a significant improvement in body weight gain, blood pressure and renal function indices. Rats which were cross-fostered, and therefore given an improved postnatal environment, also showed an improvement in phenotype, though not as marked as the animals born and raised under conditions of improved prenatal and postnatal environment. All the intervention groups showed a significant increase in nephron number compared with the control LPK. Overall, we observed a change from least to most disease affected phenotype with WKY-LPK:Pr/Pn≥LPK:Pr/Pn>LPK:Pn>>control LPK. An important consideration in the interpretation of this data is that only one group (LPK:Pn) were cross-fostered, which in itself is a postnatal environmental manipulation, that may induce physiological and epigenetic alterations.Reference McCarty 28 Despite this confounder, however, our results strongly support the hypothesis that an improved prenatal and/or postnatal environment is able to prevent a nephron deficit at 16 weeks of age with associated reductions in disease severity in the LPK model of PKD.
Although cystic expansion is inevitable in PKD, anything that increases the risk of renal disease is of particular clinical relevance. A low birth weight has been linked to increased risk of chronic kidney disease (CKD). This is likely to be due in part to the fact that the low birth weight is strongly associated with a reduction in nephron endowment.Reference Hoy, Hughson, Bertram, Douglas-Denton and Amann 3 , Reference Luyckx and Brenner 29 Although we were not able to collect birth or weaning weight in our study, we did measure nephron endowment and this was reduced in the LPK control animals compared with wildtype Lewis. Having established that the LPK exhibit reduced nephron number, a key outcome of this study was therefore determination of the effect of improved prenatal and postnatal maternal environment on nephron number in the LPK genetic model of PKD. Various studies have shown the kidney as being most vulnerable to a suboptimal environment during development in utero.Reference Moritz, Wintour, Black, Bertram and Caruana 30 Perturbations during fetal development are reflected through a reduction in kidney weight or more importantly, nephron number. Such congenital nephron loss causes the remaining nephrons to undergo hypertrophy to maintain adequate glomerular filtration. Such changes can predispose the kidney to glomerulosclerosis and proteinuria, perpetuating as kidney disease in adult life.Reference Hostetter, Olson, Rennke, Venkatachalam and Brenner 31 , Reference Simons, Provoost and Anderson 32 Risk of hypertension and kidney disease increases with time.Reference Luyckx, Bertram and Brenner 33 In the case of PKD, at the time of pregnancy, LPK dams are hypertensive, have renal dysfunction and are anaemic.Reference Phillips, Hopwood and Loxley 21 Their disease state will affect the fetal oxygen supply, negatively impact placental growth and the likely increase in stress hormones will also impact fetal development.Reference Fowden, Giussani and Forhead 34 , Reference Graignic-Philippe, Dayan, Chokron, Jacquet and Tordjman 35 Further studies to elucidate the cause and mechanism of intrauterine impairment will further our understanding of nephrogenesis and phenotypic variability observed in PKD patients. Given that nephron number can be normalized by improving postnatal environment in rodent models of maternal environment insufficiency,Reference Wlodek, Mibus and Tan 10 we hypothesized that an improved either prenatal and/or postnatal environment could recover nephron number in the PKD model. Notably, our results demonstrated that a healthy postnatal environment did in fact have such an effect, with the animals with improved postnatal environment having significantly higher nephron counts than the control LPK animals. Clinically, this highlights the importance of maternal environmental conditions for humans at risk of PKD, as nephron endowment is set by 34 weeks’ gestation, and ensuring the health of the mother during the late gestation period could translate to delaying the onset or slow the progression of PKD in any children that inherit the genetic disorder.
With specific reference to body weight and postnatal growth, the body weight of male and female control LPK over the study period was significantly less than the other groups, and this was evident at the study start age of 6 weeks. Results from the cross-fostered animals indicated that an improvement in the postnatal environment was able to partially reverse this deficit in body weight; however, the greatest gain was seen in those animals who had a healthy prenatal and postnatal environment. In addition, we observed that across the cohorts as a whole, lower body weight by study endpoint was correlated with increased both plasma urea and creatinine. As this relationship is an association only, it does provide insight into the relationship between body weight and the degree of severity of CKD. At the age used for breeding in this study (12–14 weeks), homozygous LPK dams are already exhibiting signs of renal disease,Reference Phillips, Hopwood and Loxley 21 and will have a compromised uterine and lactation environment for the pups, and therefore compromising fetal development. The kidneys are particularly vulnerable to perturbations during fetal development, and this is in turn associated with an increased risk of renal disease in adult life.Reference Luyckx and Brenner 29 , Reference Vikse, Irgens, Leivestad, Hallan and Iversen 36 Indeed, control LPK and cross-fostered animals exhibited reduced renal function when considering the UPC results and plasma urea and creatinine in comparison to those animals which had improved prenatal and postnatal environments.
Although development of hypertension has important implications in the normal population, it is of special clinical interest in PKD where the majority of PKD patients develop hypertension and early establishment of hypertension is associated with poor prognosis.Reference Schrier 37 In our study, a poor prenatal and postnatal environment was associated with the most severe hypertensive phenotype, noting that tail-cuff plethysmography was used to determine blood pressure in this study, and further changes may have been noted between the intervention groups if more direct methodology such as telemetry had been used to determine this parameter.Reference Van Vliet, Chafe Ll Fau-Antic and Antic 38 Our results also indicated a reduction in both heart and left ventricular weight to body weight ratio in the WKY-LPK:Pr/Pn group. The explanation for this effect could be two-fold. It may be a primary outcome, associated with the improved prenatal and postnatal developmental conditions, with comparable results evident in human studies where poor fetal development is proportionally correlated with cardiac dysfunction.Reference Crispi, Hernandez-Andrade and Pelsers 39 It may also be a secondary effect, associated with the lower blood pressure in the WKY-LPK:Pr/Pn group, given the critical and well-established hypertrophic maladaptive response of the left ventricular mass to increased cardiac workload in hypertension.Reference Tomek and Bub 40 Future studies would be required to delineate the relative impact of these different contributors.
In PKD, the expansion of cysts is correlated with loss of renal parenchyma and renal functionReference Grantham, Chapman and Torres 41 and larger kidney size has been positively correlated with a more rapid progression to end-stage renal failure.Reference Halvorson, Bremmer and Jacobs 42 When assessing kidney mass, a decrease in kidney to body weight ratio was evident in the female animals in the WKY-LPK:Pr/Pn cohort, while an improvement in both cystic index and cyst area was seen in this group as a whole, indicating an improvement in the renal structural phenotype in association with improved prenatal and postnatal conditions specifically on the different genetic background. That the improvement in cystic index was not reflected in kidney mass in the male WKY-LPK:Pr/Pn may be due to males having a more severe disease phenotype that is less responsive to intervention than their female counterparts, as supported by our plasma creatinine data from this and our previous studiesReference Phillips, Hopwood and Loxley 21 and consistent with results from human studies and other animal models of PKD.Reference Gretz, Ceccherini and Kranzlin 43 , Reference Silbiger and Neugarten 44 This may be due to PKD associated factors or be an inherent feature of female rats, which have recently been shown to have a distinct pattern of transporters along the nephron that confers a protective phenotype including resistance to ischaemia and oxidative stress,Reference Halvorson, Bremmer and Jacobs 45 features we have previously reported in the LPK rat modelReference Ding, Kalaignanasundaram and Ricardo 46 , Reference Ow, Abdelkader, Hilliard, Phillips and Evans 47 . We must be careful with the interpretation of sex effects arising from this study, however, as a relatively small number of animals were in each treatment group/sex cohort. We do believe this was countered by our undertaking of a preliminary GLM ANOVA to identify group or sex effects, including their interaction, using the power of the whole cohort of animals before subsequent ANOVA and post hoc analysis. However, future studies will require additional numbers to extend the results currently presented.
We further found that renal function, as assessed by UPC ratio, declined at a slower rate in the WKY-LPK:Pr/Pn with a similar pattern seen in the LPK:Pr/Pn. There was some variability, however, in the UPC data, and this may have been associated with urine only being collected for a short timeframe (equivalent to a spot collection) rather than over a 24 h period. This is a limitation of the study and precluded any final estimation of creatinine clearance as an indicator of renal function. At study endpoint, however, both serum urea and creatinine, further indicators of renal function, were elevated in control LPK group and LPK:Pn compared with offspring with improved prenatal and postnatal environment. Overall, these results indicate that similar to the changes we saw in blood pressure, an improvement in postnatal environment alone was not sufficient to improve renal function.
Notably in this study, the pups from the WKY-LPK heterozygous dams showed overall the best phenotype, including a notable reduction in cystic index. This suggests that the different genetic background, being the WKY strain, conferred an additional protective effect. The WKY and Lewis rat strains are phylogenetically quite distinctReference Canzian 48 and as such, differing genes may have interacted to modulate disease phenotype.Reference Consortium, Saar and Beck 22 , Reference Mrug, Zhou and Yang 49 Genetics and the impact of modifier genes is an important consideration in determining disease severity and prognosis. In PKD, modifier genes may impact age of onset of ESRD, presentation of extra-renal manifestation such as cardiovascular disease, liver cysts, retinal degeneration and brain malformation.Reference Harris and Torres 50 , Reference Singh 51 In a recessive mouse model of PKD, for example, Kif12 has been identified as a modifier gene, accelerating disease effects such as increased kidney to body weight ratio and cyst size.Reference Mrug, Zhou and Yang 49 The challenge with identifying genetic modifiers is their non-pathogenic nature under normal conditions, thereby rendering them difficult to isolate. In our present study, we did not perform genetic linkage analysis in order to identify genetic modifiers and did not isolate the NEK8 mutation onto the WKY background. An additional factor that must be considered in the interpretation of this result and that of the other intervention groups is that a limited number of dams were used to generate the offspring. Additional breeding and intensive genetic linkage studies will therefore need to be carried out to identify genetic factors contributing to phenotypic disease variability.
In summary, we have shown for the first time that PKD is associated with a decrease in nephron number and that improvement in prenatal and postnatal environment positively influences disease phenotype in a rodent model of PKD. Although improvement in either prenatal or postnatal environment can confer positive disease prognosis, it is the compounded effect of both that appears to provide maximal reduction in disease severity. Furthermore, genetic background and a hypothesized influence of modifier genes could also be an important consideration. Future research to identify beneficial, disease-minimizing genetic modifiers alongside the ongoing development of education and lifestyle strategies to improve gestational conditions for PKD gene carrying individuals will be of great importance.
Acknowledgments
The authors thank and acknowledge Mrs Debra Birch and Ms Nicole Vella (Microscopy Unit, Macquarie University, Sydney, Australia) for their assistance with histological processing of kidney samples. Also thanks to Dr Cara Hildreth for her assistance in ordering and monitoring of animals and Ms Rochelle Boyd in helping with tissue collection at study endpoint (Faculty of Medicine and Health Sciences, Macquarie University).
Financial Support
A.D. was supported by an Australian Postgraduate Award while undertaking this research with project support from Macquarie University. K.M.M. is supported by a National Health and Medical Research Council Fellowship (APP1078164).
Conflicts of Interest
None.
Ethical Standard
The authors assert that all procedures contributing to this work comply with the ethical standards of the National Health and Medical Research Council Australian code of practice for the care and use of animals for scientific purposes (2013) and were approved by the Animal Ethics Committee of Macquarie University.