


Introduction
Owing to the relatively short duration and sparse spatial coverage of Antarctic meteorological data, difficulties remain in explaining fully the history and forcing of the Antarctic surface mass balance. For instance, over recent decades to centuries, the records from different regions of the Antarctic ice sheet show large differences (e.g. Reference Richardson, Aarholt, Hamran, Holmlund and IsakssonRichardson and others, 1997). Although increasing accumulation rates have been reported for many sites (Reference Pourchet, Pinglot and LoriusPourchet and others, 1983; Reference Peel and MulvaneyPeel and Mulvaney, 1988; Reference Morgan, Goodwin, Etheridge and WookeyMorgan and others, 1991; Reference Mosley-ThompsonMosley-Thompson and others, 1995), other sites show decreasing trends (Reference Graf, Reinwarth, Oerter, Dyurgerov and MillerGraf and others, 1990; Reference Kameda, Nakawo, Mae, Watanabe and NaruseKameda and others, 1990; Reference Bindschadler, Vornberger and ShabtaieBindschadler and others, 1993; Reference Isaksson and KarlénIsaksson and Karlén, 1994; Reference Jiawen, Dahe and AllisonRen and others, 1999). A similar situation is seen for isotope temperature records (Reference Isaksson, Karlén, Gundestrup, Mayewski, Whitlow and TwicklerIsaksson and others, 1996; Reference Jiawen, Dahe and AllisonRen and others, 1999; Reference Cunde, Jiawen, Dahe, Hongqin, Weizhen and AllisonXiao and others, 2001). This complexity has been attributed to either a change in atmospheric circulation patterns, or post-depositional modification of the records by different meteorological factors operating in different regions. The International Trans-Antarctic Scientific Expedition (ITASE) program aims to investigate the decadal-to-centennial-scale climatic variations of the Antarctic ice sheet and to assess natural climate variability over several decades in order to better understand the global implications (Reference Mayewski and GoodwinMayewski and Goodwin, 1999).
Within the framework of Chinese ITASE, several shallow cores were obtained along traverse lines during the 1996/97, 1997/98, 1998/99 and 2001/02 austral summers (Reference DaheQin and others, 2000). Here, we discuss the spatial variations of the surface accumulation rate, as well as the variations of accumulation and a temperature proxy since the 1940s as deduced from cores recovered during Chinese or joint Australian–Chinese expeditions to the west and east sides of the Lambert Glacier basin (LGB; Fig. 1).
Description of Data
Lambert Glacier is one of the largest outlet glaciers in East Antarctica, draining a total area of 1.550×10⁶ km2, including 71 ×103 km2 of floating ice in the Amery Ice Shelf (Reference FrickerFricker and others, 2002). The grounded portion of the Lambert–Amery system covers 16% of the grounded East Antarctic ice sheet, and has an estimated average surface mass balance of 87 kg m–2 a–1 (Reference Higham and CravenHigham and Craven, 1997). The glacier is flanked along much of its length by the Prince Charles Mountains, and discharges into Prydz Bay via the Amery Ice Shelf (Fig. 1).
Locations of firn cores (solid dots) from the LGB. The eastern and western LGB traverse lines are only shown for the initial ~500km (solid lines), accumulation distributions for which are discussed in the text.
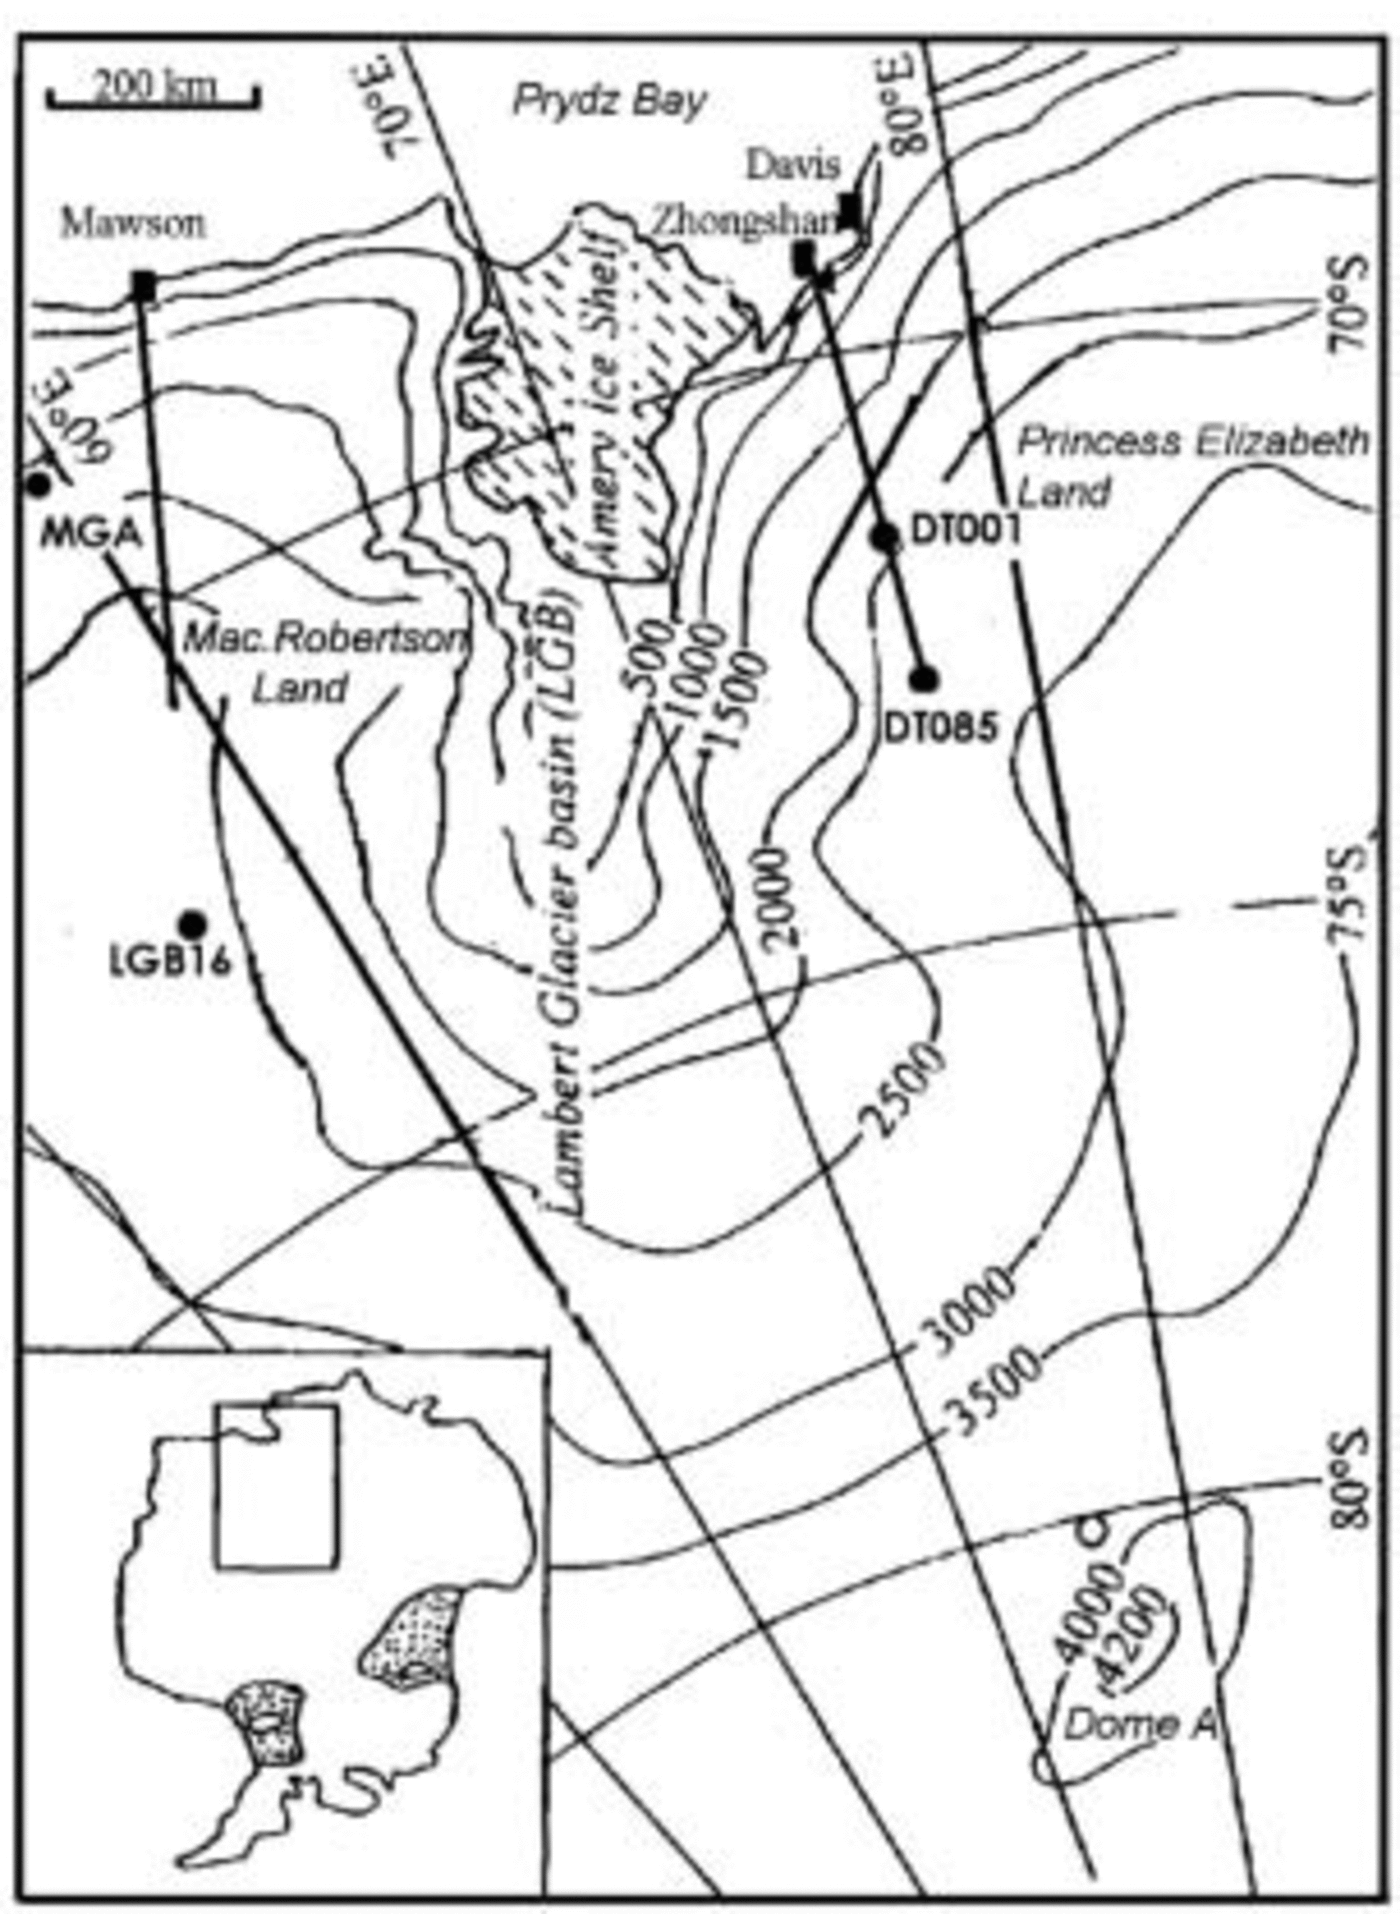
Stake measurements of surface mass balance along the Australian National Antarctic Research Expedition (ANARE) traverse route encircling the LGB were commenced in 1990. However, measurements along the whole ANARE route, including the east side, were only made for the 1994 season (Reference Higham, Craven, Ruddell and AllisonHigham and others, 1997; Fig. 1). Subsequent Chinese National Antarctic Research Expedition (CHINARE) measurements on the east side were made from 1996 to 1998. In addition, a series of 1 m depth snow pits were sampled every 4 km along the coastal 476 km on the eastern-side route. These samples were analyzed to estimate the spatial distribution of δ18O and the accumulation rate.
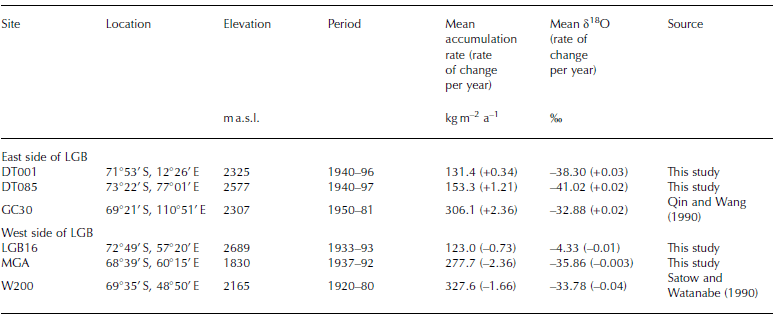
During a joint Australian–Chinese oversnow traverse in 1992 on the west side of the LGB, two firn cores were drilled at MGA and LGB16 (Table 1), to 27 and 15.2m depths, respectively. The cores were dated stratigraphically using isotopic profiles (δ18O), electrical conductivity measurements and visible stratigraphy. Snow-accumulation stake data (commencing in 1990) were additionally available as a reference every 2 km along the traverse route. A series of firn cores (~10m long) were drilled adjacent to each of the two sites to check the dating precision (Reference Jiawen, Dahe and AllisonRen and others, 1999). During the 1996/97 and 1997/98 austral summers, a second pair of firn cores were extracted at DT001 and DT085 on the east side of the LGB (Table 1; Fig. 1). The depths of these were 50 and 52 m, respectively. Isotope and chemical profiles (Cl–, Na+ and NO3 –) were used for cross-dating, and the precision is believed to be within ±2 years for the upper 20m (Reference DaheQin and others, 2000; Reference ZhangZhang and others, 2002). Only the top sections of these two cores, which roughly match the time periods corresponding to those of MGA and LGB16, were used in our comparison. The four cores were sampled every 3 cm in the laboratory.
Rates of change in accumulation and δ18O records in firn cores from the east and west sides of the LGB
We use estimates of the meridional moisture transport across 60˚ S in the Southern Ocean, derived by Reference Slonaker and Van WoertSlonaker and Van Woert (1999), to clarify the impact of the regional circulation on the distribution of accumulation for the ice sheet between 45˚ E and 90˚ E. The subsector 45–70˚ E covers the western LGB, while 70–90˚ E covers the eastern LGB.
Meteorological data for Davis and Mawson stations have been extracted from the Australia Data Archive for Meteorology. Precipitation data are available for 25 years at Davis (though the record is not continuous), but no precipitation observations have been made at Mawson because of the strong drifting/blowing snow. Temperature records at Davis started in 1957 and have a gap from 1965 to 1968. Continuous temperature data are available from Mawson since 1954.
Results and Discussion
In the following discussion, the accumulation distribution from the coast to the interior is compared for both sides of the LGB. Analyses of meridional moisture flux and meteorological evidence are used to interpret the spatial complexity of the accumulation distribution. Temperature proxy (δ18O) and accumulation recorded in the four cores are used to reveal temporal variations. Only the top sections of the cores, covering the last 50 years, are discussed in this study.
Accumulation distribution and its relationship to atmospheric moisture fluxes
The 1994 ANARE stake measurements around the entire LGB are used to investigate accumulation-rate differences between the two sides of the basin (Fig. 2a and b). The CHINARE stake data (Fig. 2c), with the measurement in 1996/97 covering 65–300 km, and in 1998 covering the 0– 476 km section of the line, are also shown. The ANARE and CHINARE data show a similar distribution on the east side, with a generally decreasing southward trend. This coincides with the pattern observed for most other coastal regions (Reference Giovinetto, Waters and BentleyGiovinetto and others, 1990). Based on all the ANARE and CHINARE observations, the average southward decrease in the snow accumulation rate for the eastern LGB is 52 kg m–2 a–1 (100 km)–1, which is similar to the gradient observed for Wilkes Land (Reference Young, Pourchet, Kotlyakov, Korolev and DyurgerovYoung and others, 1982) and Dronning Maud Land (Reference Isaksson and KarlénIsaksson and Karlén, 1994). The stake measurements of accumulation rate along the eastern line agree with values derived from the snow-pit observations conducted every 2 km, which show mean snow accumulation rates of 140–210 kg m–2 a–1 for the segment of the route between 0 and 65 km from the coast, 70–140 kg m–2 a–1 between 65 and 140 km, <46 kg m–2 a–1 between 140 and 280 km, and 46–70 kg m–2 a–1 between 280 and 500 km.
Distribution of the 1994 surface accumulation along the initial 500 km traverse line over the western (a) and eastern LGB (b). Surface accumulation measurements in 1998 and the total values for 1996–98 along the eastern line are also shown (c). For the western LGB area, the measurements started at LGB00 (~130km from the coast). The dense profiles are the 10-point smoothed variations. The dashed lines highlight the areas of minimum accumulation rate.
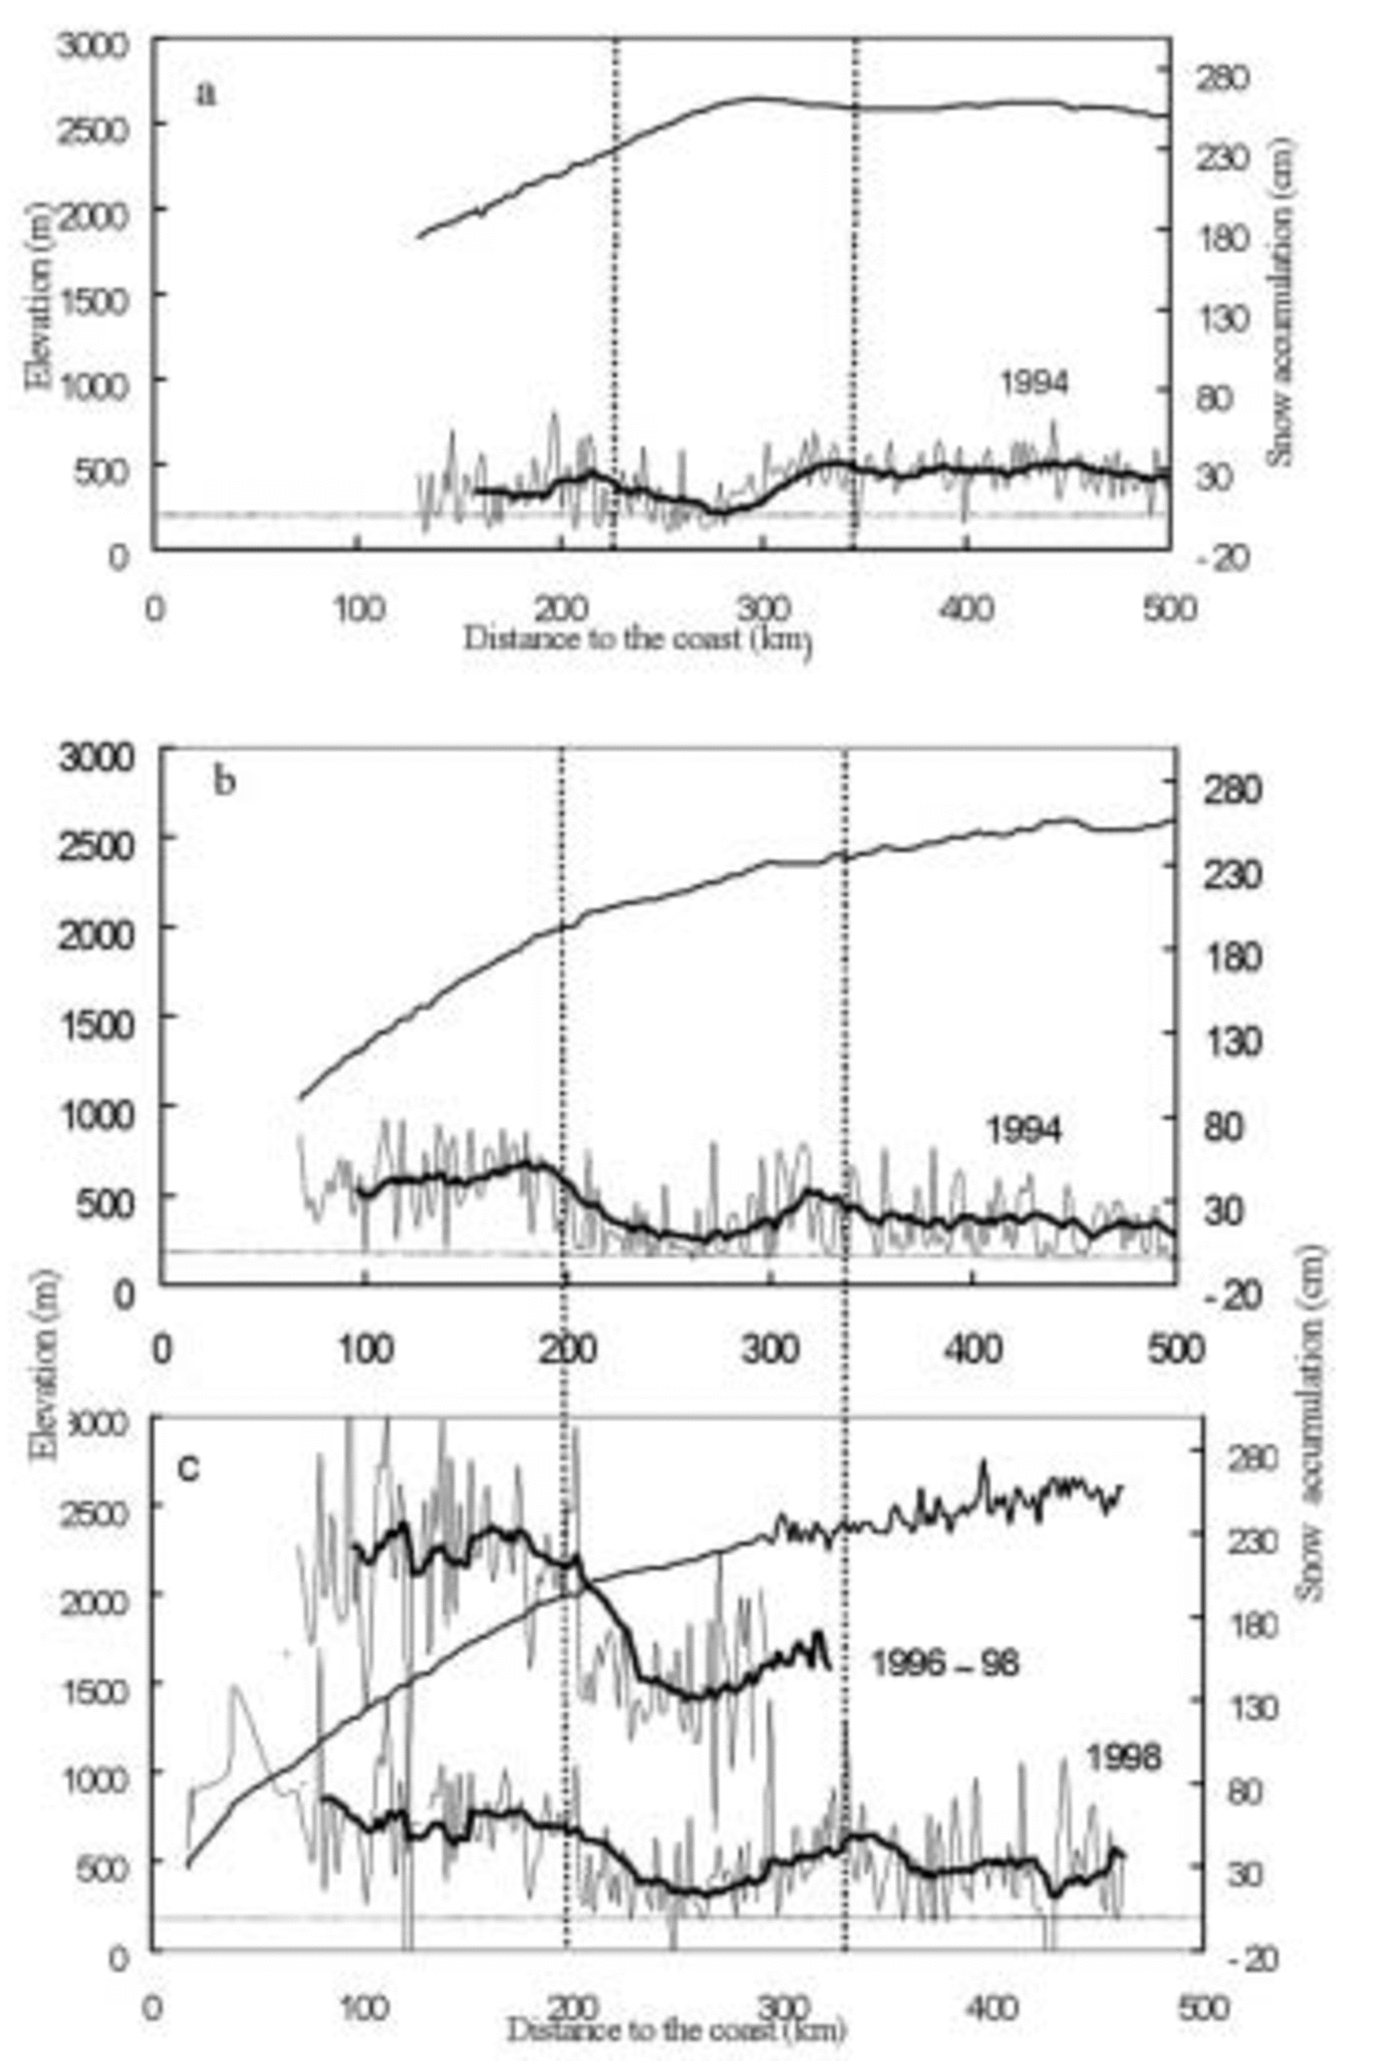
However, on the west side in Mac. Robertson Land, a moderate mean accumulation of 72 kg m–2 a–1 was observed for the coastal 200 km, increasing to 88 kg m–2 a–1 between 300 and 500 km inland. On both sides of the basin, the 200– 300 km region is a transition zone between the coast and plateau, with a significant minimum in accumulation rate (~4kgm–2 a–1). This region, on both sides, coincides with a divide in the ice surface topography, and the minima are probably due to divergence in moisture transport or in windblown snow redistribution. A similar dry belt with annual accumulation of <5 kg m–2 a–1 has been observed for other East Antarctic regions (Reference Pettré, Pinglot, Pourchet and ReynaudPettré and others, 1986; NIPR, 1997; Reference Van den BroekeVan den Broeke and others, 1999). We also notice that the accumulation rate is relatively higher on windward slopes than on leeward slopes, as has been reported for Wilkes Land (Reference GoodwinGoodwin, 1990).
The accumulation variation along the western LGB line differs from that of most coastal regions of the East Antarctic ice sheet, including the eastern LGB. We suggest that the difference in spatial variability between the eastern and western LGB is due to the differences in the main vapor transport paths that are determined by the mean atmospheric pressure field and modified by topography (Reference Budd, Reid and MintyBudd and others, 1995). On the west side of the LGB, the flattest region is around the head of the Amery Ice Shelf and therefore acts as a moisture channel. This would explain the higher accumulation in the middle of the western LGB traverse line, and the lower accumulation over the initial section.
Slonaker and Van Woert (1999) used satellite data to derive the three-dimensional atmospheric moisture and wind fields over the Southern Ocean for 1988, from which they estimated water-vapor transport. They obtained moisture and vertical temperature fields from TIROS Operational Vertical Sounder (TOVS) instruments on board US National Oceanic and Atmospheric Administration (NOAA) satellites. The surface wind field over the ocean was derived from the Special Sensor Microwave/Imager (SSM/I) passive microwave instrument on Defense Meteorological Satellite Program (DMSP) satellites, and the winds at height were calculated from the thermal wind equation using the TOVS-derived virtual temperature fields. We use their results for the meridional moisture flux across 60˚ S to clarify the vapor transport paths for the LGB. Moisture fluxes for the sector between 45˚ E and 90˚ E are shown in Figure 3. The moisture fluxes decrease sharply with elevation (Reference Slonaker and Van WoertSlonaker and Van Woert, 1999). The column-integrated moisture flux for the subsector from 70˚E to 90˚ E averages 18 kg m–1 a–1 poleward. However, for the subsector from 45˚E to 70˚E the average flux is 5 kg m–1 s–1 Equatorward. This is one of only two regions around the hemisphere where the moisture flux across 60˚ S is away from Antarctica. Moisture fluxes at specific locations are also in opposite directions on the east and west sides of the LGB: for example, +2 kg m–1 s–1 (Equatorward) at 60˚ E, +4 kg m–1 s–1 at 55˚ E, but –13 kg m–1 s–1 (poleward) at 80˚ E.
Meridional moisture fluxes (in kgm –1 s –1) across 60˚S and 70˚ S latitude, for the sector 45–90˚ E. The fluxes across 60˚ S are from Reference Slonaker and Van WoertSlonaker and Van Woert (1999). Fluxes across the angular heavy line (approximately 70˚ S) are from Reference Connolley and KingConnolley and King (1996). The coastline is plotted as a dotted line.

Water-vapor transport across approximately 70˚S (which approximates the average latitude of the Antarctic coast in the study region) for the sector from 2.4˚W to 110.5˚E was simulated by Reference Connolley and KingConnolley and King (1996) using the UKMO climate model. For this sector, between Sanae and Casey stations, data from eight coastal radiosonde stations are available to validate the modeled net moisture flux. These fluxes exhibit a similar pattern to those across 60˚S for the same sector, but the magnitudes are much smaller. For instance, the flux between 70˚ E and 90˚ E is around –5 kg m–1 a–1, while between 60˚ E and 70˚E it is +1.5kg m–1 s–1 (Fig. 3). The vapor transport over the coastal area of the basin displays a clockwise circulation. The interaction of eastward-moving cyclones over the high-latitude Southern Ocean with the topographic disruption of the LGB and the Prince Charles Mountains, for an otherwise uniform coast, induces clockwise moisture circulation in the region. Further, the pattern of winds over this area favors additional accumulation of drift snow on the west side of the LGB and a ‘rain shadow’ on the east (Reference AllisonAllison, 1998).
In the following we discuss how this circulation pattern, combined with large-scale atmospheric phenomena such as the semi-annual oscillation (SAO), may lead to a remarkably different pattern of climatic variability over past decades between the two sides of the basin.
Differences in recent decadal climate variability between the two sides of the LGB
Large interannual temperature and accumulation-rate variability is known to complicate direct comparison between ice-core records from different sites (Reference MorganMorgan, 1985; Reference Mosley-Thompson, Thompson, Grootes and GundestrupMosley-Thompson and others, 1990). Considering the different direction of net moisture transport and the different pattern of accumulation distribution between the two sides of the LGB, we might expect different climatic records in their ice-core proxies.
In Figure 4, stable-isotope (δ18O) records from firn cores from each side of the LGB are compared with the meteorological records for the closest long-term station (Davis for east LGB, Mawson for west LGB). Davis has shown a warming of 0.2˚C since 1957, while Mawson has shown a cooling of 0.46˚C since 1954. The same trend is also seen in the annual mean daily maximum temperature (the rate is +0.013˚Ca–1 at Davis and –0.01˚Ca–1 at Mawson) as well as in the annual percentage occurrence of temperature above 0˚C (+0.08% a–1 at Davis and –0.007% a–1 at Mawson).
(a) Firn-core records of δ18O (7-point smoothed) over the eastern and western LGB for the past 50 years (lowest panel). Instrumental surface temperature records at Davis and Mawson stations (upper panel), annual mean daily maximum temperature (second panel) and the annual percentage occurrence of temperature above 0˚C (third panel) are shown for comparison. The dashed lines show the trends of variation from linear regressions, and the horizontal grey lines are the averages. (b) Firn-core records of annual accumulation rates over the eastern and western LGB for the past 50 years (lowest panel). Instrumental records of precipitation at Davis station (upper panel), and records of the annual percentage of snowfall occurrence at Davis and Mawson stations (middle panel) are shown for comparison. The dashed lines show the trends of variation from linear regressions.

The relationship between 10m firm temperature and surface snow δ18O has a gradient of 1.19‰˚C–1 for the eastern LGB and 1.67‰˚C–1 for the western LGB. Hence the δ18O increases in DT001 and DT085 firn cores since 1940 would be equivalent to temperature increases of about 1.1˚C and 1.4˚C respectively over the period. A similar rate of increase has been reported in Dronning Maud Land (Reference Isaksson, Karlén, Gundestrup, Mayewski, Whitlow and TwicklerIsaksson and others, 1996). Conversely, the δ18O decreases in the MGA and LGB16 firn cores are equivalent to temperature decreases of about 0.1˚C and 0.4˚C, respectively. We suggest that the reason for the difference between the two sides of the drainage area is that, on the east side of the LGB, increased inland moisture advection accompanies higher temperatures over the Southern Indian Ocean; while on the west side, as seen in Figure 3, the air-mass trajectories are not always directly from the coast to inland, weakening the link between δ18O and sea surface temperature. It should be noted that there is a similar pattern of δ18O fluctuation between DT001 and DT085, but not between MGA and LGB16 (Fig. 4a). We also note that the mean δ18O in the firn core at the western site LGB16 (–44.3‰) is somewhat lower than that for the eastern site DT085 (–41.0‰). After correction for the elevation difference between the sites, the isotope difference between LGB16 and DT085 is about 2‰. We suggest that much of the snow in the western LGB may derive from redistribution instead of directly from the ocean, and this may lead to the lower values of δ18O and a firn-core climate record that may be disturbed by local effects.
Accumulation variations in DT001 and DT085 firn cores, which have similar mean accumulation rates, exhibit similar patterns during the past half-century. However, accumulation changes in the two cores from the western LGB are not in phase during the past 50 years, possibly due to redistribution of surface snow (Fig. 4b). Figure 4b also compares the accumulation histories from the four cores with the precipitation data from Davis and Mawson stations. A crude precipitation measurement has been made at Davis station since 1957, except for the period 1965–76. The monthly number of days when precipitation occurred is also shown in Figure 4 for both stations, but observations of precipitation have never been made at Mawson because of the high frequency of drifting/blowing snow compared to falling snow. A precipitation trend of roughly +0.032mma–1 is seen at Davis since 1957, with a more rapid rate of increase (3.33mma–1) during the 1990s. The percentage of days of precipitation occurrence at Davis increased at 0.026% a–1, whereas at Mawson the occurrence decreased at a rate of 0.027% a–1.
The rates of change in δ18O and accumulation for the four cores are summarized in Table 1. Also shown are the results from another two cores: GC30 in Wilkes Land (east of the LGB) and W200 on the Mizuho Plateau (west of the LGB). These support the premise that the LGB is a boundary between different climate regimes for the East Antarctic ice sheet. Over the last 50 years, both δ18O and accumulation rate have increased over the eastern LGB, whereas both have decreased over the western LGB.
Correlation of accumulation and temperature proxies with variation of the Southern Indian Ocean low
Because large vertical and horizontal temperature gradients are constantly present between the continent and its immediate surroundings, near-surface temperature in Antarctica is very sensitive to changes in the low-level atmospheric circulation (Reference Van den BroekeVan den Broeke, 2000). The circulation system that has the largest impact on Antarctic temperature is the Southern Hemisphere semi-annual oscillation (SAO) (Reference Van LoonVan Loon, 1967; Reference Van den BroekeVan den Broeke, 1998), a twice-yearly contraction/expansion of the circumpolar low-pressure belt. Previous studies (e.g. Reference EnomotoEnomoto, 1991) have shown a close relationship between snow accumulation in East Antarctica and sea-level pressure (SLP) in the Southern Ocean, and also between the stable isotopes and the Southern Ocean surface temperature (Reference Delmotte, Masson, Jouzel and MorganDelmotte and others, 2000). The US National Centers for Environmental Prediction/US National Center for Atmospheric Research (NCEP/NCAR) re-analyses provide a record of >50 years of global analyses of atmospheric fields. These are available to support studies of the correlation between various historical climate proxy records on the global scale (Reference KistlerKistler and others, 2001).
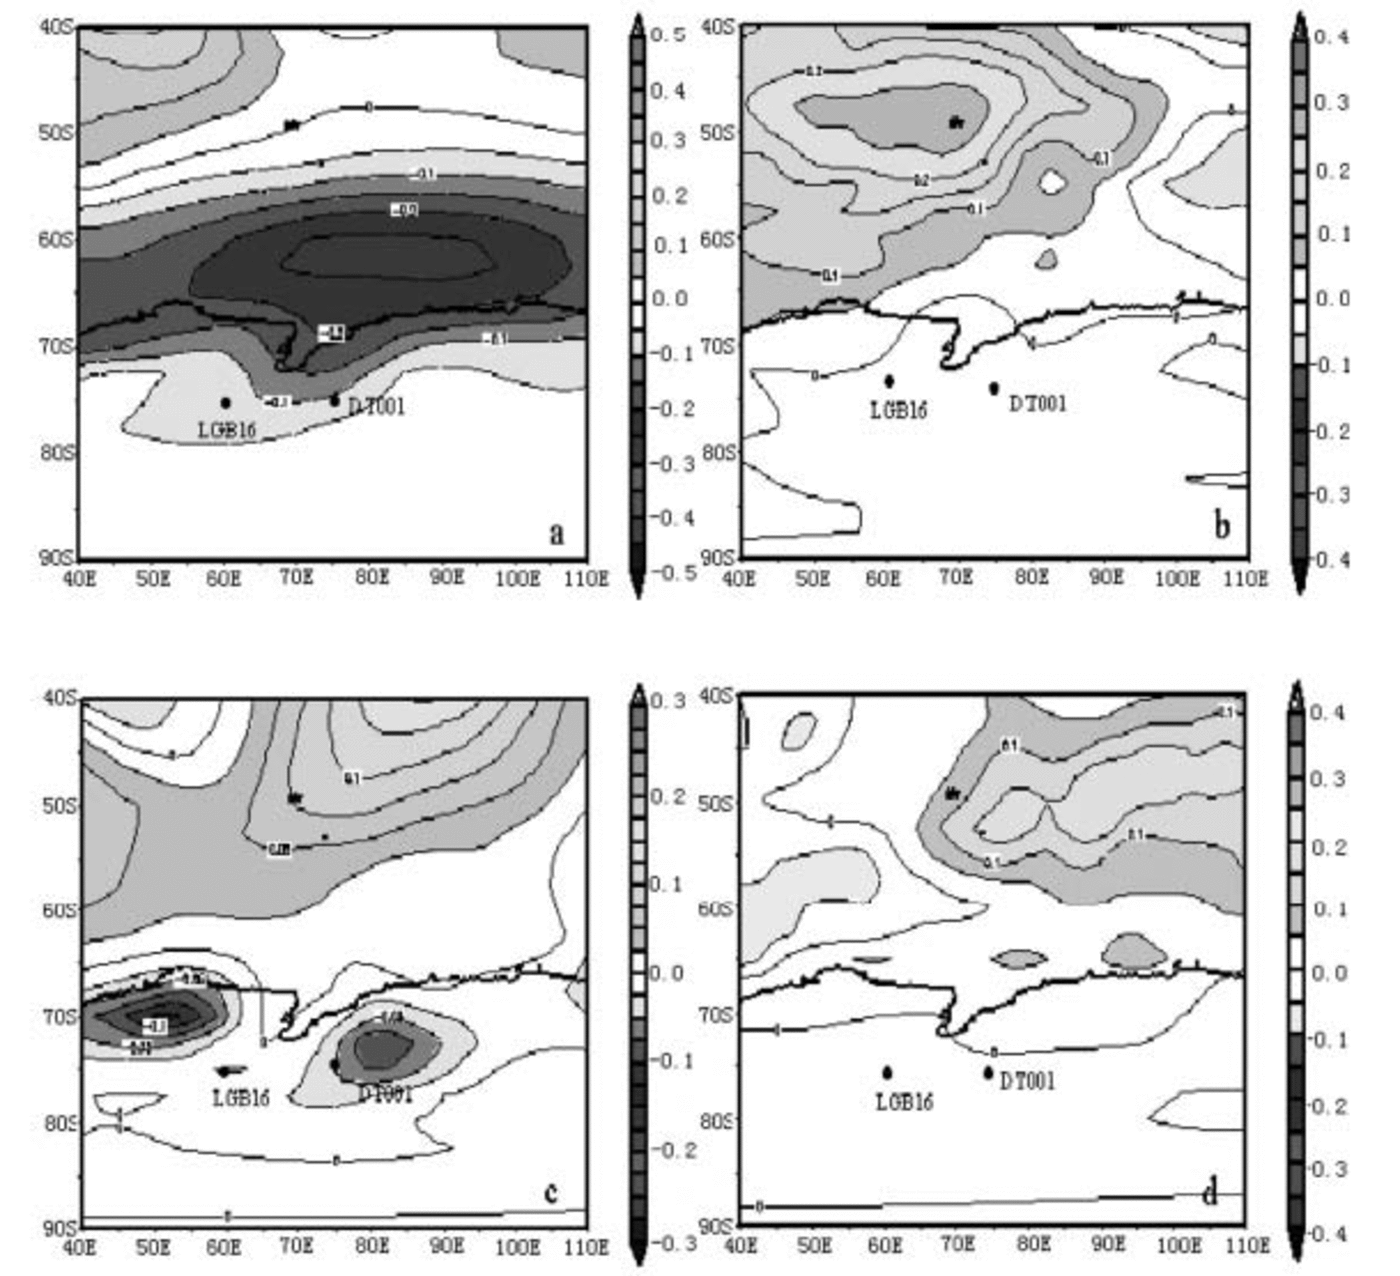
We use the NCEP/NCAR re-analyses and the Climate Diagnostic Center Interactive Plotting and Analysis tools to investigate the correlation between SLP and the accumulation rates over the eastern (Fig. 5a) and western LGB (Fig. 5c) since 1948. A significant (|r| > 0.3, α = 0.01) negative correlation exists between DT001 accumulation change and a Southern Indian Ocean low (SIOL), which lies to the north of Prydz Bay, but there is no correlation between the LGB16 accumulation and the SIOL. This suggests direct moisture supply from the SIOL to the eastern LGB, but not to the western LGB. Similarly, a high positive correlation is found between the DT001 δ18O series and the surface temperature of the Southern Indian Ocean (Fig. 5b). A similar result is found between Law Dome ice-core δ18O series and the temperature of the adjacent ocean there (Reference Delmotte, Masson, Jouzel and MorganDelmotte and others, 2000). But again, no significant correlation is found for the LGB16 δ18O record (Fig. 5d).
Correlation of DT001 (a) and LGB16 (c) accumulation with SLP, and the correlation of DT001 (b) and LGB16 (d) δ18O with surface air temperature from the NCEP/NCAR numerical re-analyses. The time-spans of the correlations depend on when the cores were drilled: they are 1948–96 for DT001and 1948–92 for LGB16.
Reference Van den BroekeVan den Broeke’s (2000) calculation based on the SAO shows that locally enhanced advection of air from the ice-sheet interior has caused strong cooling in the western LGB since the 1950s, but low-level warming over continental Antarctica and coastal Victoria Land and Princess Elizabeth Land, at both the 800 hPa and 2 m level. Van den Broeke also found that temperature change at coastal Antarctic stations carries the fingerprint of warming/cooling since mid-1970. Our study supports Reference Van den BroekeVan den Broeke’s (2000) conclusions.
Conclusions
Lambert Glacier, the Amery Ice Shelf and the Prince Charles Mountains form a major north–south topographic feature in the East Antarctic ice sheet, and this region is also a significant boundary between different climate regimes. There is a large-scale atmospheric transport of moisture towards the interior of the ice sheet across both 60˚S and 70˚ S on the east side of the basin, but the moisture transport is away from Antarctica on the west. This clockwise circulation of air masses results in a difference in the spatial distribution of surface accumulation. The accumulation rate decreases towards the south, as it does for most ice-sheet coastal regions, but on the western flank of the LGB there is a slight tendency for the rate to increase with distance south over the first 500 km.
Firn cores from the east and west of the basin show opposite trends in both stable-isotopic temperature and accumulation variation over the past 50 years. On the east side, temperatures have warmed and accumulation has increased, whereas in the west, temperatures have cooled and accumulation has decreased. Different cores from the east side show a similar pattern of variability since the 1940s, but on the west, separate core records are not well correlated, possibly because of the impact of snow redistribution. In the east, where the moisture transport is from the ocean to the ice sheet, there is a negative correlation between accumulation change and a SIOL which lies to the north of Prydz Bay, and positive correlation between changes to δ18O in surface snow and the sea surface temperature in the same region. These relationships are not seen in the west. The opposing trends in temperature and precipitation are also evident in meteorological observations from Davis (east) and Mawson (west) since the 1950s.
A changed circulation pattern for coastal Antarctica may explain the different decadal climate variability on the two flanks of the LGB. The position and strength of the SIOL plays an important role in climate variability for the eastern LGB. This study suggests that in some regions, such as the LGB, complex local circulation, rather than large-scale continental or global circulation, may regulate the climate of the ice sheet.
Acknowledgements
The authors are grateful to the staff of the Office of Chinese Polar Administration for establishing the field logistics. We would like to thank R. Slonaker, now at Raytheon ITSS Corporation, for providing the moisture flux data, and D. Shepherd and H. Hutchinson at the Bureau of Meteorology, Australia, for providing the meteorological data for Davis and Mawson stations. This work is supported by the National Natural Science Foundation of China (40305007), the Ministry of Science and Technology of China (2001CB711003, 2001DIA50040) and the Chinese Academy of Sciences (KZCX2–303).



