Introduction
Due to the changing global climate and the need for increased efficiency in energy production methods, there has been a big increase in the research on alternative energy sources and ways to increase the efficiency of current systems, such as thermoelectric generators. Thermoelectric generators are systems that convert heat into electricity without moving parts and therefore are of high interest for increasing the efficiency of heat producing systems. The thermoelectric phenomena involve movement of charge carriers due to temperature gradient known as the Seebeck effect and the changing of temperature due to the moving of charge carriers known the Peltier effect. This allows for two types of devices: thermoelectric generators, which generate electricity from a temperature difference, and Peltier coolers, which use current to cool down devices. Both of these use thermoelectric materials to achieve their function. Thermoelectric materials for power generation are highly degenerate semiconducting materials [Reference Rowe1], which should have a high Seebeck coefficient, high electric conductivity, and low thermal conductivity. The combination of those properties is usually summarized as a figure of merit (Z) or more conveniently ZT, which has no units. ZT = (σS 2/κ)T, where σ is the electronic conductivity, S is the Seebeck coefficient, κ is the thermal conductivity, and T is the temperature in degrees kelvin [Reference Rowe1].
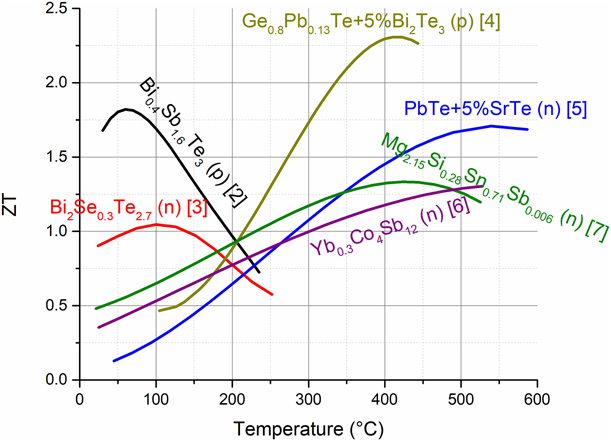
Currently, many materials are researched with higher and higher figure of merit (ZT) for varying applications [Reference Fan, Zhao, Guo, Yan, Ma and Hang2, Reference Yan, Poudel, Ma, Liu, Joshi, Wang, Lan, Wang, Chen and Ren3, Reference Gelbstein, Davidow, Girard, Chung and Kanatzidis4, Reference Biswas, He, Zhang, Wang, Uher, Dravid and Kanatzidis5, Reference Li, Tang, Zhang and Uher6, Reference Liu, Tan, Yin, Liu, Tang, Shi, Zhang and Uher7]. In Fig. 1, we can see some of the state-of-the-art materials that have been produced in the previous works in the past few years. It may be interesting to note that many of these materials include high vapor pressure elements, such as Mg, Sb, Te, S, and Se. As such, while many of these groups of materials could be further optimized, their main obstacle for commercialization is increase in their working temperature despite the high vapor species. Increasing the working temperature is expected to increase the efficiency due to both higher Carnot efficiency and reaching higher ZT values. In addition, better high temperature properties are expected to reduce degradation and thus allow for more useful electrical power from each device.
ZT of some of the state-of-the-art materials [Reference Fan, Zhao, Guo, Yan, Ma and Hang2, Reference Yan, Poudel, Ma, Liu, Joshi, Wang, Lan, Wang, Chen and Ren3, Reference Gelbstein, Davidow, Girard, Chung and Kanatzidis4, Reference Biswas, He, Zhang, Wang, Uher, Dravid and Kanatzidis5, Reference Li, Tang, Zhang and Uher6, Reference Liu, Tan, Yin, Liu, Tang, Shi, Zhang and Uher7].
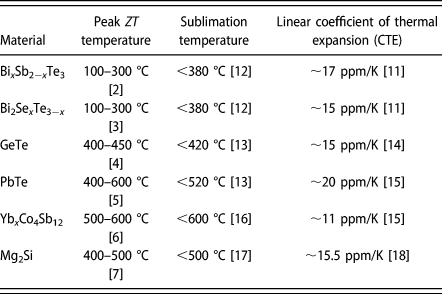
Many papers and reviews [Reference Yang and Caillat8, Reference Li and Kao9, Reference Aswal, Basu and Singh10, Reference Liu, Jie, Kim and Ren11] have expressed sublimation as one of the major obstacles for commercialization. In Table I, we can see the working and sublimation temperatures of some of the best thermoelectric materials in addition to their coefficient of thermal expansion values. It can be seen that the peak in the ZT is usually observed at a temperature close to that of the sublimation temperature. This means that by extending the operating temperature range, we could get an extra performance as the indication for performance is not the peak ZT but the area under the temperature-dependent ZT curve. It is also noteworthy that except for PbTe and GeTe, which were thoroughly tested [Reference Sadia, Ohaion-Raz, Ben-Yehuda, Korngold and Gelbstein13], the reported data for other materials are approximated from short-term measurement results and thus are probably much lower for long-term operation. It is important to note that while these data values do not represent every alloying and doping combination, they are a good reference for similar materials.
Peak ZT temperature range, estimated sublimation temperature, and thermal expansion for various high-performance thermoelectric materials.

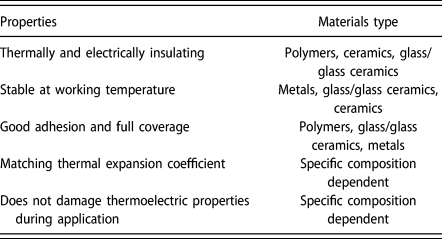
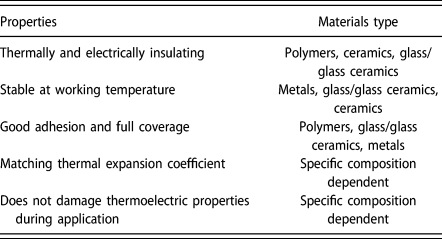
One way to attempt to overcome sublimation and consequently performance degradation is by producing a coating that will be a physical barrier to sublimation. In Table II, we can see some of the properties needed for such a coating. It is interesting to note that glasses seem to be the best candidates for such coatings due to their thermal and electrical insolation, high stability, and easy application. In addition, the melting temperature and thermal expansion, among other properties, of glasses can be tailored by using different doping ions.
Properties needed for a good coating for thermoelectric materials with corresponding materials.
While a few attempts have been made for coating of thermoelectric materials, most have showed a cracked ceramic coating [Reference Park, Kim and Yoo19], a polymeric coating, which is more relevant for low-temperature Bi2Te3 [Reference Nieroda, Mars, Nieroda, Leszczyński, Król, Drożdż, Jeleń, Sitarz and Koleżyński20, Reference Leszczyński, Nieroda, Nieroda, Zybała, Król, Łącz, Kaszyca, Mikuła, Schmidt, Sitarz and Koleżyński21, Reference Brostow, Datashvili, Hagg Lobland, Hilbig, Su, Vinado and White22, Reference Brostow, Chang, Hagg Lobland, Perez, Shipley, Wahrmund and White23, Reference Brostow, Chen and White24], or very expensive methods such as aerogel coating [Reference El-Genk, Saber, Caillat and Sakamoto25]. In this paper, attempts to generate a simple low-cost glass coating are described.
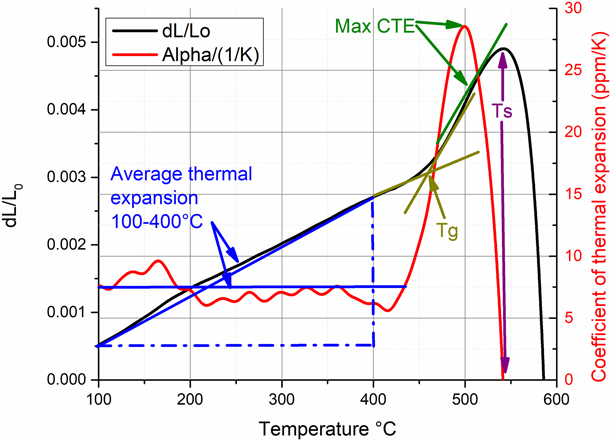
Two of the most important properties of the glass coating are coating temperature and thermal expansion. The coating temperature is highly correlated to the glass transition temperature, T g, and the softening point, T s, and should be located between those temperatures. A coating temperature much higher than required for the intended application will cause sublimation and degradation during the coating process. However, on using a too low coating temperature, the coating will melt during the practical operation during service. In this regard, a few temperature degrees over that of the peak ZT are desired. Regarding thermal expansion, as close as the thermal expansion will be to that of the coated thermoelectric material, the better the protection from thermal cracking. It is also interesting to note that above T g, the thermal expansion increases dramatically.
Glasses consist of three characteristic temperature regimes, where the first under T g is the rigid network. At these temperatures, glasses are highly rigid with little to no plastic deformation, in addition to a low isobaric linear coefficient of thermal expansion (CTE). Between T g and T s, the softening point of a glass, there is the plastic regime, which is characterized by some plastic flow under a large enough load, in addition to higher values for the CTE. At temperatures above T s, there is the flowing regime, where the glass flows under very minimal pressure. At these temperatures, coatings can take place as this will allow for the flow of the glass to cover the relevant thermoelectric material (i.e., soldering glasses).
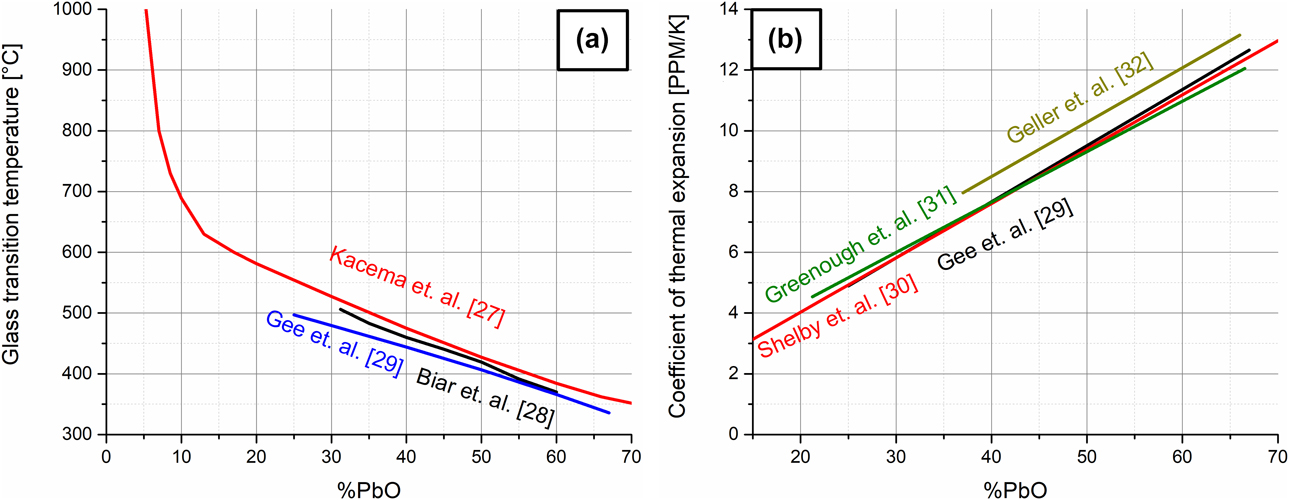
Lead silicate glasses are commonly used [Reference Kohara, Ohno, Takata, Usuki, Morita, Suzuya, Akola and Pusztai26] in many applications. In the PbO–SiO2 system, glasses are formed between 0 and 70% PbO. This allows for a wide range of glass transition temperatures, ranging from ∼670 °C at 10% to ∼350 °C at 70% PbO, as can be seen in Fig. 2(a) [Reference Kacem, Gautron, Coillot and Neuville27, Reference Bair28, Reference Gee, Holland and McConville29]. This also allows for variation in the thermal expansion values, ranging from ∼3 ppm at 10% to about 14 ppm at 70%, as can be seen in Fig. 2(b) [Reference Gee, Holland and McConville29, Reference Shelby30, Reference Greenough, Dentschuk and Palmer31, Reference Geller, Creamer and Bunting32]. This range is relevant for the thermal expansion values of some of the widely applied thermoelectric compositions shown in Table I.
(a) The glass transition temperature of PbO–SiO2 glasses [Reference Kacem, Gautron, Coillot and Neuville27, Reference Bair28, Reference Gee, Holland and McConville29]. (b) The thermal expansion of PbO–SiO2 glasses [Reference Gee, Holland and McConville29, Reference Shelby30, Reference Greenough, Dentschuk and Palmer31, Reference Geller, Creamer and Bunting32].

It is clear from Figs. 2(a) and 2(b) that we have conflicting needs. To get high T g, we need to sacrifice some of the expansion coefficient’s value. Due to the high potential of thermoelectric devices in automotive applications, where gasoline engine produces up to 500–550 °C as a maximal temperature [Reference Agote, Lagos, Tunbridge, Dixon, Reece, Ning, Gilchrist, Summers, Gelbstein, Simpson and Rouaud33], we can choose this temperature range as a starting point for our glass. This means that in terms of composition, a good starting point is (PbO)0.3(SiO2)0.7, showing a glass transition temperature of approximately 520 °C. However, this allows for only one specific glass transition temperature and coefficient of thermal expansion. To tailor these properties to each specific material, this composition can be doped with additional dopants. Two types of possible dopants are network formers, which change the shape of the glass network but keep it intact, and network modifiers, which do not promote network formation and as such break the glass network. The most common examples of each is boron as a network former and sodium as a network modifier [Reference Zachariasen34].
Sodium in glasses acts as a network modifier [Reference Zachariasen34] because it does not form chains but instead tends to break bonds. It is well known that sodium in even small amounts, as much as 5%, lowers the glass transition temperature of silica-based glasses to 400–500 °C [Reference Sakka and Mackenzie35]. This comes with an increase in the coefficient of thermal expansion even further than the effect of lead glasses [Reference Shelby36]. Therefore, a very small amount of sodium is required for a fine control of the exact temperature. Boron, on the other hand, is a network former, meaning it does not break bonds but changes the nature of them. This is the reason that SiO2 and B2O3 create glasses over their entire composition span. B2O3 thus has a smaller effect on silicate glasses. The effect of this on the glass transition temperature is much more gradual than sodium, with T g values going to about 800 °C at 5% B2O3 and keep lowering consistently to about 500 °C at about 23% B2O3 and 300–200 °C at above 70% B2O3 [Reference Jabra, Phalippou and Zarzycki37]. The coefficient of thermal expansion of borosilicate glasses changes from about 0.5 ppm/K for pure silica to about 1 ppm/K for 5% B2O3 and up to a maximum of 15 ppm/K at 100% B2O3 [Reference Jabra, Phalippou and Zarzycki37].
It is hard to estimate the effect of such small additions on the properties of a combined PbO–SiO2 glass. The few studies using a ternary B–Pb–Si or Na–Pb–Si glasses included high amounts of boron and sodium of about 20–30% [Reference Gee, Holland and McConville29, Reference Mocioiu, Zaharescu, Atkinson, Mocioiu and Budrugeac38, Reference Kobayashi39, Reference Khanna, Saini, Chen, González and Ortiz40, Reference Sudarsan, Shrikhande, Kothiyal and Kulshreshtha41]. It was also reported [Reference Sudarsan, Shrikhande, Kothiyal and Kulshreshtha41] that boron increases the glass transition temperature of PbO0.5(SiO2)0.5 glass by the largest extent when it replaces lead over silicon. However, the minimum intervals in this study were 5% boron content and the glass has much lower Tg values than intended in this study. It was further shown that boron also seems to lower the coefficient of thermal expansion if it replaces lead but not if it replaces silicon. With sodium small additions of up to 5% replacing lead, (Na2O)0.05PbO0.25(SiO2)0.7, a decrease in the glass transition temperature from 490 to 431 °C [Reference Gee, Holland and McConville29] was observed, as expected. At the same time, the thermal expansion value went up from 5.42 ppm/K to 6.51 ppm/K [Reference Gee, Holland and McConville29], agreeing with the above points on general predictions based on sodium’s effect on silica.
In the light of all these, the current research is focused on investigation of the (PbO)0.3(SiO2)0.7−x−y(B2O3)x(Na2O)y system with x and y going from 0.5 to 5%.
Results and discussion
X-ray diffraction
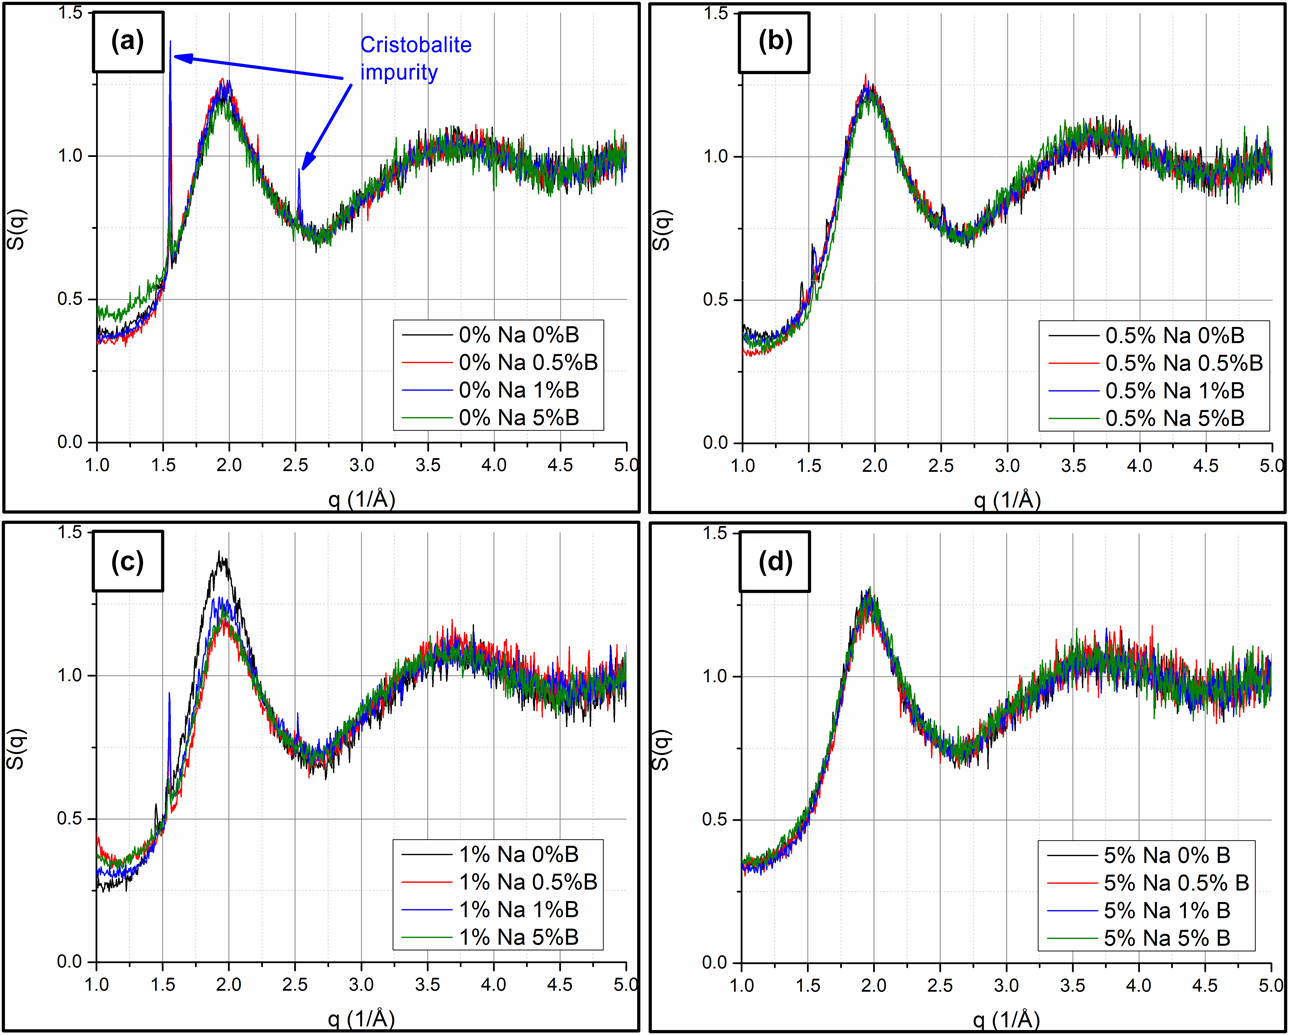
X-ray diffraction (XRD) analyses for obtaining the static structure factor, S(q), and its dependence on reciprocal distance, q, in addition to the pair distribution function G(r), and its dependence on the interatomic distance (r), are shown in Figs. 3–5.
S(q) for the 16 samples organized by sodium content. All samples exhibit a similar amorphous structure with a very small amount of cristobalite impurity. This impurity is more apparent in the samples with less sodium and boron and in the undoped sample. The graphs represent changing of the sodium content as follows: (a) 0% sodium 0–5% B, (b) 0.5% sodium 0–5% B, (c) 1% sodium 0–5% B, and (d) 5% sodium 0–5% B.
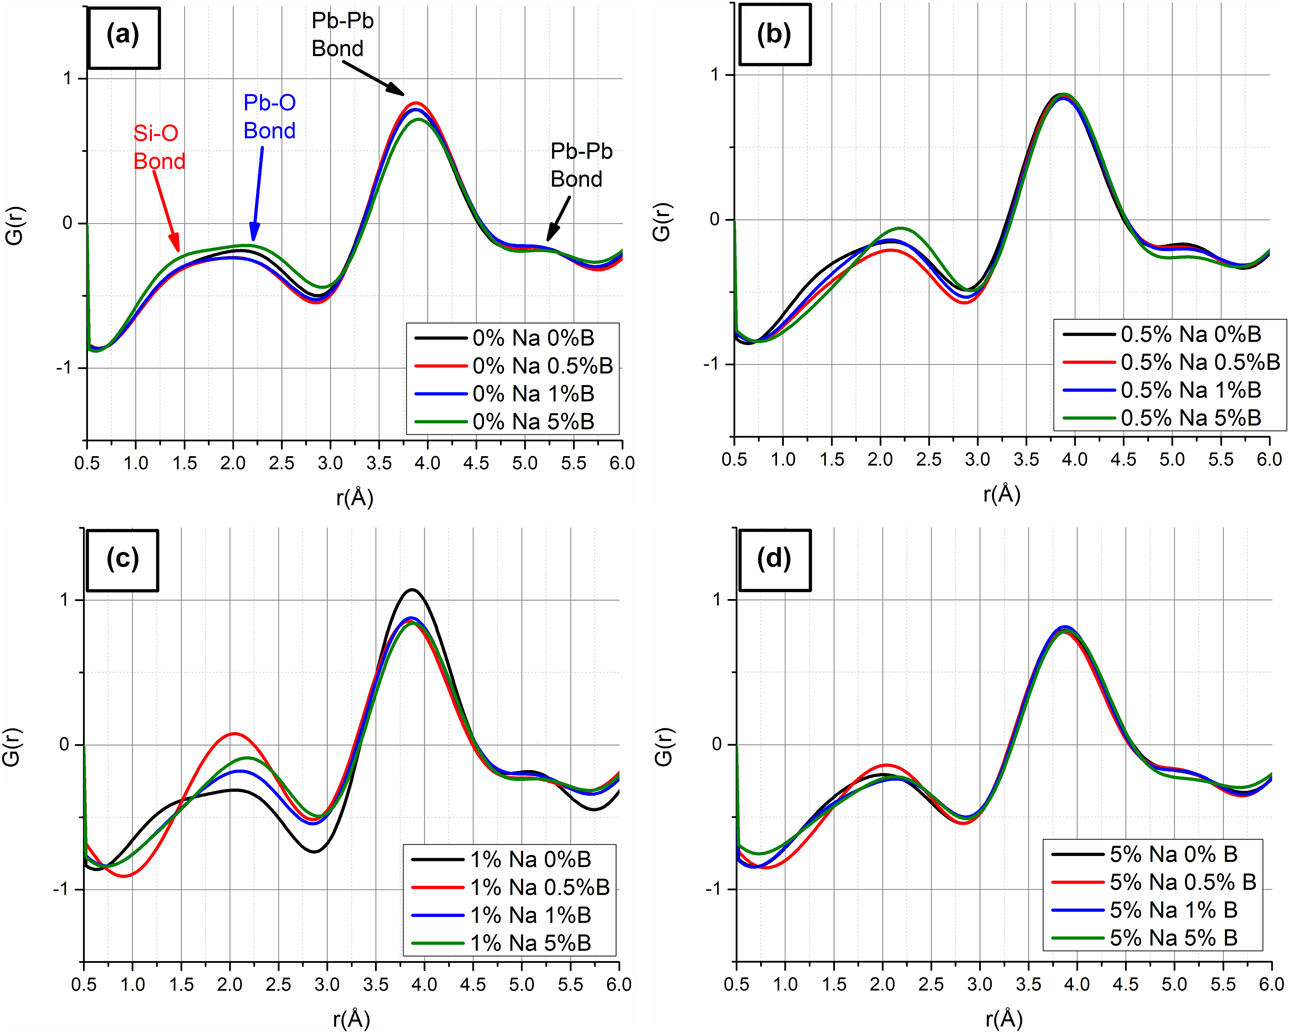
G(r) for the 16 samples organized by sodium content. All samples show the Si–O peak, the Pb–O peak, and two Pb–Pb peaks. All marked in (a). The graphs represent changing of the sodium content as follows: (a) 0% sodium 0–5% B, (b) 0.5% sodium 0–5% B, (c) 1% sodium 0–5% B, and (d) 5% sodium 0–5% B.

The glass nature of the 1% Na2O 1% B2O3 sample even after 100 h at 500 °C.

The S(q) and G(r) values of the various synthesized glasses are presented in Figs. 3(a)–3(d) and 4(a)–4(d), respectively. While all peaks can be noticed, it is hard to distinguish the Si–O bond estimated at an atomic distance, r, of 1.60 Å [Reference Tse, Wang, Jiang, Chen and Jiang42, Reference Bair43], where attempts to distinguish it resulted in ∼1.32 Å for the low doped samples and ∼1.49 Å for the highly doped samples, with the sample with 5% B2O3 and 5% Na2O showing the highest 1.56 Å bond length. This might have less to do with the structure and more with the fact that the Si–O peak is less pronounced in the highly doped samples either due to being replaced by B–O bonds or by being broken by the presence of Na+ ions. It can be seen in Figs. 4(a)–4(d) that the more heavily doped samples show very little of the Si–O peak; this allows for easier differentiation as opposed to the high overlap in the low doped samples with very similar Si–O and Pb–O peaks. It is noteworthy that as expected the sodium content controls this effect to a much higher degree than the boron content. It is also noteworthy that the 0.5% doped samples exhibit a very similar behavior to the undoped samples as opposed to the 1 and 5% doped samples.
The Pb–O indicator, while hard to completely separate from the Si–O peak, is much more evident in all the investigated compositions. The bond length tends to increase with the amount of B–O bonds and decrease with the amount of sodium. With the literature indicating about a 2.36 Å bond length [Reference Tse, Wang, Jiang, Chen and Jiang42], our results show a bond length of 2.28 Å for the unbonded sample. The highly boron doped sample showed a bond length reaching 2.34 Å and the highly sodium doped samples reaches 2.16 Å. The samples doped in the same amount of both seem to balance at around 2.23 Å bond length.
The Pb–Pb peaks were largely unaffected by the sodium contact, which may be due to an unchanged nature of the network. On increasing the boron content from 1% to 5%, an increase of the bond lengths from 3.83 Å to 3.87 Å and from 5.22 Å to 5.26 Å, respectively, was observed. The literature value of the first peak is about 3.75 Å [Reference Tse, Wang, Jiang, Chen and Jiang42]. It is noteworthy that although Si, B, and Na are not ideal for XRD scattering, in contrast to Pb, either synchrotron or neutron diffraction is more optimal for accurate determination of these bond length values. However, for the purpose of the current research, identifying the general trends is sufficient.
Stability was tested for the 1% B2O3, 1% Na2O sample. After 100 h of air exposure, at the assumed operation temperature of 500 °C, no changes in the XRD could be seen with a completely glassy phase remaining, as shown in Fig. 5. This is a good indication that even above T g, the formation of stable crystalline phases is too slow to occur during long operation.
Measurements of the glass properties
In Fig. 6, the dilatometry measurement results for the composition containing 1% of both boron and sodium are shown. Since the thermal expansion is temperature dependent in glasses [Reference Karkhanavala and Hummel44], as in many other materials, an average was taken for the 100–400 °C temperature range, indicating the engineering thermal expansion expected in a thermoelectric device. The thermal expansion coefficient values between 100 and 400 °C are shown in Fig. 8(a) along with a predicted value (in parenthesis) for 210 °C for the samples containing no boron, using a model by Fluegel [Reference Fluegel45, Reference Fluegel46]. This model is a statistical regression model based on polynomial linear regression as explained by Fluegel [Reference Fluegel45] and using the data shown by Fluegel for the coefficient of thermal expansion [Reference Fluegel46]. The thermal expansion above the softening point, however, is not consistent enough to give a consistent number due to the quick change from glass transition to softening. For this reason, the maximal thermal expansion was taken as an indication for cracking around that temperature. Two additional factors taken are the glass transition temperature and the softening points, with the glass transition being the onset of the thermal expansion’s rapid change and the softening point being the point where the thermal expansion goes to zero due to the low resistance to compression above that temperature.
Temperature-dependent dilatometry expansion, dL/L o (dL is length variation and L o is original length), and isobaric linear coefficient of thermal expansion, α, measurements for the 1% Na 1% B composition.

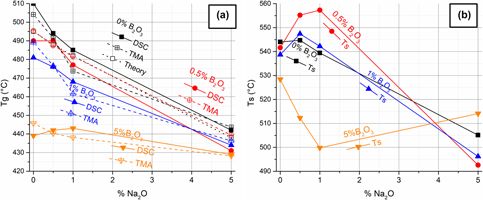
The dilatometry measured T g is shown in Fig. 7(a), with crosses along with the obtained values based on the transition onset obtained by differential scanning calorimetry (DSC), which is a very common way to denote T g [Reference Angell, Jürgen Buschow, Cahn, Flemings, Ilschner, Kramer, Mahajan and Veyssière47] (full symbols), and a theoretical calculation based on Fluegel [Reference Fluegel45, Reference Fluegel46] (empty squares). This uses a statistical regression model as explained by Fluegel [Reference Fluegel45] and uses the data shown by Fluegel [Reference Fluegel48] for glass viscosity, taking a viscosity of 1012 Pa s as the T g. It is noticeable that similar T g values were obtained by dilatometry and DSC for all the investigated compositions at about 10 °C difference, with the theoretical calculations closer to the dilatometry results. It is known that the theoretical model breaks down for a many component and highly doped system, which is why the 5% Na2O doped sample is further apart from the measured results. B2O3 could not be calculated based on the same model due to the model’s limitations.
(a) T g of PbO0.3(SiO2)0.7 glass with 0–5% Na2O and 0–5% B2O3 from theory, DSC, and dilatometry. (b) T s of the investigated compositions based on dilatometry measurements.
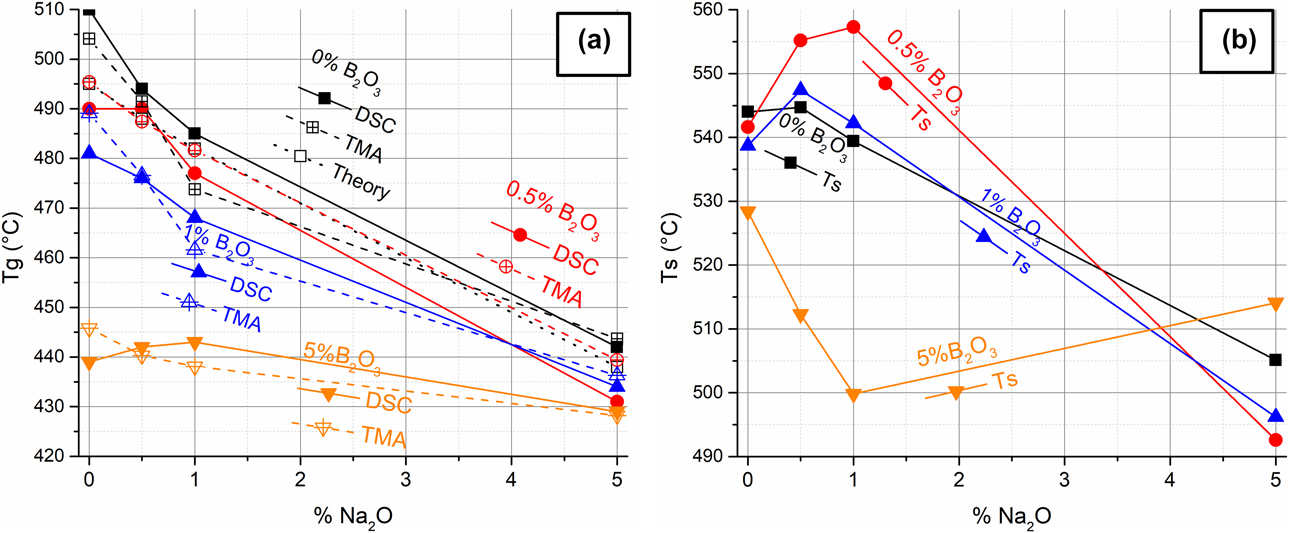
While T g is the thermodynamic property that predicts the behavior of the materials, it is the softening point that is more interesting from coating engineering point of view. The softening temperature is the temperature being used for coating and must be above the operating temperature. In Fig. 7(b), the softening point (T s) is shown. While the difference between the T s and T g is between 35 and 100 °C, it is not fully consistent, which adds another level of complexity. It can be seen from Fig. 7(b) that the range of T s obtained for the investigated compositions is between 492 and 545 °C, as required for midrange thermoelectric applications operating near 500 °C, allowing their application at temperatures lower than the temperatures causing degradation for most of these materials. It is also interesting to note that the fact that T s is not completely consistent with T g allows the possibility to apply different coating compositions for different operation temperatures of the thermoelectric materials.
Coefficient of thermal expansion
From the dilatometry measurements, shown in Fig. 6, four different parameters were deduced: the average coefficient of thermal expansion at 100–400 °C; the glass transition temperature, T g; the softening point, T s; and the maximal coefficient of thermal expansion, Max CTE, at temperatures higher than T g. All these are marked in the figure.
Figure 8(a) summarizes the obtained coefficient of thermal expansion values at temperatures lower and higher than T g. From Fig. 8(a), an increase in the coefficient of thermal expansion with increasing either the boron or the sodium content can be clearly seen. However, this increase is much more pronounced for sodium. It is also interesting to note that the addition of both boron and sodium is surprisingly less effective than adding just one. Nevertheless, the coefficients of thermal expansion for the various investigated compositions are all in the 5.95–8.85 ppm/K range.
(a) Isobaric linear expansion between 100 and 400 °C of PbO0.3(SiO2)0.7 glass with different amounts of doping of Na and B oxides from dilatometry. (b) The maximal thermal expansion after T g.
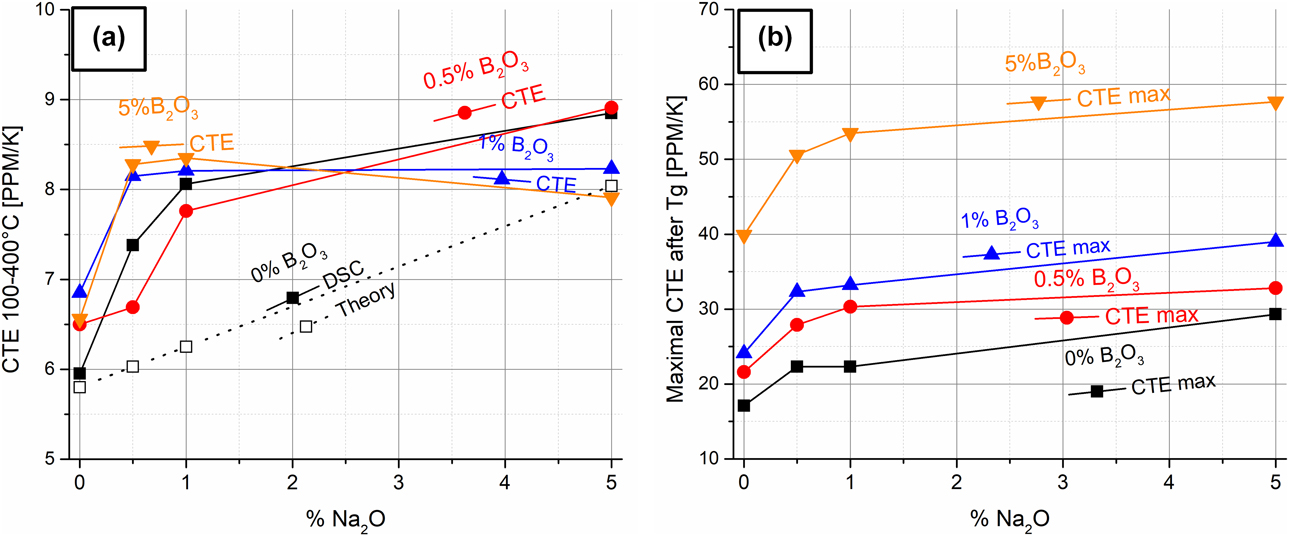
A different trend can be seen in Fig. 7(b), summarizing the maximal coefficient of thermal expansion values, as were obtained between the T g and the softening point. It can be clearly seen that these values above T g are much higher than the ones for glasses under the T g, going from 17.1 to 57.7 ppm/K. These values increase dramatically with the addition of either boron or sodium or the addition of both. The sodium-rich compositions exhibit values in the range of 29.3–57.7 ppm/K, while the boron-rich compositions exhibit values in the range of 39.9–57.7 ppm/K. Nevertheless, the compositions with 0.5–1% of each are within the 21.6–33.2 ppm/K range, which is comparable to those of thermoelectric materials such as PbTe and Mg2Si.
Discussion
In the investigated glass coating system, sodium is known as a network modifier, while boron is known as a network former. Therefore, it is expected that sodium would make all the investigated properties less glassy (lower T g, lower T s, higher coefficient of thermal expansion), while boron will have a more complex effect depending on the exact nature of the ions in the glass [Reference Sudarsan, Shrikhande, Kothiyal and Kulshreshtha41]. However, these trends are not entirely simple. It is expected that sodium will lower the T g much more significantly than boron due to the breaking of the bonds holding the network together. However, very similar effects were observed in the current study with about 1.5 times enhancement of the effect when sodium had been used instead of boron. Upon 0.5% doping of each, T g was lowered by 12.6 °C for the case of sodium and only 8 °C for case of boron. Upon 0.5% doping of both, an additive effect was observed, lowering of T g by 20 °C. Upon 1% doping, a similar effect was observed, lowering of T g in this case by 25 °C for sodium addition and 15 °C for boron addition. A similar additive effect was observed upon 1% doping of both, allowing for a 40 °C decrease in T g. However, 5% doping of each resulted in a much more pronounced decrease in T g by about 76 °C (from 504 °C of the undoped sample to 428 °C) for both with a very little combined effect. This heavy doping effect upon 5% doping can be attributed to the creation of secondary phases, which act outside of the model systems, as was previously reported by Mazurin [Reference Mazurin49].
The relationship between T g and T s is also more complex, showing a 40 °C difference for the undoped composition and up to 85 °C difference for the heavily doped condition. It was also found that all the lightly doped samples, up to 1% of each dopant, exhibit T s values of about 540–560 °C, with increased values upon double doping as opposed to the doping effect on T g. The heavily (5% and up) doped samples resulted in T s values of about 490–510 °C, still not in any direct relationship with their T g values.
With respect to the thermal expansion of the samples under and above T g, it is clear that the doping effects are very different, with the coefficient of thermal expansion.
Values under the T g quickly increasing from about 6 ppm/K to about 8 ppm/K, following a 1% addition of sodium to about 9 ppm/K for the 5% doped compositions. Boron has a lesser effect on the thermal expansion, increasing it to only 6.5 ppm/K depending on the exact composition. However, above T g, both dopants highly increase the thermal expansion from about 17 to 30 ppm/K for the 5% sodium doped samples and about 40 ppm/K for the boron doped samples. This is particularly relevant to the double doped samples going all the way up to 60 ppm/K for the highly doped (5% of each) and about 30 ppm/K for the lightly doped (0.5–1% of both dopants) conditions.
This range of properties shows that this system could be interesting for being applied with thermoelectric materials. It is interesting to note that glass coatings should be under compression and therefore should always have a lower thermal expansion than the material if accurate matching is not possible. For the skutterudites class of thermoelectric materials, an undoped or a very lightly doped glass should be used, with a thermal expansion slightly lower than that of the skutterudites (∼6 instead of ∼10 ppm/K). This would allow for an application temperature of about 550 °C or even 570 °C using the glass coating composition containing 0.5% B and 1% Na. This would provide a low enough application temperature but high enough stability up to about 520 °C, which is halfway between T g and T s. While the coefficient of thermal expansion above T g (∼480 °C) is slightly high (20 ppm/K), it is in the plastic region, where glass can deform slightly to match the stress. A similar reasoning would show that the sample containing 1% of both boron and sodium is relevant for PbTe, GeTe, and Mg2Si, with the application temperature being about 540–550 °C with stability of up to about 500–510 °C and a coefficient of thermal expansion above T g (∼465 °C) of about 30 ppm/K.
Conclusions
Lead silicate glasses containing 0–5% B2O3 and Na2O were produced by melting and quenching showing a fully glassy phase. The different compositions allowed for a wide variety of glass transition temperatures from 420 to 510 °C. A wide variety of softening points from about 490 to 560 °C were obtained, depending on the exact doping level. The coefficients of thermal expansion of the investigated glasses were found to be in the 6–9 ppm/K range. These glass compositions should allow to coat intermediate temperature range thermoelectric materials, such as PbTe, GeTe, Mg2Si, and CoSb3, upon using 1% B and 1% Na doping for most of these thermoelectric compounds and 0.5% B and 1% Na for the skutterudite.
Methodology
Pure (4N) SiO2 was milled to under 63 µm and calcinated in vacuum at 300 °C. The powder was then mixed with appropriate amounts of PbO (4N), B2O3 (4N) Na2CO3 (4N) in an agate mortar and pestle. Samples of (PbO)0.3(SiO2)0.7−x−y(B2O3)x(Na2O)y were prepared with varied x and y values of up to 5%. The samples were placed in an oven at 1300 °C in aluminosilicate crucibles for an hour and then directly poured out and quenched in water. During the preparation, CO2 was leaving the sample, turning Na2CO3 to Na2O. The quenched glasses were dried and powdered and then taken for analyses in different instruments as specified below.
Powder XRD data were collected using a Panalytical Empyrean powder diffractometer (Malvern Panalytical Ltd., Malvern, United Kingdom) equipped with a position-sensitive X’Celerator detector using Cu Kα radiation (λ = 1.5405 Å) operated at 40 kV and 30 mA.
XRD analysis with a conversion to a powder diffraction file was done using GSAS-II software package (Argonne National Labs, DuPage, Illinois) [Reference Toby and Von Dreele50].
DSC was tested using the Metteler-Toledo DSC-823-C (Mettler Toledo, Columbus, Ohio) using an aluminum crucible and heating at 20 °C/min from 100 to 600 °C. This was done twice for each sample to check repeatability, where for the cases the slight differences were noticed, the second run was taken, as there is a lower thermal resistance after the first melting.
For dilatometry measurements, sintered powder in argon in a stainless steel die for obtaining 6 mm in diameter and 10 mm long samples was used. The measurement was taken using the Netzsch TMA 402 Hyperion (Netzsch, Waldkraiburg, Germany) using a silica holder and a silica calibration sample. The measurements were done under 20 mL/min argon flow at 3 °C/min.
Funding
The work was supported by the Israel Science Foundation (ISF) Individual Research Grant No. 455/16.
Acknowledgments
One of authors, Y.G., holds the Samuel Ayrton Chair in Metallurgy. The authors would like to thank Dima Mogilyansky for the XRD analysis, Yacov Weinberg for the sample preparation for dilatometry, and Yair George for the glass melting and quenching.