

1. Introduction
Zircon is a very robust mineral both physically and chemically, whose U–Pb and Lu–Hf systems can survive processes beyond high-grade metamorphism and crustal anatexis (Williams, Reference Williams2001; Hawkesworth & Kemp, Reference Hawkesworth and Kemp2006). Because of its robustness it has become a popular indicator mineral in sedimentary provenance analysis, based on the assumption that the age and Hf isotopic composition can be related to distinct source rocks (e.g. Veevers et al. Reference Veevers, Saeed, Belousova and Griffin2005, Reference Veevers, Belousova, Saeed, Sircombe, Cooper and Read2006; Augustsson et al. Reference Augustsson, Münker, Bahlburg and Fanning2006; Yang et al. Reference Yang, Wu, Shao, Wilde, Xie and Liu2006; Veevers & Saeed, Reference Veevers and Saeed2007). Ideally, such data could be used to map the routing of detritus deposited in a sedimentary basin ‘from source to sink’. Detrital zircon can additionally yield approximate ages of deposition, and shifts in U–Pb ages and Hf signatures through a stratigraphical section can potentially be used to highlight shifts in provenance. However, the refractory nature of zircon also causes an important problem for the interpretation of detrital zircon data: what can be identified by isotopic data is not necessarily the immediate source of detritus, but the rock in which the zircon originally crystallized, that is, the protosource. Residence in any intermediate repository will normally not leave an imprint on the isotopic systems of detrital zircon, although diagenetic effects (Willner et al. Reference Willner, Sindern, Metzger, Ermolaeva, Kramm, Puchkov and Kronz2003) and contact metamorphism (Andersen, Reference Andersen2013) have been indicated to cause lead loss in detrital zircon. The importance of recycling of older sedimentary rocks has been highlighted in several studies (e.g. Thomas et al. Reference Thomas, Becker, Samson and Hamilton2004; Dickinson, Lawton & Gehrels, Reference Dickinson, Lawton and Gehrels2009).
Sedimentary rocks of Cambrian–Permian age are preserved within the down-faulted blocks (half-grabens) of the Oslo Rift (Fig. 1) in southern Norway. Previous provenance studies on sandstones from the Oslo Rift have indicated protosources that include most of Fennoscandia but also that specific temporally immediate, local and distal sources have contributed, some of which do not have identifiable counterparts within the Fennoscandian Shield or the Caledonian mountain chain (Dahlgren & Corfu, Reference Dahlgren and Corfu2001; Andersen et al. Reference Andersen, Saeed, Gabrielsen and Olaussen2011). This paper presents the results of a combined U–Pb and Lu–Hf isotope study of detrital zircon from Palaeozoic sandstone units in the Oslo Region. Problems that will be addressed include the importance of Fennoscandian protosources, recycling of sediments from older deposits within and outside the rift, identifiable temporally immediate but geographically distal sources and possible post-depositional effects on the U–Pb system of the analysed zircon grains by Permian magmatism in the Oslo Rift.
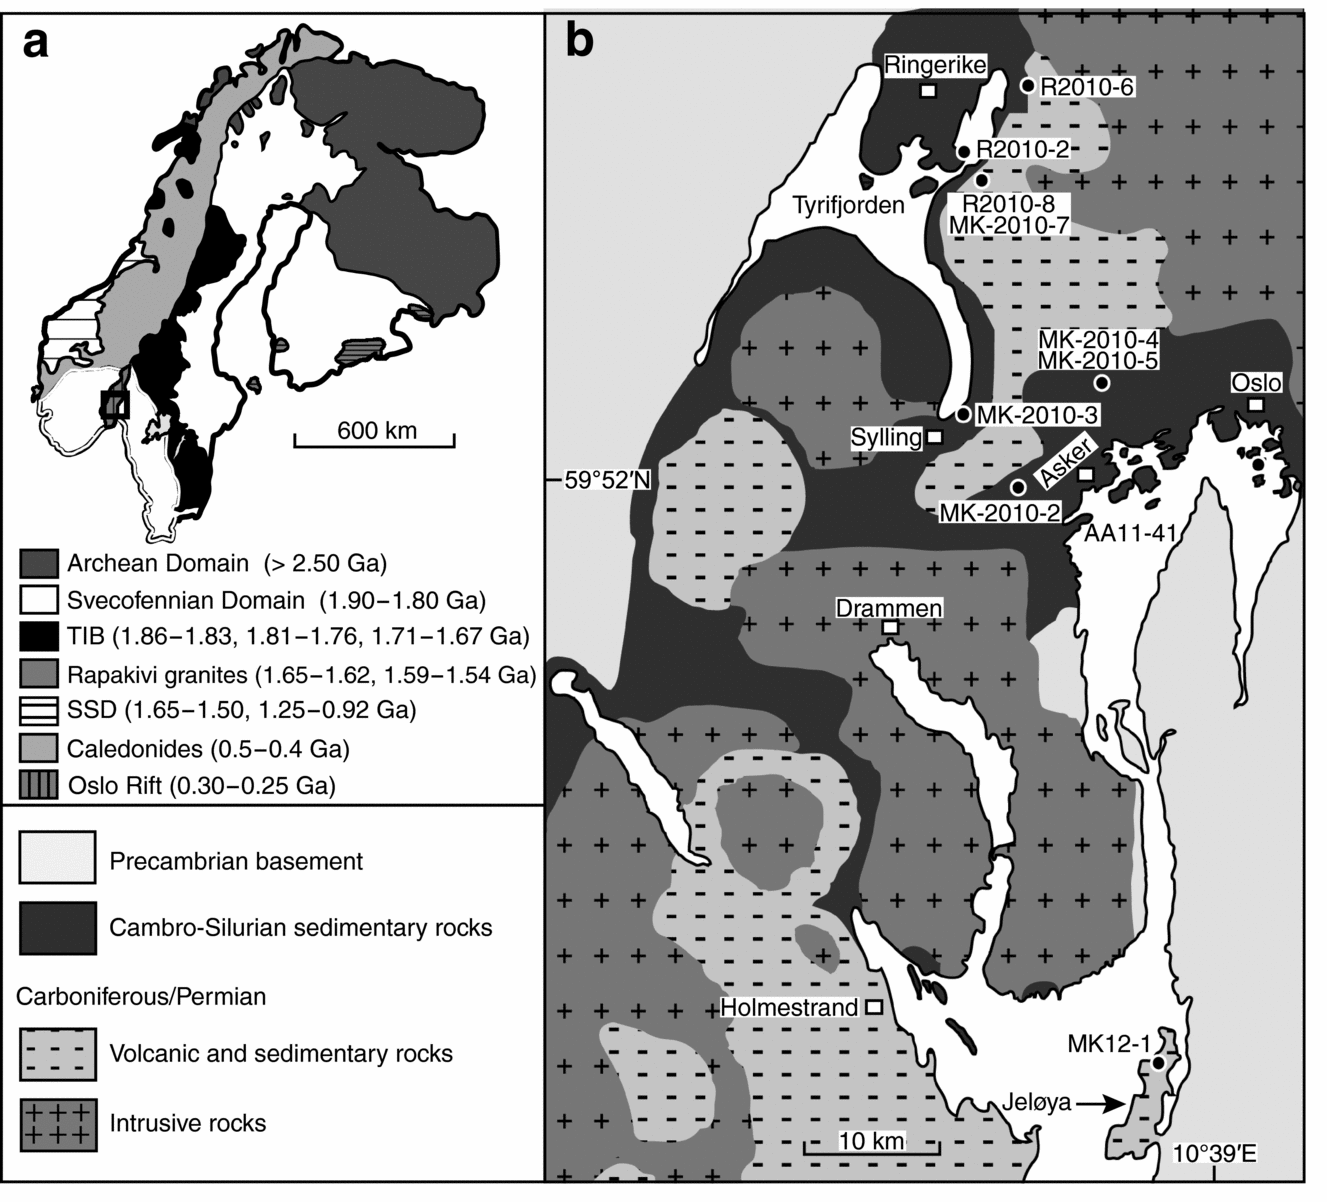
(a) Geological map of the main crustal domains in Fennoscandia (modified after Gaál & Gorbatchev, Reference Gaál and Gorbatchev1987; Högdahl, Andersson & Eklund, Reference Högdahl, Andersson and Eklund2004). The black box shows the approximate position of (b). TIB – Transscandinavian Igneous Belt; SSD – SW Scandinavian Domain. (b) Simplified geological map of the central Oslo Graben (modified after Larsen et al. Reference Larsen, Olaussen, Sundvoll and Heeremans2008) with sample locations indicated.
2. Geological setting
Geologically the Oslo Region comprises the onshore half-graben segments of the Oslo Rift (e.g. Larsen et al. Reference Larsen, Olaussen, Sundvoll and Heeremans2008). It covers an area of c. 10000 km2, is c. 40–70 km wide and extends 115 km north and south of the city of Oslo (Bruton, Gabrielsen & Larsen, Reference Bruton, Gabrielsen and Larsen2010). In this half-graben segment a pre-rift Lower Palaeozoic (Cambrian–Silurian) succession is preserved, together with rift-related Palaeozoic (Late Carboniferous – Permian) sedimentary and magmatic rocks.
The increased influx of siliciclastic material to the Oslo Region recorded in the Darriwilian (Middle Ordovician) Elnes Formation (Fig. 2; e.g. Hansen, Reference Hansen, Rábano, Gozalo and García-Bellido2008; Candela & Hansen, Reference Candela and Hansen2010) and in the latest Ordovician period (Brenchley, Newall & Stanistreet, Reference Brenchley, Newall and Stanistreet1979; Brenchley & Newall, Reference Brenchley and Newall1980) has been interpreted to reflect sedimentary response to the growing Caledonian mountain chain to the NW of the Oslo Region (Bjørlykke, Reference Bjørlykke1974; Bruton, Gabrielsen & Larsen, Reference Bruton, Gabrielsen and Larsen2010). A land area to the NW, which sheltered the foreland basin from the Iapetus Ocean (Hansen, Reference Hansen, Rábano, Gozalo and García-Bellido2008, Reference Hansen2009), is thought to have been an important source of siliciclastic material to the Oslo Region during the Late Ordovician period (Størmer, Reference Størmer1967; Brenchley, Newall & Stanistreet, Reference Brenchley, Newall and Stanistreet1979; Bruton, Gabrielsen & Larsen, Reference Bruton, Gabrielsen and Larsen2010). This view was however opposed by Braithwaite, Owen & Heath (Reference Braithwaite, Owen and Heath1995; see also Størmer, Reference Størmer1967) who instead favoured a model in which the sediments of the Oslo Region were dominantly shed from sources located in the adjacent Precambrian basement to the east, as well as sources to the north and NE.
Simplified lithostratigraphic column of the Oslo Graben at Ringerike (modified after Henningsmoen, Reference Henningsmoen, Dons and Larsen1978; B. T. Larsen & S. Olaussen, unpub. field guide, The Oslo Region: a Study in Classical Palaeozoic Geology, Norsk Geologisk Forening, 2005), with approximate sample positions indicated. Inset shows the idealized stratigraphy of the Ringerike Group and the Steinsfjorden Formation from Ringerike (Fig. 1) in the northern part of the central Oslo Graben to Skien in the southern Oslo Graben (after Davies, Turner & Sansom, Reference Davies, Turner and Sansom2005a ). Cam – Cambrian; L – Lower; M – Middle; U – Upper; C – Carboniferous; P – Pennsylvanian; (m) – metres above the Precambrian basement.
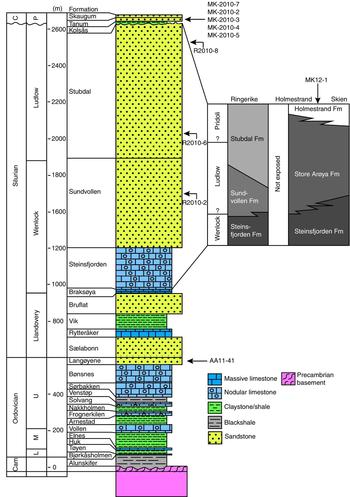
The Hirnantian (latest Ordovician; Owen, Reference Owen1981, Reference Owen1982; Cocks, Reference Cocks1982) Langøyene Formation (Fig. 2) consists mainly of laminated sandstones, but also include interbedded shales and thin limestone beds (Brenchley & Newall, Reference Brenchley and Newall1975; Owen et al. Reference Owen, Bruton, Bockelie and Bockelie1990), deposited during a major regressive phase of glacio-eustatic origin (Brenchley & Newall, Reference Brenchley and Newall1980).
During the Early Silurian period marine conditions prevailed with the deposition of the carbonates of the Steinsfjorden Formation (Fig. 2). A transition to non-marine and red-bed facies (Sundvollen Formation) occurred at or just below the Wenlock–Ludlow boundary (Bruton, Gabrielsen & Larsen, Reference Bruton, Gabrielsen and Larsen2010). The Old Red Sandstone sediments of the Late Silurian – earliest(?) Devonian Ringerike Group (Fig. 2) are found discontinuously throughout the Oslo Region, and were deposited in the foreland basin to the rising Caledonian mountain range in the NW (Worsley et al. Reference Worsley, Aarhus, Bassett, Howe, Mørk and Olaussen1983; Davies, Turner & Sansom, Reference Davies, Turner and Sansom2005b ). Davies, Turner & Sansom (Reference Davies, Turner and Sansom2005a ) revised the lithostratigraphy of Turner (Reference Turner1974), adding the Store Arøya Formation to the existing Sundvollen, Stubdal and Holmestrand formations (Fig. 2).
The Sundvollen Formation (the oldest formation of the Ringerike Group) is conformably overlain by the Stubdal Formation (Fig. 2), both of which are restricted to the northern part of the Oslo Region (Davies, Turner & Sansom, Reference Davies, Turner and Sansom2005a ). The base of the Store Arøya Formation is defined as the first terrigenous sediments that can be seen above the Steinsfjorden Formation south of Sylling (Fig. 1b; Davies, Turner & Sansom, Reference Davies, Turner and Sansom2005 a), whereas the Holmestrand Formation (Fig. 2) refers to the uppermost 100 m of the Ringerike Group. Where its base is exposed it sits conformably on top of the Store Arøya Formation (Fig. 2; Davies, Turner & Sansom, Reference Davies, Turner and Sansom2005a ). While the age of the Ringerike Group is somewhat disputed, a late Wenlock – early Ludlow age for the Sundvollen Formation and a Ludlow–Pridoli age for the Holmestrand Formation have been suggested (Davies, Turner & Sansom, Reference Davies, Turner and Sansom2005a ). The Sundvollen and Stubdal formations are interpreted to have been sourced from the Jotun Nappes of the Norwegian Caledonides to the NW (Bjørlykke, Reference Bjørlykke1974; Turner & Whitaker, Reference Turner and Whitaker1976; Davies, Turner & Sansom, Reference Davies, Turner and Sansom2005b ). The Jotun Nappes are also considered to have been an important source area for the sediments of the Store Arøya and Holmestrand formations, but Davies, Turner & Sansom (Reference Davies, Turner and Sansom2005 b) have argued that the late Neoproterozoic nappes of the Lower Allochton and the autochthonous basement have been important source rocks for these formations.
The Asker Group, deposited during the proto-rift and initial-rift stages of the development of the Oslo Rift, consists of the Kolsås, Tanum and Skaugum formations (Fig. 2; Larsen et al. Reference Larsen, Olaussen, Sundvoll and Heeremans2008). The proto–rift Tanum Formation consists, in the Asker area (Fig. 1b), of grey, carbonate–cemented sandstones of fluvio–marine origin (Olaussen, Larsen & Steel, Reference Olaussen, Larsen, Steel, Embry, Beauchamp and Glass1994; Larsen et al. Reference Larsen, Olaussen, Sundvoll and Heeremans2008). Fossils found in the formation indicate a late Bashkirian – late Moscovian (Late Carboniferous) age for its deposition (Olaussen, Reference Olaussen1981; Olaussen, Larsen & Steel, Reference Olaussen, Larsen, Steel, Embry, Beauchamp and Glass1994; Larsen et al. Reference Larsen, Olaussen, Sundvoll and Heeremans2008). Detrital zircon of Neoproterozoic, Cambro-Ordovician and Early Carboniferous ages led Dahlgren & Corfu (Reference Dahlgren and Corfu2001) to suggest a southerly source (Variscan Orogen) for the Asker Group.
3. Analytical methods
Ten sandstone samples were crushed and their heavy mineral fractions were extracted by Wilfley table washing and heavy liquid (sodium polytungstate) separation. No magnetic separation was performed to avoid introducing an artificial bias (Sircombe & Stern, Reference Sircombe and Stern2002; Andersen et al. Reference Andersen, Saeed, Gabrielsen and Olaussen2011). Zircon grains were hand-picked, cast in epoxy resin, polished and imaged by cathodoluminescence (CL) using a JEOL JSM 6460LV scanning electron microscope at the Department of Geosciences, University of Oslo. U–Pb and Lu–Hf analyses were performed by laser ablation inductively coupled plasma mass spectrometry (LA-ICP-MS) using a Nu Plasma HR multi-collector mass spectrometer equipped with a NewWave LUV 213 neodymium-doped yttrium aluminium garnet (Nd:YAG) laser microprobe at the Department of Geosciences, University of Oslo. All plots were calculated using the R programming language and statistical computing environment (R Development Core Team, unpub. report, 2012: http://www.r-project.org) and ggplot2 (Wickham, Reference Wickham2009). Ages given are 206Pb–238U ages if younger than or equal to 600 Ma; otherwise the 207Pb–206Pb ages have been used. Only grains with less than ±10% central discordance have been included. Kernel density estimates (KDEs) were calculated using the algorithm of Botev, Grotowski & Kroese (Reference Botev, Grotowski and Kroese2010); Gaussian KDEs with bandwidth = 25 were also produced.
3.a. U–Pb isotope analysis
For U–Pb the analytical protocols of Andersen et al. (Reference Andersen, Andersson, Graham, Åberg and Simonsen2009) and Rosa et al. (Reference Rosa, Finch, Andersen and Inverno2009) were followed. Ablation conditions were that of beam diameter 40 μm (aperture imaging mode), pulse frequency 10 Hz and beam fluence c. 0.06 J cm−2 using static ablation. Data reduction was performed using an interactive, in-house Microsoft Excel 2003 spreadsheet program. For an analysis with 207Pb/235U = x, 206Pb/238U = y and 207Pb–206Pb age = t, the central discordance (%) was calculated using the equation
 \begin{equation*}
{\rm disc} = 100\left( {\sqrt {\frac{{x^2 + y^2 }}{{\left( {e^{t\lambda _{235} } - 1} \right)^2 + \left( {e^{t\lambda _{238} } - 1} \right)^2 }}} - 1} \right),
\end{equation*}
where λ2 35 and λ 238 are the decay constants of 235U and 238U (Steiger & Jäger, Reference Steiger and Jäger1977), respectively.
Zircons GJ-1 (207Pb–206Pb age = 609±1 Ma; Jackson et al. Reference Jackson, Pearson, Griffin and Belousova2004), 91500 (207Pb–206Pb age = 1065±1 Ma; Wiedenbeck et al. Reference Wiedenbeck, Allé, Corfu, Griffin, Meier, Oberli, Von Quadt, Roddick and Speigel1995) and A382 (concordia age = 1876±2 Ma; Lauri et al. Reference Lauri, Andersen, Hölttä, Huhma and Graham2011) were used as standards. Repeated analyses of the in-house reference zircon C (weighted average 207Pb–206Pb age = 556.4±1.5 Ma; J. Lamminen, pers. comm. 2011) during the period the samples were analysed gave a weighted average 207Pb–206Pb age of 556.0±1.6 Ma (2σ, n = 168).
3.b. Lu–Hf isotope analysis
For Lu–Hf the analytical protocols of Elburg et al. (Reference Elburg, Andersen, Bons, Simonsen and Weisheit2013) were followed. Ablation conditions were that of beam diameter 50–60 μm (aperture imaging mode), pulse frequency 5 Hz and beam fluence c. 2 J cm−2 using static ablation. Data reduction was performed using Nu Instruments online software.
For the period spanning the samples, repeated analyses of the Mud Tank zircon yielded an arithmetic mean 176Hf/177Hf = 0.282511±47 (2σ; n = 225) and Temora-2 176Hf/177Hf = 0.282680±48 (2σ; n = 145), the latter (±2εHf) being accepted as a conservative estimate of the precision of the method. A decay constant value for 176Lu of 1.867 × 10⁻¹¹ (Söderlund et al. Reference Söderlund, Patchett, Vervoort and Isachsen2004) has been used in all calculations. For εHf calculations we used the present-day chondritic 176Hf/177Hf = 0.282785 and 176Lu/177Hf = 0.0336 (Bouvier, Vervoort & Patchett, Reference Bouvier, Vervoort and Patchett2008). We have adopted the depleted mantle parameters of Griffin et al. (Reference Griffin, Pearson, Belousova, Jackson, van Achterbergh, O’Reilly and Shee2000); this model, modified to the aforementioned decay constant and chondritic uniform reservoir (CHUR) parameters, gives present-day 176Hf/177Hf = 0.28325 (+16.4 εHf; similar to average mid-ocean ridge basalt) from chondritic initial 176Hf/177Hf at 4.56 Ga and 176Lu/177Hf = 0.0388.
4. Sample description and U–Pb and Lu–Hf results
The sample localities are given in Figure 1b and Table 1 and their approximate stratigraphic positions are given in Figure 2. U–Pb data are given in Figure 3 and online Supplementary Table S1 at http://journals.cambridge.org/geo, while Lu–Hf data are given in Figure 4 and online Supplementary Table S2 at http://journals.cambridge.org/geo.
Sample positions.

Combined histogram and kernel density estimator plots of all samples stacked according to their (presumed) stratigraphic positions. Solid (red) curves are KDEs calculated using the algorithm of Botev, Grotowski, & Kroese (Reference Botev, Grotowski and Kroese2010); dashed (blue) curves are gaussian KDEs with bandwidth = 25. Depositional ages: AA11-41: Hirnantian (latest Ordovician); R2010-2: Wenlock (Middle Silurian); R2010-6 and R2010-8: Ludlow (Middle–Late Silurian); MK12-1: Pridoli (latest Silurian); MK-2010-5, MK-2010-4, MK-2010-3, MK-2010-2 and MK-2010-7: Pennsylvanian (Late Carboniferous). Data from online Supplementary Table S1 at http://journals.cambridge.org/geo. Ages are given as 206Pb–238U ages if equal to or younger than 600 Ma, otherwise the 207Pb–206Pb ages have been used. Note that the individual panels use different y-axis scaling.

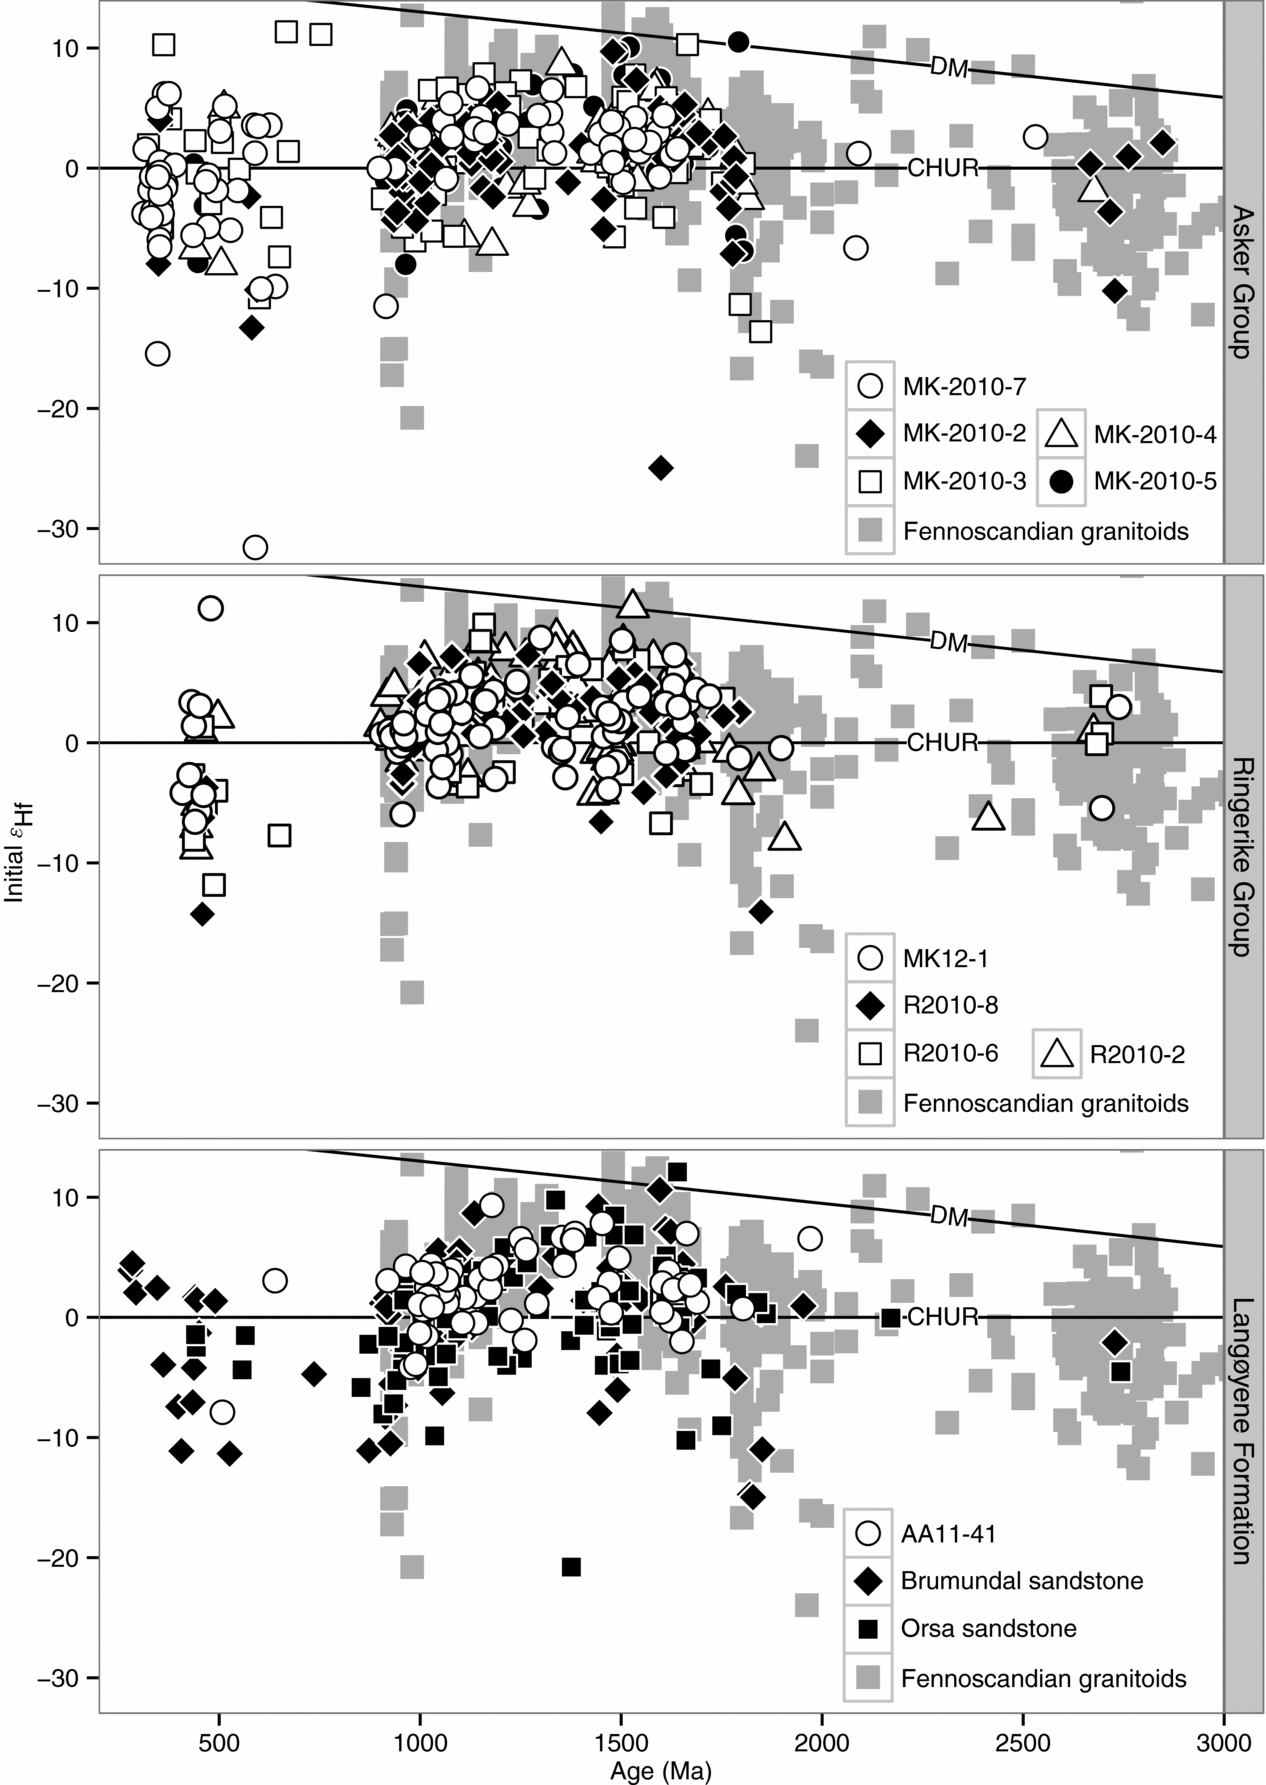
Initial εHf plotted against age (data from online Supplementary Table S2 at http://journals.cambridge.org/geo) with comparative fields for magmatic rocks in Fennoscandia (Patchett et al. Reference Patchett, Kouvo, Hedge and Tatsumoto1981; Vervoort & Patchett, Reference Vervoort and Patchett1996; Andersen, Griffin & Pearson, Reference Andersen, Griffin and Pearson2002; Andersen & Griffin, Reference Andersen and Griffin2004; Andersen et al. Reference Andersen, Griffin, Jackson, Knudsen and Pearson2004; Andersen, Griffin & Sylvester, Reference Andersen, Griffin and Sylvester2007; Andersen, Graham & Sylvester, Reference Andersen, Andersson, Graham, Åberg and Simonsen2009; Andersen et al. Reference Andersen, Andersson, Graham, Åberg and Simonsen2009; Pedersen et al. Reference Pedersen, Andersen, Konnerup-Madsen and Griffin2009; Heinonen, Andersen & Rämö, Reference Heinonen, Andersen and Rämö2010; Kurhila, Andersen & Rämö, Reference Kurhila, Andersen and Rämö2010; Lauri et al. Reference Lauri, Andersen, Hölttä, Huhma and Graham2011, Reference Lauri, Andersen, Räsänen and Joupperi2012; Heilimo et al. Reference Heilimo, Halla, Andersen and Huhma2013) and detrital zircon from the Orsa and Brumundal sandstones (Andersen et al. Reference Andersen, Saeed, Gabrielsen and Olaussen2011). Ages are given as 206Pb–238U ages if equal to or younger than 600 Ma, otherwise the 207Pb–206Pb ages have been used.
4.a. AA11–41
This sample is a medium-grained calcareous sandstone belonging to the Langøyene Formation (Figs 1b, 2). Zircon from AA11–41 are dominated by the c. 1000–1100 Ma age group. This age group has an εHf range of +4 to −2, in which only 1 of 25 grains are negative.
4.b. R2010–2
This sample is a fine-grained sandstone from the Sundvollen Formation (Figs 1b, 2). The major zircon age groups in this sample are c. 400–500 Ma, c. 900–1200 Ma, c. 1300–1500 Ma and c. 1600–1700 Ma. Grains in the c. 400–500 Ma group range in εHf values from +2 to −9. The c. 900–1200 Ma group has largely positive (21/27) εHf values ranging from +8 to −4, while grains in the c. 1600–1700 Ma group range from +6 to −2.
4.c. R2010–6
This sample is a fine-grained sandstone from the lower part of the Stubdal Formation (Figs 1b, 2). The main age groups in this sample are found at c. 400–500 Ma, c. 1000–1200 Ma and c. 1600–1700 Ma. In the c. 400–500 Ma age group only one grain with a positive εHf value (+1) is found; the others range from −3 to −12. Two negative grains (–4 εHf, −2 εHf) are found in the c. 1000–1200 Ma range; the rest (n = 18) have εHf values from +10 to 0. The c. 1600–1700 Ma group have εHf values from +5 to −3.
4.d. R2010–8
This sample is a fine-grained sandstone from the upper part of the Stubdal Formation (Figs 1b, 2). The combined histogram and KDE plot (Fig. 3) is dominated by an age group at c. 1000–1100 Ma. This age group have an εHf range of +7 to 0.
4.e. MK12–1
This sample is a calcareous medium-grained sandstone from the Holmestrand Formation (Figs 1b, 2). Peaks in the KDE plot (Fig. 3) define age groups at c. 400–500 Ma, c. 900–1200 Ma, c. 1400–1500 Ma and 1600–1700 Ma. The c. 400–500 Ma age group have εHf values of −7 to +11, a small majority (6/10) of which are negative. In the c. 900–1200 Ma group the εHf values range from +6 to −6, in the c. 1400–1500 Ma group they range from +3 to −4, while in the c. 1600–1700 Ma group they range from +7 to −1. These three groups have largely positive εHf values (32/40, 9/12 and 9/12, respectively).
4.f. MK-2010–5
This sample is a fine-grained calcareous sandstone from the lower part of the Tanum Formation (Figs 1b, 2). The main zircon age group is found at c. 1000–1100 Ma. In this group the εHf values range from +4 to −1, with the majority being positive (17/20).
4.g. MK-2010–4
This sample is a fine-grained calcareous sandstone from the upper part of the Tanum Formation (Figs 1b, 2). The largest peak in the KDE plot (Fig. 3) is found at c. 1050 Ma, defining a c. 1000–1100 Ma age group. This age group have εHf values ranging from +6 to 0.
4.h. MK-2010–3
This sample is a fine-grained sandstone overlain by conglomerate, most likely belonging to the Tanum Formation of the Asker Group (Figs 1b, 2). The combined histogram and kernel density estimate plot (Fig. 3) define age groups at c. 300–400 Ma, c. 900–1100 Ma and c. 1450–1800 Ma. Zircon grains in the 300–400 Ma age group have εHf values from +10 to −5, the 900–1100 Ma group have εHf values from +7 to −6 and the 1450–1800 Ma age group have εHf values from +10 to −11.
4.i. MK-2010–2
This sample is a medium-grained sandstone belonging to the Tanum Formation (Figs 1b, 2). The zircon grains in the overall 2847–333 Ma age range define two major age groups at c. 900–1200 Ma and c. 1400–1800 Ma. Zircons in the c. 900–1200 Ma group have εHf values from +5 to −4, of which a majority (29/46) are positive. In the c. 1400–1800 Ma group all zircons, except for an unusually negative (εHf = −25) grain at 1599 Ma, have εHf values from +10 to −7.
4.j. MK-2010–7
This sample, which likely belongs to the Tanum Formation, is a cross-stratified sandstone comprising the upper part of the sandstone sequence of the Asker Group in the Ringerike area (Figs 1b, 2). A zircon age peak at c. 350 Ma, defining a c. 300–400 Ma age group, dominates this sample. The zircons in this age group have εHf values ranging from +6 to −15, with the majority (18/27) being negative.
5. Discussion
5.a. Potential protosources
Zircon from the Langøyene Formation, the Ringerike Group and the Asker Group records ages ranging from Archaean to Carboniferous. From Figures 3 and 4 it is evident that these ages largely coincide with known events of crustal evolution in Fennoscandia, as well as magmatism in the Caledonides.
εHf values of the Archaean grains (Fig. 4) in this study fall within the range recorded for rocks in the Archaean Domain (Fig. 1a) of Fennoscandia (Patchett et al. Reference Patchett, Kouvo, Hedge and Tatsumoto1981; Lauri et al. Reference Lauri, Andersen, Hölttä, Huhma and Graham2011, Reference Lauri, Andersen, Räsänen and Joupperi2012; Heilimo et al. Reference Heilimo, Halla, Andersen and Huhma2013), which today are exposed in N Norway, NE Sweden, E Finland and NW Russia.
Ages of 1800–1700 Ma are recorded in several samples (Fig. 3). In Fennoscandia this period is characterized by the first stage of the formation of the Transscandinavian Igneous Belt (TIB-1; Fig. 1a; Gorbatschev, Reference Gorbatschev, Högdahl, Andersson and Eklund2004). The majority (19/26) of the grains (Fig. 4) found from this time period are consistent, within error (±2SE), with the evolutionary trend of the crustal source of TIB granite magmas (Andersen et al. Reference Andersen, Andersson, Graham, Åberg and Simonsen2009). With the exception of three grains with εHf values of +12, −6 and −11, the remaining grains plot close (±2 εHf) to this trend. Zircons with negative εHf are compatible with values reported from Palaeoproterozoic granitic intrusions within the Archaean Domain (Patchett et al. Reference Patchett, Kouvo, Hedge and Tatsumoto1981), inherited zircon in rocks from TIB (Andersen et al. Reference Andersen, Andersson, Graham, Åberg and Simonsen2009) and Palaeoproterozoic leucogranites in southern Finland (Kurhila, Andersen & Rämö, Reference Kurhila, Andersen and Rämö2010).
Zircon grains falling within the 1700–1600 Ma age range are common to all samples (Fig. 3). The formation of TIB stages TIB-2 and TIB-3 (Larson & Berglund, Reference Larson and Berglund1992; Andersson et al. Reference Andersson, Sjöström, Högdahl, Eklund, Högdahl, Andersson and Eklund2004; Gorbatschev, Reference Gorbatschev, Högdahl, Andersson and Eklund2004), the formation of Rapakivi granites in southern Finland (e.g. Heinonen, Andersen & Rämö, Reference Heinonen, Andersen and Rämö2010) and island-arc magmatism related to the Gothian Orogeny (Åhäll & Connelly, Reference Åhäll and Connelly2008) produced zircon-fertile rocks in Fennoscandia during this time period. With the exception of one unusually negative grain (–10 εHf), the 1700–1600 Ma zircon have εHf values of +12 to −4 (Fig. 4). These values are consistent with reported values from Middle Proterozoic calc-alkaline gneiss complexes from the Kongsberg–Marstrand, Bamble–Lillesand and Randsfjord–Lyngern blocks of the Southwestern Scandinavian Domain (SSD; Fig. 1a) and late (1670 Ma) TIB granites from the south-westernmost part of the Transscandinavian Igneous Belt (Andersen, Griffin & Pearson, Reference Andersen, Griffin and Pearson2002); negative values are consistent, within error (±2 εHf; 2SE), with the evolutionary trend of TIB (Andersen et al. Reference Andersen, Andersson, Graham, Åberg and Simonsen2009).
Voluminous magmatism in the Hardangervidda–Rogaland, Telemark, Bamble–Lillesand, Kongsberg–Marstrand and Randsfjord–Lyngern blocks of the SSD (Fig. 1a) affected the Fennoscandian Shield early in the Mesoproterozoic era (Andersen et al. Reference Andersen, Griffin, Jackson, Knudsen and Pearson2004; Bingen et al. Reference Bingen, Griffin, Torsvik and Saeed2005 b; Åhäll & Connelly, Reference Åhäll and Connelly2008; Bingen & Solli, Reference Bingen and Solli2009). Magmatism in the Telemark block, which included a sequence of bimodal volcanic rocks and correlative supracrustal rocks (Bingen & Solli, Reference Bingen and Solli2009), peaked at 1500 Ma (Bingen et al. Reference Bingen, Griffin, Torsvik and Saeed2005 b). At c. 1440–1380 Ma the crust of SW Sweden was affected by the Hallandian thermo-magmatic event (Christoffel, Connelly & Åhäll, Reference Christoffel, Connelly and Åhäll1999; Söderlund et al. Reference Söderlund, Möller, Andersson, Johansson and Whitehouse2002). In this study zircon with ages 1500–1300 Ma is common to all samples, but this age group is most dominant in sample R2010–2 (Fig. 3). εHf values in this age group vary from −10 to +7 (Fig. 4), the majority (98/117) of which plot on or above the CHUR curve. Detrital zircon with similar εHf values (−8 to +9) have been reported from the Mesoproterozoic Rjukan Rift Basin (Lamminen & Köykkä, Reference Lamminen and Köykkä2010). The generally juvenile εHf composition is consistent with values recorded in similarly aged rocks in the Bamble–Lillesand and Kongsberg–Marstrand blocks (Andersen et al. Reference Andersen, Griffin, Jackson, Knudsen and Pearson2004), in c. 1521–1485 Ma deformed gneisses and granitoids in the Hardangervidda–Rogaland block (Roberts et al. Reference Roberts, Slagstad, Parrish, Norry, Marker and Horstwood2012) and in the 1555 Ma Åsen metatonalite in the Telemark block (Pedersen et al. Reference Pedersen, Andersen, Konnerup-Madsen and Griffin2009).
The largest age group in this study, which contain 48% of all U–Pb data, is found at 1300–900 Ma (Fig. 3). Fennoscandia was affected by magmatism and metamorphism related to the Sveconorwegian Orogeny during this period (e.g. Bingen & van Breemen, Reference Bingen and van Breemen1998; Andersen et al. Reference Andersen, Griffin, Jackson, Knudsen and Pearson2004; Bingen et al. Reference Bingen, Davis, Hamilton, Engvik, Stein, Skar and Nordgulen2008; Pedersen et al. Reference Pedersen, Andersen, Konnerup-Madsen and Griffin2009). With the exception of two zircon grains with εHf values of −25 and −32, the zircons from this age range vary in εHf from −15 to +11 (Fig. 4), which is consistent with values reported for magmatic and inherited zircon from Sveconorwegian granitoids (Andersen, Griffin & Pearson, Reference Andersen, Griffin and Pearson2002; Andersen et al. Reference Andersen, Griffin, Jackson, Knudsen and Pearson2004; Andersen, Griffin & Sylvester, Reference Andersen, Griffin and Sylvester2007; Pedersen et al. Reference Pedersen, Andersen, Konnerup-Madsen and Griffin2009).
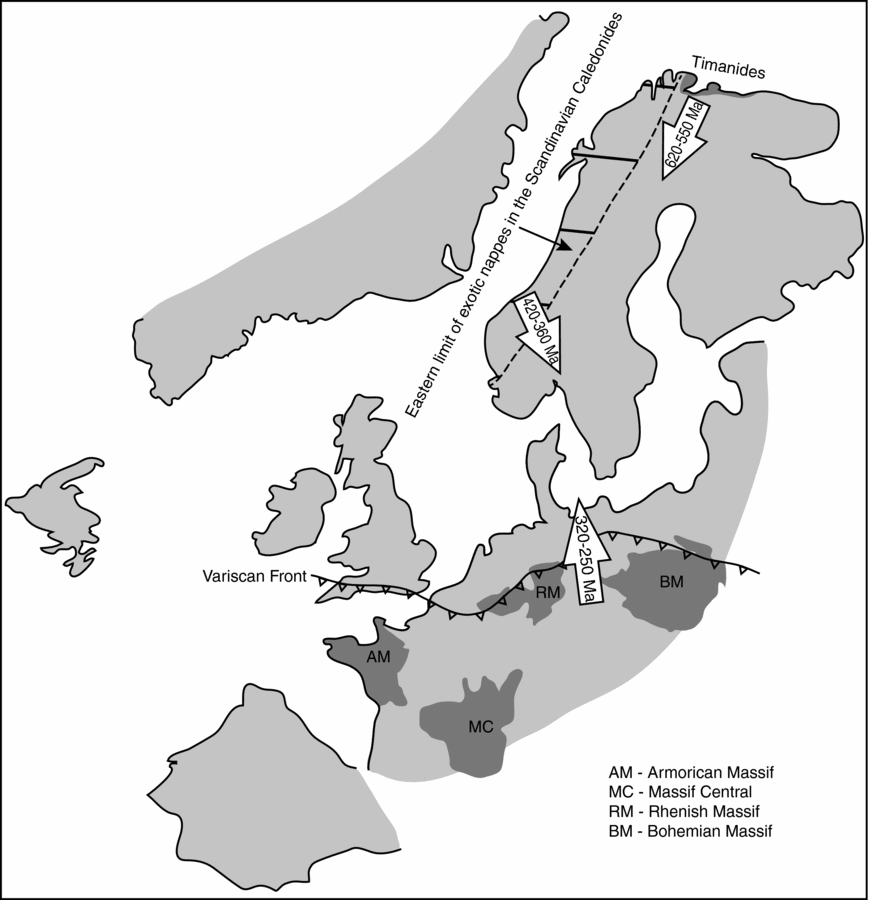
Fennoscandia is characteristically poor in Middle–Late Neoproterozoic magmatism, with little or no production of zircon fertile rocks between c. 900 Ma and the onset of magmatism related to the Caledonian Orogeny (e.g. Bingen & Solli, Reference Bingen and Solli2009). Nevertheless, detrital zircon of this age has been reported from the Neoproterozoic Hedmark Basin (Bingen et al. Reference Bingen, Griffin, Torsvik and Saeed2005 a) and the Asker Group (Dahlgren & Corfu, Reference Dahlgren and Corfu2001). Middle–Late Neoproterozoic grains found in this study make a contribution to the populations of samples MK-2010-2, MK-2010-3, MK-2010-7, R2010-2 and AA11-41. Bingen et al. (Reference Bingen, Skår, Marker, Sigmond, Nordgulen, Ragnhildstveit, Mansfeld, Tucker and Liegeois2005b ) attributed their Neoproterozoic zircon to magmatism in the Egersund area, but since only zircon-free low-volume mafic dykes are recorded in this area (e.g. Bingen & Solli, Reference Bingen and Solli2009) it is highly unlikely to be the source of any Neoproterozoic detrital zircon recorded in Fennoscandia. As discussed in Andersen et al. (Reference Andersen, Saeed, Gabrielsen and Olaussen2011), the Neoproterozoic grains recorded by Bingen et al. (Reference Bingen, Skår, Marker, Sigmond, Nordgulen, Ragnhildstveit, Mansfeld, Tucker and Liegeois2005b ) have U–Pb ages and εHf values fully compatible with Neoproterozoic loss of radiogenic lead in zircon from Sveconorwegian granitoids. While the Neoproterozoic zircon grains reported here are broadly compatible with a similar lead loss scenario, this is deemed unlikely as these grains are all close to concordant. Dahlgren & Corfu (Reference Dahlgren and Corfu2001) suggested that the Late Neoproterozoic zircons recorded in the Asker Group were derived from a southern source located somewhere in the newly uplifted northern or central Variscan Mountains in Central Europe. As Late Neoproterozoic zircon grains are also recorded in sediments underlying the Asker Group (this study), they are more likely to be of Fennoscandian origin. One possible source area could be the Middle Allochton Seve nappe or the exotic Kalak nappe (Corfu et al. Reference Corfu, Roberts, Torsvik, Ashwal and Ramsay2007; Kirkland, Daly & Whitehouse, Reference Kirkland, Daly and Whitehouse2008) of the Scandinavian Caledonides (e.g. Bingen & Solli, Reference Bingen and Solli2009). Neoproterozoic zircon could also be derived from a northern source located in the Timanides (Fig. 5) where rocks of compatible ages are recorded (e.g. Gee et al. Reference Gee, Pease, Larionov and Dovshikova2000; Larionov, Andreichev & Gee, Reference Larionov, Andreichev, Gee, Gee and Pease2004). Detrital zircon inferred to have been sourced from the Timanides in a foreland basin setting have been found in the Cambrian Dividal Group (Andresen, Reference Andresen2013) in northern Norway. The southern limit of this foreland basin is, as of yet, undetermined (Late Neoproterozoic zircon are however common in Late Cambrian – Early Ordovician sedimentary deposits in the St Petersburg area; Miller et al. Reference Miller, Kuznetsov, Soboleva, Udorantina, Grove and Gehrels2011) but recycling of sediments in such basins could be a viable mechanism for introducing Neoproterozoic detrital zircon to southern Norway in the Palaeozoic era.
Late Carboniferous palinspastic map of the central North Sea area (modified after Coward et al. Reference Coward, Dewey, Hempton, Holroyd, Evans, Graham, Armour and Bathurst2003; Ziegler et al. Reference Ziegler, Schumacher, Dezès, Wees, Cloetingh, Wilson, Neumann, Davies, Timmerman, Heeremans and Larsen2004), with outlines of the main Variscan massifs and possible older source areas indicated.
Grains of Caledonian age make a significant contribution to the Ringerike Group samples and a smaller contribution to the Asker Group samples. These grains are most likely derived from the c. 500–430 Ma synorogenic intrusions in the Caledonides (Gee et al. Reference Gee, Fossen, Henriksen and Higgins2008; Bingen & Solli, Reference Bingen and Solli2009).
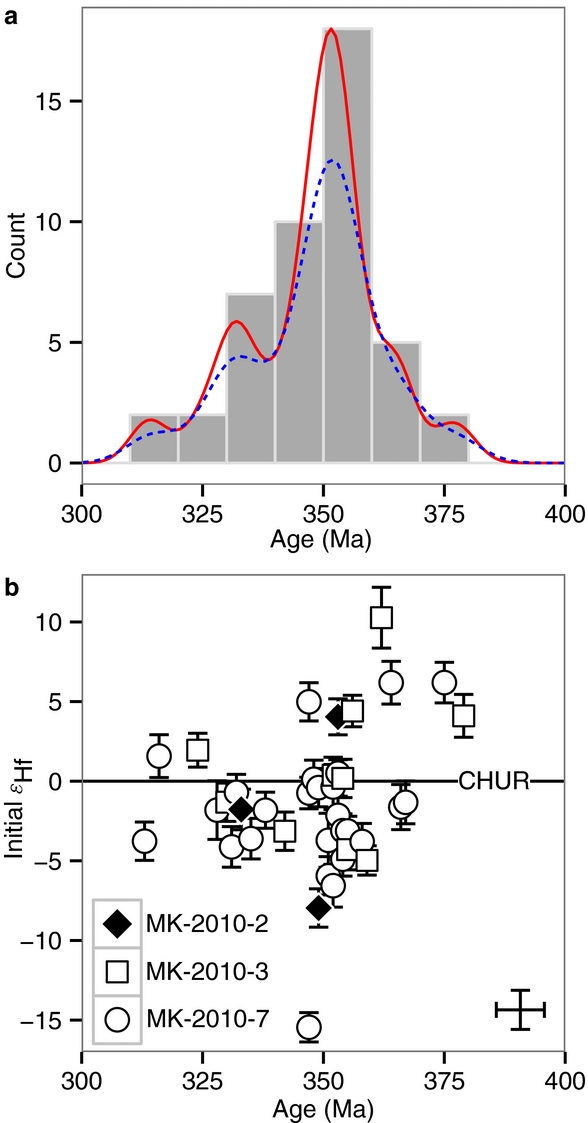
From the youngest Caledonian-related magmatism (c. 425 Ma) to the initiation of magmatism in the Oslo Rift at 300±1 Ma (Corfu & Dahlgren, Reference Corfu and Dahlgren2008) no magmatic activity is known in Fennoscandia. Nevertheless, a fairly large fraction of the zircon from the Asker Group have ages in the range c. 380–313 Ma, peaking at c. 350 Ma (Fig. 6a). Similarly aged grains were reported from the Asker Group by Dahlgren & Corfu (Reference Dahlgren and Corfu2001), who argued that these grains were derived from the Carboniferous Variscan Orogen.
(a) Combined histogram and kernel density estimator plot of Late Devonian – Late Carboniferous aged zircon grains from the Asker Group. Solid (red) curve is a KDE calculated using the algorithm of Botev, Grotowski & Kroese (Reference Botev, Grotowski and Kroese2010); dashed (blue) curve is a gaussian KDE with bandwidth = 5. Data from online Supplementary Table S1 at http://journals.cambridge.org/geo. Ages are given as 206Pb–238U ages. (b) Initial εHf plotted against age for the Late Devonian – Late Carboniferous aged zircon grains from the Asker Group. Vertical error bars are 2SE; error bars in the lower right corner show the arithmetic mean of the age errors (2σ) and of the εHf errors (2SE). Data from online Supplementary Table S2 at http://journals.cambridge.org/geo. Ages are given as 206Pb–238U ages.
5.b. Recycling of detrital zircon and input from the Variscan Mountains
Detrital zircon with U–Pb and Lu–Hf signatures covering sources as diverse both temporally and geographically as is recorded here are unlikely to have been derived directly from primary magmatic rocks. Recycling of older sediments, which could be the product of recycling of even older sediments, is therefore highly probable.
The Langøyene Formation and the Ringerike Group have age spectra broadly compatible with (meta)sediments in the Caledonides (Bingen & Solli, Reference Bingen and Solli2009) and modern river sediments known to sample (meta)sediments and primary magmatic rocks in the Caledonides (Morton, Fanning & Milner, Reference Morton, Fanning and Milner2008). The proposed difference in source area of the Sundvollen and Stubdal formations on the one hand, and the Holmestrand Formation (Davies, Turner & Sansom, Reference Davies, Turner and Sansom2005b ) on the other, is not reflected in the detrital zircon patterns.
The close similarity of U–Pb age and Lu–Hf signatures of the Ringerike Group and the Asker Group suggests that the Fennoscandia-derived detritus in the Asker Group could be sourced from a Silurian cover sequence similar to the Ringerike Group. Such sequences, which are now only preserved as small remnants outside the Oslo Rift, are likely to have covered much of central and western Fennoscandia in late- and post-Caledonian time. As the Late Devonian – Late Carboniferous aged zircons in the Asker Group have no known Fennoscandian source it seems likely that they were, as suggested by Dahlgren & Corfu (Reference Dahlgren and Corfu2001), derived from the Variscan Mountains of western or central Europe, which is the area in closest proximity to the Oslo Rift with rocks of such ages. Several areas in the Variscan Mountains are possible source areas: the Armorican Massif, which was affected by major intrusions (the Brittany granites) and associated metamorphism in the period 354–330 Ma (Martínez & Rolet, Reference Martínez, Rolet, Harris and Fettes1988); the Massif Central where c. 380–300 Ma rocks have been reported (e.g. Faure et al. Reference Faure, Cocherie, Mézème, Charles and Rossi2010); and the Bohemian Massif where c. 370–290 Ma rocks have been reported (e.g. Košler, Aftalion & Bowes, Reference Košler, Aftalion and Bowes1993; Siebel & Chen, Reference Siebel and Chen2009). The dearth of Hf data from the Variscan Mountains make a definite source region for the Late Devonian – Late Carboniferous aged zircon grains difficult to ascertain, but reported εHf values from the central Variscan Mountains (the central Alps and the Bohemian Massif) are generally low ranging from 0 to −8 (Schaltegger & Corfu, Reference Schaltegger and Corfu1992; Siebel & Chen, Reference Siebel and Chen2009). This trend of crustal contamination is also seen in our data (Fig. 6b) where 29 of the 39 zircons younger than 390 Ma have εHf values ranging from 0 to −15. The remaining zircon grains have a more juvenile composition (+1 to +10 εHf), suggesting that at least two sources have contributed to the <390 Ma grains.
If the youngest grains in the Asker Group (313±4 Ma and 316±2 Ma) were derived from a local source, they could mark the beginning of volcanism in the Oslo Rift. Since no rocks of such an age have as of yet been found in the Oslo Rift, it is however more likely that they come from the Variscan Mountains. Dahlgren & Corfu (Reference Dahlgren and Corfu2001) attributed the Neoproterozoic and Cambro-Ordovician grains in the Asker Group to the Variscan source, but since zircon of these ages are also found in the latest Ordovician Langøyene Formation and the Late Silurian Ringerike Group they are equally likely to be Fennoscandia-derived. The Variscan source may have contributed zircon of other ages found in our samples, but if it did the detrital zircon must have had U–Pb ages and Lu–Hf signatures indistinguishable from typical Fennoscandian sources. The Late Devonian – Late Carboniferous zircon grains are compatible with post-depositional lead loss from Caledonian grains, assuming a felsic protolith with 176Lu/177Hf = 0.010, possibly caused by contact metamorphism related to the overlying latest Carboniferous – Permian lavas. This is however deemed unlikely as the CL images of the grains show no evidence of metamictization or lead loss.
These findings highlight the intrinsic problems of using zircon as a tracer mineral from ‘source to sink’ in sedimentary provenance studies. Its refractory nature means that it will, in most cases, keep a record of its protolith through the U–Pb and Lu–Hf isotopic systems. This robustness is also the reason why zircon can survive multiple episodes of recycling (as is recorded in this study), causing us to only being able to trace zircon populations back to the rocks in which they crystallized and not the immediate precursor rocks, the ultimate goal of ‘source to sink’ sedimentary provenance studies.
6. Conclusion
The latest Ordovician Langøyene Formation, the Late Silurian Ringerike Group and the Late Carboniferous Asker Group contain detrital zircon ranging in age from Mesoarchaean to Carboniferous. The U–Pb age and Lu–Hf signatures of the detrital zircon correspond to virtually every known event of crustal evolution in Fennoscandia as well as synorogenic intrusions in the Scandinavian Caledonides. Such diverse – both temporally and geographically – sources for the Palaeozoic sandstones in the Oslo Rift are likely caused by several episodes of recycling of sediments in Fennoscandia.
In addition to its mostly Fennoscandia-derived detritus, the Asker Group contains Late Devonian – Late Carboniferous aged zircon grains. As no rocks of such ages are known from Fennoscandia, the most likely source area is located in the Variscan Orogen of central Europe. εHf values indicative of crustal to more juvenile sources suggest that at least two igneous sources have contributed to the <390 Ma zircon group. If the Variscan source contributed detrital zircon of other ages to the studied samples, they are indistinguishable from Fennoscandia-derived zircon.
Detrital zircon U–Pb age and Lu–Hf isotope data from Palaeozoic sandstones in the Oslo Rift highlight the difficulty of using zircon as a tracer mineral in ‘source to sink’ studies. Its refractory nature causes it to survive multiple episodes of recycling, meaning that only the protosources of the various age groups are recorded and not the immediate (meta)sedimentary precursor source.
Acknowledgements
Snorre Olaussen and Johan Petter Nystuen are thanked for help in the field. Tumseela Mubashir is thanked for providing data for samples R2010-2, R2010-6 and R2010-8. Thanks also to Siri Simonsen for analytical help with the ICP-MS, and Gunborg Bye Fjeld and Berit Løken Berg for laboratory assistance. We thank two anonymous reviewers whose constructive comments helped improve an earlier version of this article. The study was financially supported by the Department of Geosciences, University of Oslo and Vista project no. 6254. This is publication no. 37 from the Isotope Geology Laboratory at the Department of Geosciences, University of Oslo.
Declaration of interest
None.



