Introduction
Carbon exists in several forms, including graphite, fullerenes, diamond-like carbon (DLC), diamond, nanotubes and graphene.[Reference Pierson1] The ability of carbon to hybridize its bonds leads to a sensitive dependence of the properties of carbon materials on the sp 2 to sp 3 bonding ratio; consequently, they have emerged as potential materials for a wide range of applications. Amorphous DLC is a metastable carbon with a broad range of structures, comprised of carbon atoms of both sp 2 and sp 3 hybridizations arranged in a random network. Thus, the properties of DLC films could be a combination of those of graphite (purely sp 2 hybridized) and diamond (purely sp 3 hybridized) and depend on the fraction of sp 3 and sp 2 sites, the hydrogen content, and the ordering of sp 2 sites.[Reference Robertson2,Reference Zkria, Abdel-Wahab, Katamune and Yoshitake3] Owing to their unique properties, such as high hardness, smooth surface, low friction, chemical inertness, optical transparency, and high electrical resistivity, DLC films are becoming ideal for a variety of different industrial applications, including wear protective and antireflective coatings for tribological tools, biomedical coatings, magnetic storage media, and semiconductor devices.[Reference Silva, Robertson, Milne and Amaratunga4–Reference Kowalczyk, Milewski, Madej and Ozimina8]
Diamond and DLC films are considered as ideal cutting tool coatings.[Reference Dai, Zhou, Yuan, Ding and Fu9] Although diamond has a higher hardness, DLC film can be obtained by simpler fabrication methods and, unlike diamond, it can be deposited at room temperature, which is an important practical advantage for coating applications. As a candidate integration with DLC film, cemented carbide (WC-Co), comprising tungsten carbide and cobalt binder, is a practical material for cutting tools such as end mills and drill bits.[Reference Saai, Svenum, Kane, Friis and Berstad10,Reference Naragino, Egiza, Tominaga, Murasawa, Gonda, Sakurai and Yoshitake11] The DLC film coated on the WC-Co substrate is dense and smooth, unlike the rough surface of diamond film.[Reference Dai, Zhou, Yuan, Ding and Fu9] It is worth mentioning that the properties of these coatings depend mainly on the sp 3/sp 2 ratio, which, in turn, depends on the method and conditions of the film's deposition. Conventionally, DLC films have been deposited from a hydrocarbon source gas, by plasma-enhanced chemical vapor deposition; and glow discharge deposition. Unintentionally, both methods produce films containing a significant proportion of hydrogen which leads to a loss of sp 3 bonding.[Reference Akkerma, Efstathiadis and Smith12] On the other hand, hydrogen-free DLC films can be formed using other physical vapor deposition methods employed pure carbon vapor, including laser ablation, arc evaporation, and magnetron sputtering of graphite targets.[Reference Manikandan, Kavitha and Kennedy13,Reference Manikandan, Kennedy, Kavitha, Kaviyarasu, Maaza, Panigrahi and Mudali14]
Post-treatment of DLC films has been studied for years, and particularly pulsed laser annealing (PLA) was widely applied to various materials, including amorphous Si,[Reference Ryu, Gruber, Grigoropoulos, Poulikakos and Moon15] graphene oxide,[Reference Trusovas, Račiukaitis, Niaura, Barkauskas, Valušis and Pauliukaite16] diamond,[Reference Abubakr, Zkria, Katamune, Ohmagari, Imokawa, Ikenoue and Yoshitake17] DLC films, and carbon nanotubes.[Reference Narayan, Godbole and White18,Reference Narayan, Bhaumik, Sachan, Haque, Gupta and Pant19] PLA (Nd:YAG laser, λ = 266 nm) was demonstrated to achieve the crystallization of epitaxial oxide thin films with functional properties close to those reported for thermal treatments, but with shorter effective heating times.[Reference Queraltó, Pérez del Pino, de la Mata, Arbiol, Tristany, Obradors and Puig20] In our most recent work,[Reference Abubakr, Zkria, Katamune, Ohmagari, Imokawa, Ikenoue and Yoshitake17] we proposed PLA (ArF laser, λ = 193 nm) as a new potential method for shallow doping and the formation of conductive layers on single-crystalline diamond surfaces. Regarding DLC films, post UV-laser annealing was proposed to form high conductive transparent DLC structures.[Reference Stock, Antoni, Diebold, Gowda, Hajjar-Garreau, Aubel and Muller21] Furthermore, Lee and Ki[Reference Lee and Ki22] demonstrated a laser-based method for rapidly fabricating graphene-based transparent conductive films on glass substrates by the laser annealing of DLC films in a shielding gas environment. Narayan's group experimentally demonstrated the conversion of amorphous carbon deposited onto low thermal conductivity substrates (sapphire) into Q-carbon (quenched carbon) and diamond nano- and microstructures by PLA, which show some extraordinary properties including excellent field emission characteristics and high temperature superconductivity.[Reference Narayan, Bhaumik, Gupta, Haque and Sachan23–Reference Bhaumik, Sachan, Gupta and Narayan25] In this process, the DLC films were melted rapidly in a super-undercooled state and subsequently quenched to room temperature within time <200 ns, wherein substrates with lower thermal conductivity trap heat flow, inducing larger undercooling, consequently, facilitating the formation of Q-carbon and diamond.[Reference Gupta, Sachan, Bhaumik, Pant and Narayan26] In this work, hydrogen-free DLC films were coated on WC-Co substrates through the cathodic arc ion plating method, and then the films were irradiated by ArF nanosecond pulsed laser (193 nm, 20 ns) at different laser energy densities (0.9–1.7 J/cm2). The composition and microstructure variations of the as-deposited (before PLA) and annealed films have been investigated by Raman spectroscopy and scanning electron microscopy.
Experimental methods
Film deposition and the nanosecond pulsed laser annealing process
Various deposition methods involve energetic species to deposit DLC films,[Reference Lifshitz27,Reference Zkria, Gima, Shaban and Yoshitake28] identifying the essential role of the particle energy in obtaining hard films with a significant sp 3-bonded carbon. In this study, the cathodic arc ion plating method was employed to deposit hydrogen-free DLC thin films onto WC-Co substrates. Cathodic arc ion plating is a high-energy deposition process that employs a vacuum arc to generate highly energetic ionized vapor from target materials. The substrate is negatively biased with respect to the anode, and the positive ions generated from the carbon target (purity of 99.99%) are deposited on the substrate. WC-Co (K-type cemented carbide, φ10 × 5.5 mm) with polished surface up to Ra = 0.003 µm was used as the substrate. Before insertion of the substrates into the chamber, they were ultrasonically cleaned in acetone followed by methanol and then rinsed with deionized water. The films were deposited at a deposition rate of 0.3 µm/h at a substrate temperature of less than 250 °C. To study the structural evolution of the deposited films, the Ultrafast nanosecond pulsed laser annealing (ns-PLA) process was operated by applying a single pulse of ArF excimer laser (λ = 193 nm; full width at half maximum = 20 ns) at different energy densities of 0.9, 1.2, 1.5, and 1.7 J/cm2.
Film characterizations: Raman spectroscopy and scanning electron microscopy
An essential requirement for studying carbon materials is the ability to identify all members of the carbon family using a powerful, nondestructive, fast, and high-resolution characterization tool. All these conditions are attainable by Raman spectroscopy, with the fact that most of the published papers on carbon materials have at least a Raman spectrum in them.[Reference Ferrari and Robertson29] In our study, the quality of the carbonaceous structures before and after ns-PLA was investigated by micro-Raman spectroscopy. Raman spectra were obtained by using a confocal spectrometer/microscope (WITec confocal Raman microscope-alpha 3000 M) equipped with a thermodynamically cooled (−70 °C) CCD camera and a microscope. The samples were illuminated with a continuous-wave diode-pumped solid-state laser providing 532 nm radiation. The 100×/0.75 NA objective lens and a 3600 lines/mm grating were used to record the spectra. The accumulation time was 10 s, and the number of cycle during the accumulation was 10. The laser beam was focused on the sample to a spot of ~2 µm in diameter. The Raman scattering wavenumber axis was calibrated by a standard crystalline Si sample (characteristic Raman peak of Si (001) at 520.6 cm−1). Parameters of the bands associated with the sp 2- and sp 3-bonded carbon were calculated by fitting the experimental spectra with Gaussian shape components. For phase identification, Raman measurements were correlated with high-resolution scanning electron microscopic (SEM) images acquired using the FEI Verios 460L field-emission scanning electron microscope.
Results and discussion
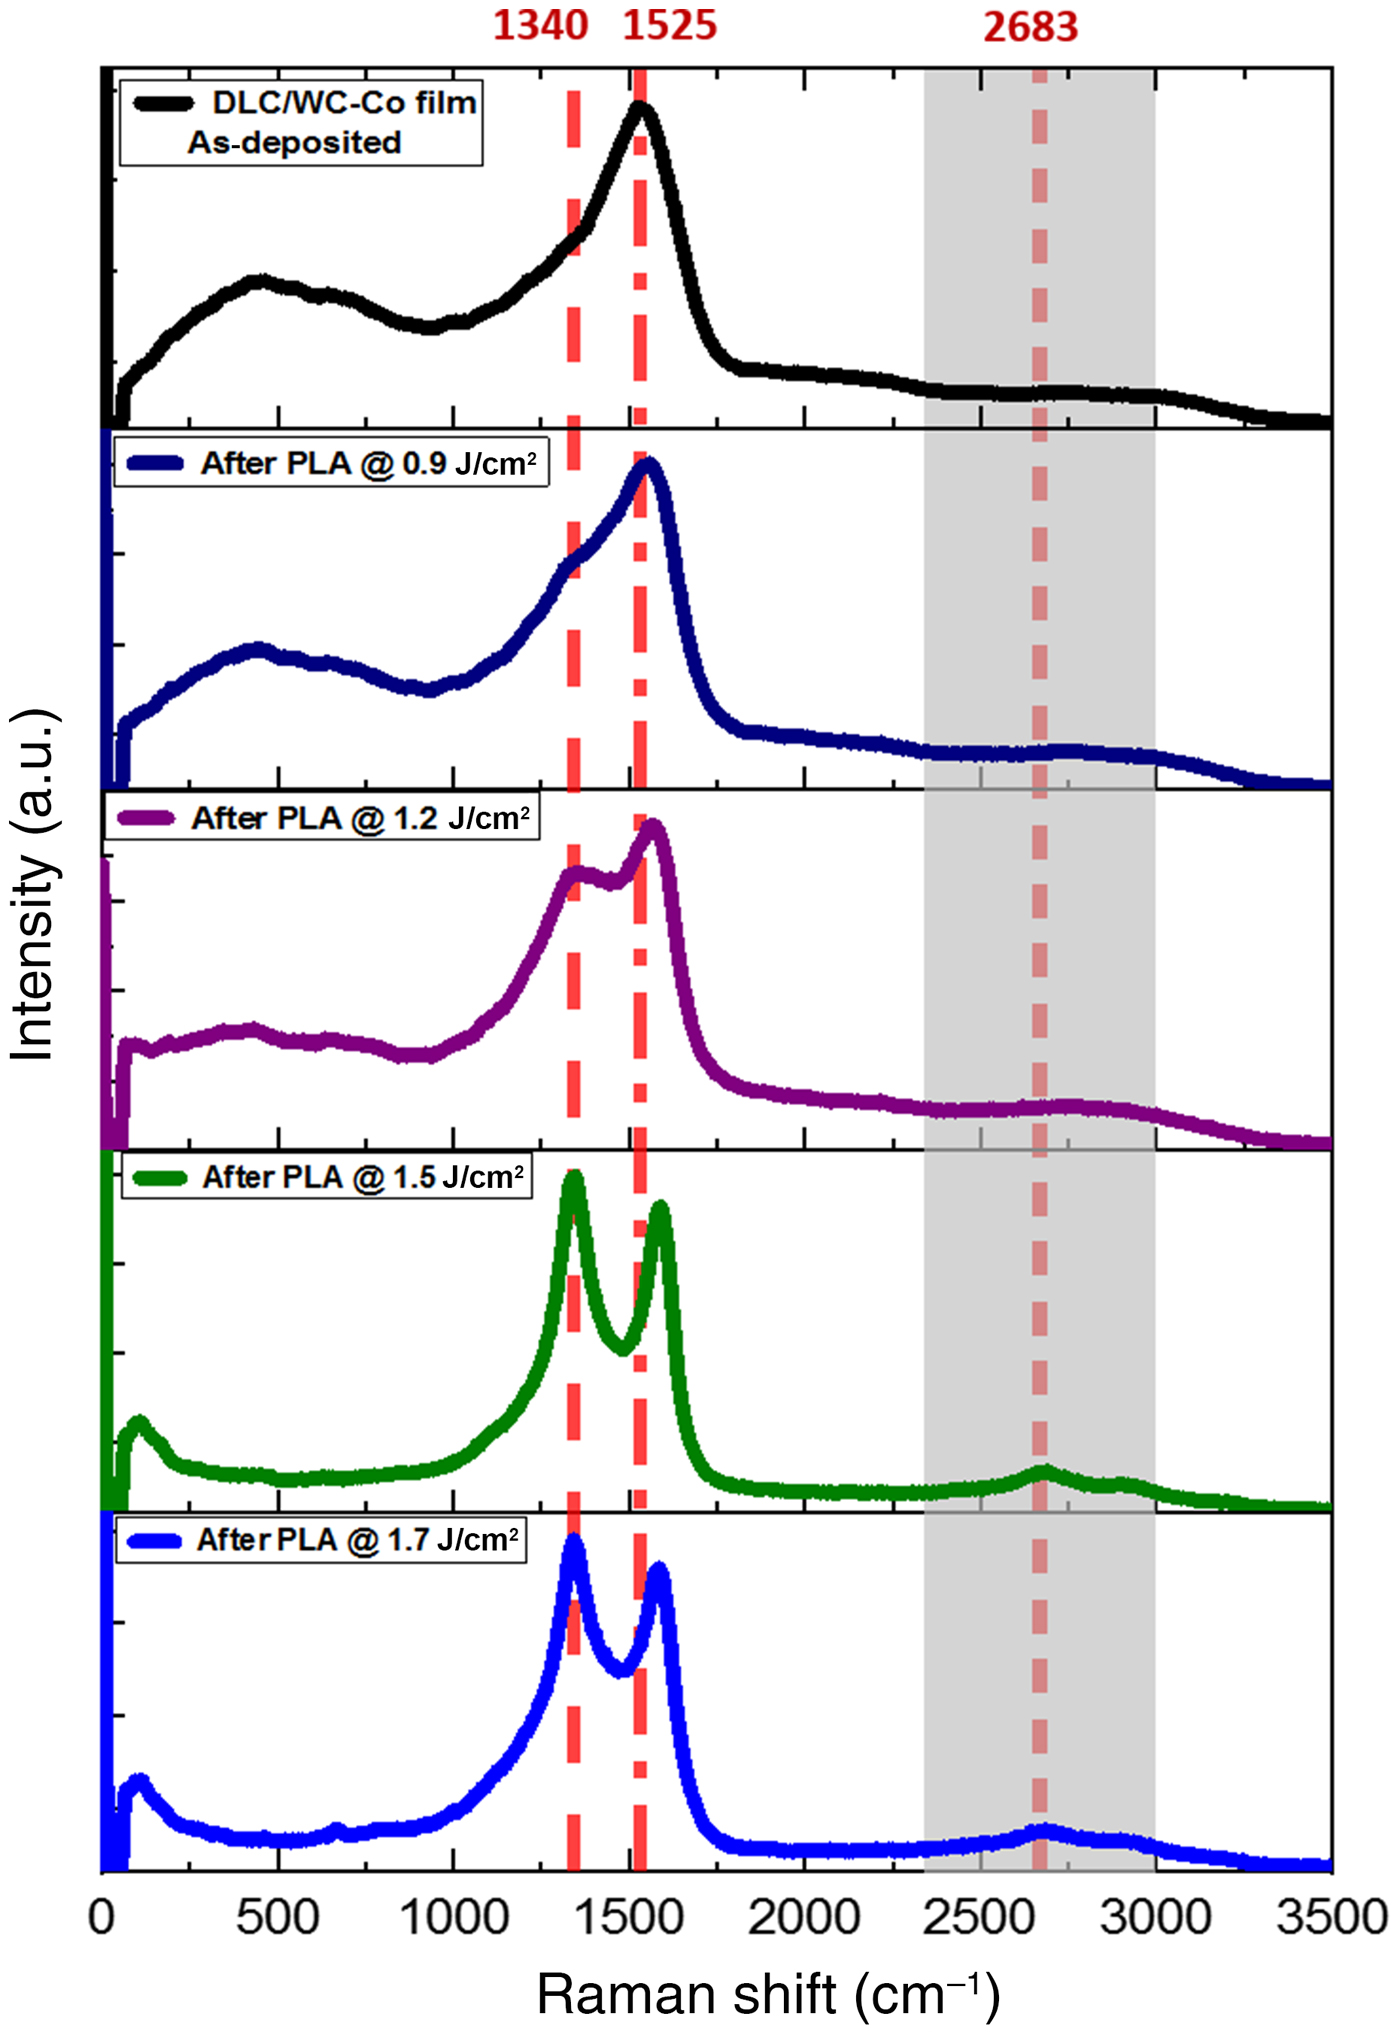
Although the visible Raman spectroscopy is more sensitive to sp 2 sites due to the excitation of their π states by visible photons, it is widely used for the characterization of DLC films to indirectly derive the sp 3 fraction.[Reference Salis, Gardiner, Bowden, Savage and Rodway30] Visible Raman spectra of DLC/WC-Co films, before and after irradiation with a single laser pulse at different energy densities (0.9, 1.2, 1.5, and 1.7 J/cm2), are shown in Fig. 1. Non-irradiated (as-deposited) film shows a single peak due to the E2g phonon mode in the Brillouin zone center, which is commonly corresponding to the G-peak located in between 1500 and 1630 cm−1. This vibrational mode signifies bond stretching of sp 2-C atoms for both rings and chains.[Reference Yan, Zhang, Kim and Pinczuk31] The G-peak position in Fig. 1, located at 1525 cm−1, is in consistent with that (at 1526 cm−1) of DLC film prepared by the mass selected C+ ion beam deposition system reported by Prawer et al.[Reference Prawer, Nugent, Lifshitz, Lempert, Grossman, Kulik, Avigal and Kalish32] Upon laser irradiation, an additional peak shoulder appears near 1340 cm−1, which represents the D-peak and can be attributed to A1g symmetry phonon near the K-zone boundary involving the breathing modes of sp 2 carbon atoms.[Reference Ferrari and Robertson29] For all the irradiated films, Raman spectra show distinct changes as a function of laser energy density, with the position of the G-peak shifting to higher values. The D-peak appears (which is practically absent in the as-deposited film), and its intensity rises with increasing laser energy density. It was reported[Reference Ferrari33] that the G-peak dispersion occurs only in more disordered carbon (no dispersion in graphite) due to the existence of different phonon modes. The dispersion arises from a resonant selection of sp 2 configurations or clusters with wider π-band gaps and, correspondingly, higher vibration frequencies.[Reference Ferrari33] The appearance of D-peak and the rise of intensity with increasing laser energy is an indication of graphitization, since the D-peak is a well-known feature of the graphite spectrum.[Reference Anders, Ager, Pharr, Tsui and Brown34]
Typical visible Raman spectra of DLC/WC-Co film, as-deposited, and after ns-PLA at different pulsed laser energy densities over the range of 0–3500 cm−1.

The mechanism of structural evolution of DLC/WC-Co films shown in Fig. 1 can be explained as follows: by ns-PLA, DLC films were melted and the atoms of the molten carbon (metallic) are closely packed. Followed by rapid quenching at room temperature, bonding characteristics change to covalent, which means the C–C-bonded tetrahedra are formed and packed randomly to form an amorphous structure. Resultant structure after annealing consists of sp 3 bonding within the tetrahedra and a mixture of sp 3 and sp 2 between the tetrahedra. Here, the effect of laser annealing was different from the conversion of a-C film to Q-carbon that was reported by Narayan's group.[Reference Narayan, Bhaumik, Gupta, Haque and Sachan23,Reference Narayan and Bhaumik35] The difference is mainly owing to the employed deposition technique (KrF-PLD) and, consequently, properties of the evolving film, as well as the thermal conductivity of the substrate (sapphire). Both were confirmed to have a crucial effect in the formation of Q-carbon. Most recent experiments have shown that Cr-doping in sapphire renders a distinct transition from Q-carbon to sp 2-bonded films with increasing Cr content of sapphire. The higher content is expected to increase the thermal conductivity and undercooling.
To analyze the experimental data, three Gaussian peaks were used to accurately fit the acquired Raman spectra, with fixed peak positions at 1140 cm−1 (T-peak), 1332 cm−1 (D-peak), and 1580 cm−1 (G-peak), corresponding to Raman-active vibrational modes. Figures 2(a)–2(f) track the structural and morphological changes in DLC/WC-Co films, as-deposited, and after a single pulse of ArF laser at energy densities of 0.9 and 1.2 J/cm2, by Raman spectra and SEM micrograph. As shown in Fig. 2(a), reproduced fitted spectrum of as-deposited layer reveals G- and D-peaks at 1547 and 1371 cm−1, respectively, C-sp 2% is calculated to be ~60%, and rest is sp 3. The C-sp 2% decreased after laser annealing to 28% at 1.2 J/cm2, as shown in Fig. 2(c), and the G-peak has a blue shift with a value of 30 cm−1. Based on the “three-stage model” proposed by Ferrari and Robertson,[Reference Ferrari and Robertson29] visible Raman spectra for all disordered carbons can be classified into three stages: (1) perfect graphite to nanocrystalline graphite, (2) nanocrystalline graphite to sp 2 amorphous carbon, and (3) sp 2 amorphous carbon to sp 3 tetrahedral amorphous carbon. Results of our films follow the trend of disordering of amorphous carbon in stage 3, with the main changes of increasing sp 3 content accompanied by the blue shift of G-peak by laser annealing. This behavior is attributed to the changes of sp 2 sites from rings to chains, specifically from delocalized aromatic bonds to the shorter localized olefinic bonds (C=C), which have higher vibration frequencies.[Reference Lin-Vien, Colthurp, Fateley and Grasselli36]
Raman spectra and SEM images: (a),(d) as-deposited and after ns-PLA processed at (b),(e) 0.9 J/cm2 and (c),(f) 1.2 J/cm2.
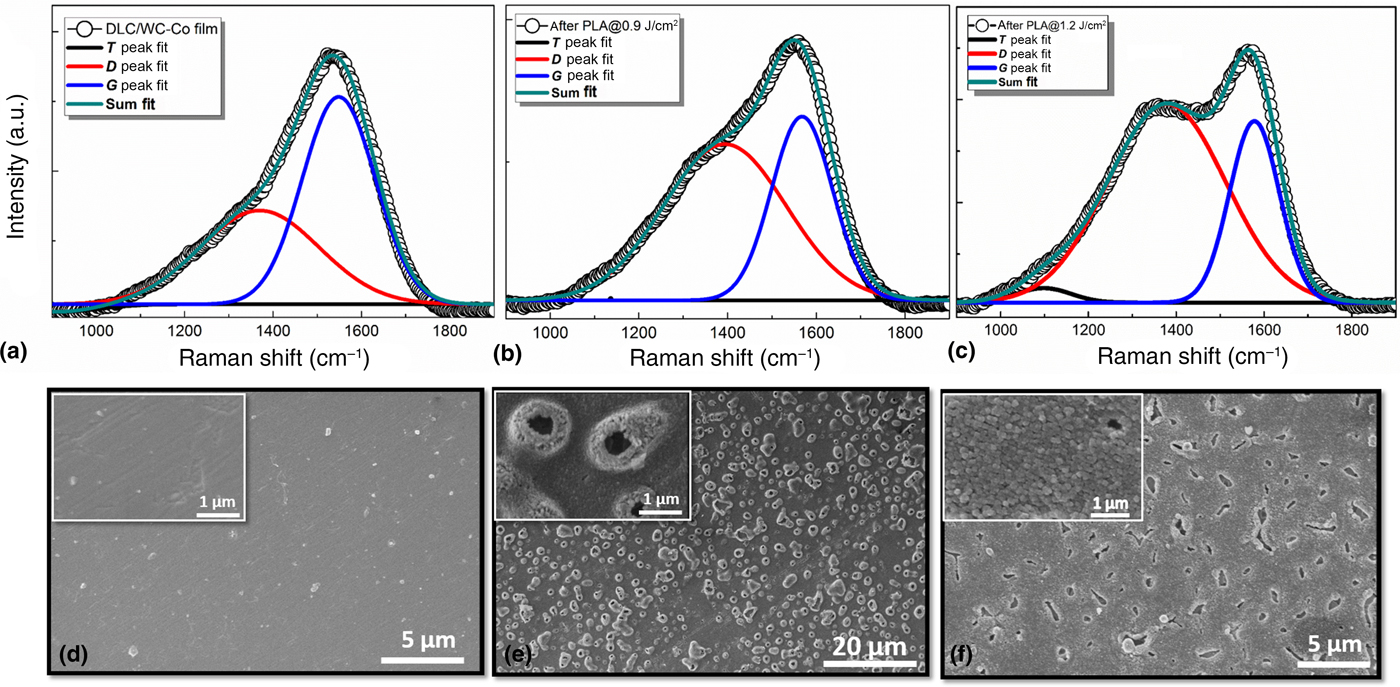
In agreement with Raman spectra, the transformation of DLC films after ns-PLA is visually observed in the SEM images, shown in Figs. 2(d)–2(f). SEM image depicts the smooth surface of non-irradiated (before PLA) film at low and high resolutions. While after PLA, the morphology of the films is drastically changed to show the formation of the clusters. All DLC films homogeneously covered the WC-Co substrates, without peeling off or delamination, even after the PLA.
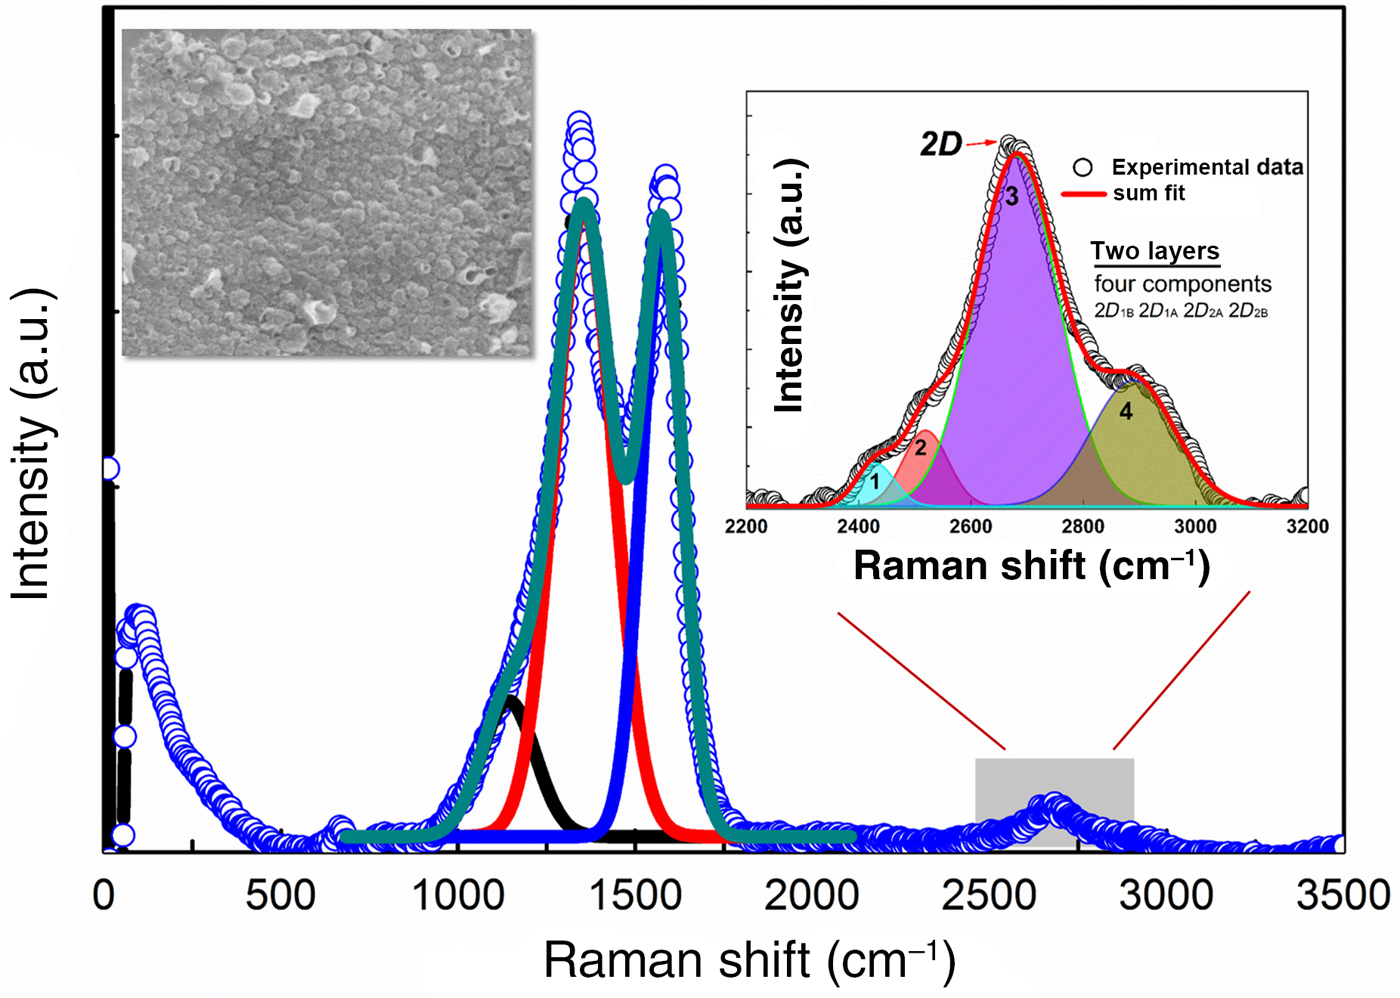
Raman spectrum of irradiated films at 1.7 J/cm2 together with fitting results are shown in Fig. 3. The spectrum exhibited intense D- and G-peaks, 2D peak, and in the inset (upper left side), SEM image shows the dense cluster formation. Commonly, 2D vibrational mode centered at 2698 cm−1 is the second-order overtone of the D-peak, it is the characteristic of double-resonance transitions resulting from the generation of two phonons with opposite momentum (+k and −k) to each other.[Reference Piscanec, Lazzeri, Mauri, Ferrari and Robertson37] The 2D band (2683 cm–1) appearing in the spectra corresponds to the reduced-graphene oxide (rGO) structures formed after annealing at higher laser energy. The inset of Fig. 3 is showing peak fittings of the 2D vibrational mode. It has four components, namely 2D 1B, 2D 1A, 2D 2A, 2D 2B, which indicate the formation of two layers of rGO, in consistent with the Raman spectrum of graphene layers reported by Ferrari et al.[Reference Ferrari, Meyer, Scardaci, Casiraghi, Lazzeri, Mauri, Piscanec, Jiang, Novoselov, Roth and Geim38]
Raman spectrum of DLC/WC-Co film after ns-PLA processed at higher energy density of 1.7 J/cm2. Insets are SEM image and fitting of 2D-peak.

In the rGO thin films, there are several parameters which contribute to the structural and electrical characteristics. Among them, the average size (L D) of sp 2 clusters and the defect density in the 2D system play crucial roles.[Reference Haque, Abdullah-Al Mamun, Taufique, Karnati and Ghosh39] The earlier studies on the rGO films used the I D/I G ratio as an important parameter to calculate the average size (L D) of sp 2 clusters in the rGO structure.[Reference Ferrari, Meyer, Scardaci, Casiraghi, Lazzeri, Mauri, Piscanec, Jiang, Novoselov, Roth and Geim38] The following equation is ideally used to calculate the L D:

where λ L is the wavelength in nm (532.06 nm) of the excitation source for Raman spectroscopy. The same parameter (I D/I G) can also be used to calculate the defect density, n D(cm−2), in the 2D system by using the following equation[Reference Xu, Zhang, Shi, Liu, Wang, Wang and Peng40]:

For PLA (at 1.7 J/cm2)-grown rGO film, the values of the average size of the sp 2 domains and defect density are calculated to be 9.81 nm and 3.37 × 10¹¹, respectively. These values are in consistent with those reported previously for rGO films.[Reference Xu, Zhang, Shi, Liu, Wang, Wang and Peng40,Reference Bhaumik, Haque, Taufique, Karnati, Patel, Nath and Ghosh41] Therefore, the cathodic arc ion plating deposition of DLC and the successive ns-PLA process of the DLC at a higher energy density render high-quality device grade rGO films.
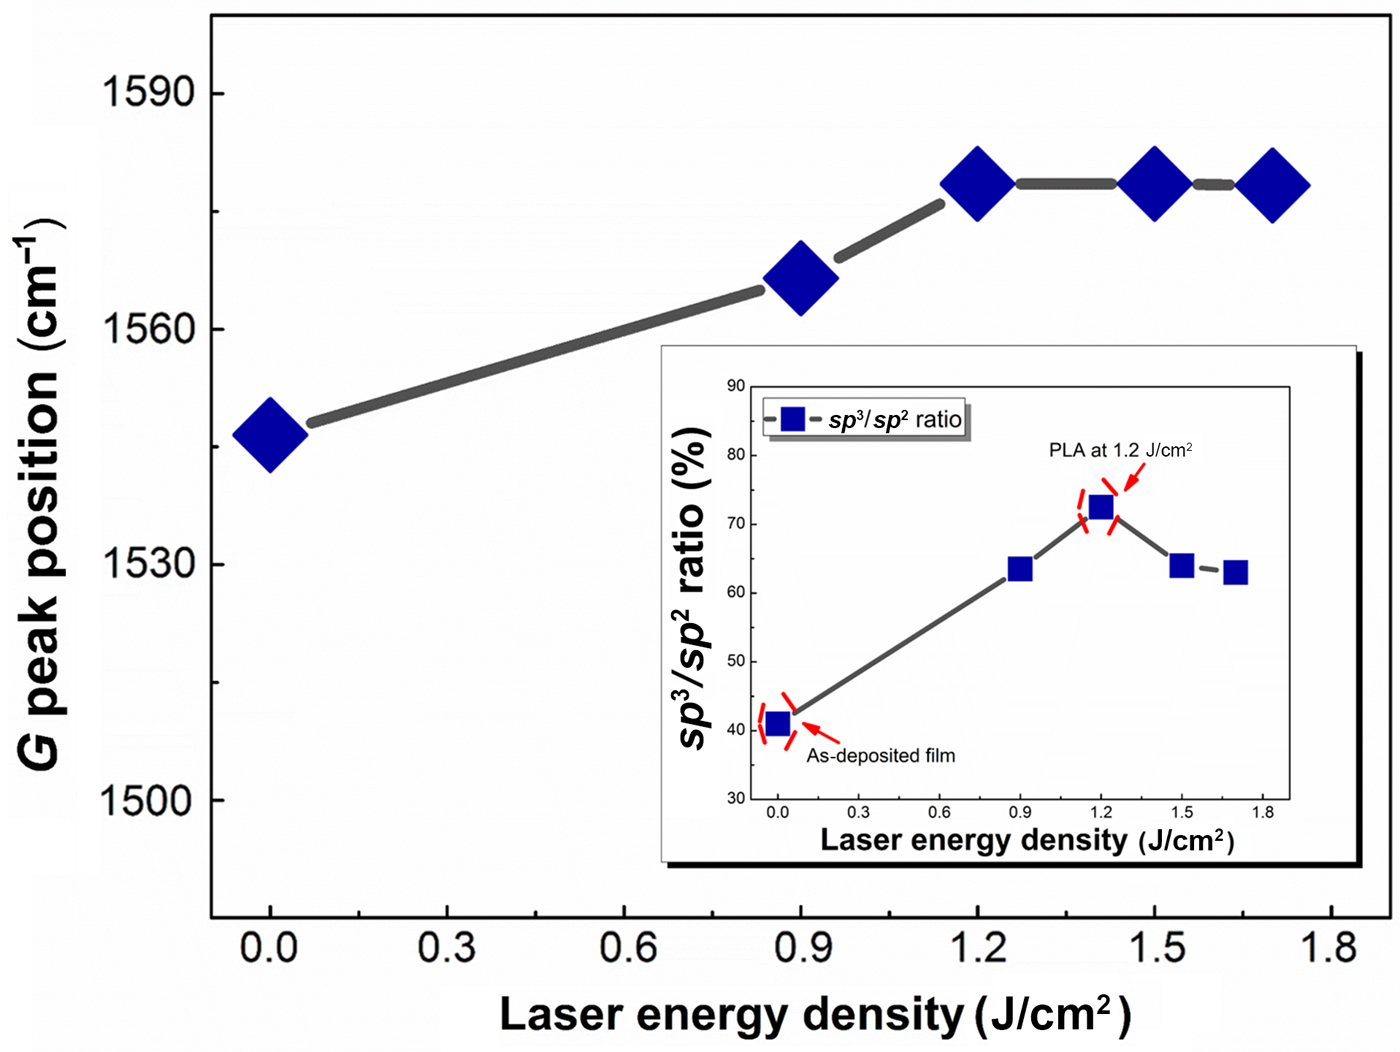
The shift in the G- and D-peaks and the D-peak intensity in Raman spectra of DLC films can provide important information about the film structure, especially related to sp 2 and sp 3 fractions.[Reference Tamor and Vassell42] Figure 4 shows the variation of G-peak positions and the sp 3/sp 2 ratio (in the inset) as a function of laser energy densities. It is observed that the as-deposited film with low sp 3 fraction (40%) has a low G-band frequency of 1547 cm−1, whereas the film (annealed at 1.2 J/cm2) with a high sp 3 fraction (73%) has a high frequency of about 1578 cm−1. These results are in coincidence with the non-hydrogenated amorphous film reported by Anders et al.[Reference Anders, Ager, Pharr, Tsui and Brown34] On the other hand, increasing laser energy density (>1.2 J/cm2) exhibited a decreased sp 3 fraction without any shift in the G-band frequency. Generally, the sp 2 configuration varies consistently with the sp 2 fraction. However, Ferrari and Robertson[Reference Ferrari and Robertson29] reported that the sp 2 configuration can be changed independently from the sp 2/sp 3 ratio called “hysteresis phenomenon.” This phenomenon typically occurs for films those annealed after deposition, which is applicable to our study on DLC/WC-Co films.
The variations of G-peak positions with different laser energy densities extracted from the fitting of acquired Raman spectra. Inset is the sp 3/sp 2 ratio.

Conclusions
This article provides a study of systematic changes in the structure of DLC thin films with a controlled variation in the laser energy density during the PLA process. Hydrogen-free DLC films with the sp 3 content of 40% are deposited on WC-Co substrates using the cathodic arc ion plating method. Nanosecond laser melting and subsequent quenching of the films, as a highly non-equilibrium process, lead to phase transformation of DLC into rGO. High-resolution SEM images visualize the drastic changes in the film morphology from the smooth as-deposited film (before PLA) to the formation of clusters after PLA. Raman investigation of irradiated films shows a blue shift of the G-band frequency accompanied with an increase in sp 3 fraction. At a higher laser energy density, Raman spectrum indicates the presence of D, G, and 2D Raman-active vibrational modes and characteristics of rGO thin films. Two important structural parameters, i.e., the domain size of sp 2 clusters and defect density, of the PLA-grown rGO were also calculated using the parameters extracted from the Raman fitting profiles. Overall, this study on the structural evolution of the laser-annealed DLC and the formation of rGO on the WC-Co substrate have profound scientific importance in the development of nanomaterials coupling WC/rGO as a high-efficient, low-cost electrocatalyst for the hydrogen evolution reaction.
Supplementary material
The supplementary material for this article can be found at https://doi.org/10.1557/mrc.2019.88.
Acknowledgments
This work was supported by the Japan Society for the Promotion of Science (JSPS KAKENHI Grant No. JP15H04127) and Grant-in-Aid for JSPS Fellows (Grant No. JP17F17380). A. Zkria acknowledges Japan Society for Promotion of Science (JSPS), Japan for awarding the JSPS fellowship and supporting visit at North Carolina State University as a visiting scientist. For sample characterizations, we used the Analytical Instrumentation Facility (AIF) at North Carolina State University, which is supported by the State of North Carolina.