1 Introduction
Political scientists are increasingly relying on large-scale public opinion surveys (Heath, Fisher, and Smith Reference Heath, Fisher and Smith2005). These studies provide important insights into how citizens relate to legislators, understand democratic norms, and participate in electoral politics, among other areas of scholarly interest. A central challenge for the researchers who field such surveys is to ensure the quality of the data, particularly when conducting surveys in the developing world (Lupu and Michelitch Reference Lupu and Michelitch2018). Among the most persistent threats to data quality is enumerators deviating from fieldwork protocols. Enumerators may fail to properly screen respondents for eligibility, instead interviewing people who are outside the population of interest. They may also misread or interpret questions, potentially biasing respondents’ answers. Other common problems include enumerators venturing outside the sampling area, recording answers incorrectly, failing to report unsuccessful interview attempts, and falsifying interviews (Montalvo, Seligson, and Zechmeister Reference Montalvo, Seligson and Zechmeister2018).
Observations with deficiencies arising from enumerators’ nonadherence to fieldwork protocols—which we call low-quality data—can limit researchers’ ability to make inferences. These data may bias statistical estimates and understate the uncertainty associated with those estimates (Gomila et al. Reference Gomila, Littman, Blair and Paluck2017; Sarracino and Mikucka Reference Sarracino and Mikucka2017). Further, persistent violations of sampling protocols impede efforts to replicate the data collection process, threatening a foundational principle of rigorous public opinion research. To prevent these problems, scholars have developed a number of tools for assessing interview quality, particularly through Computer-Assisted Personal Interviewing (CAPI), which allows for monitoring quality in real time. Yet there is little evidence as to these methods’ relative effectiveness outside of the single-case studies in which they have been developed and implemented.Footnote 1 Scholars are left with little guidance for preventing low-quality data because the comparative merits of these tools are essentially unknown (Mneimneh et al. Reference Mneimneh, Johnson, Pennell, Stoop and Dorer2018; Robbins Reference Robbins, Johnson, Pennell, Stoop and Dorer2018).
In this paper, we conduct the first (to our knowledge) systematic examination of methods to prevent and eliminate low-quality interviews in large-scale public opinion surveys. Our goal is to identify the most efficacious quality control procedures, so that scholars can focus their resources on those procedures that provide the largest improvements in data quality.
Our empirical strategy relies on three unique features. First, we draw on data collected in nine countries during the 2016/17 round of the AmericasBarometer surveys conducted by the Latin American Public Opinion Project (LAPOP) at Vanderbilt University. LAPOP generously provided us with both the published data and all interviews screened out. These data allow us to observe a binary indicator of interview quality—cancellation versus publication—in a large-scale, cross-national survey that is internationally recognized for its methodological rigor.Footnote 2 Second, LAPOP also provided us with 141 distinct quality control checks conducted on each interview in these data. These checks, described in detail below, include all tools for assessing interview quality in real time of which we are aware.Footnote 3 These data allow us to directly compare procedures discussed widely in the literature (e.g., recording audio and checking for anomalous response patterns), as well as some unique to the AmericasBarometer, on a common sample. Finally, we conduct a large classification task to identify the tools which are most informative for identifying low-quality data, using standard variable importance metrics.Footnote 4 By measuring each check’s ability to predict low-quality interviews relative to other available quality control metrics, we are able to identify the most powerful tools for ensuring surveys do not suffer from the problems associated with inconsistent or inadequate enumeration.
We find that light manual auditing of random audio recordings, an interview timer, and a few metrics easily calculable from the data (such as completion percentage and Percentmatch; Kuriakose and Robbins Reference Kuriakose and Robbins2016) are together sufficient to recover a sample nearly identical to that produced by a full suite of checks. Together, these 30 quality control procedures produce very similar—and in some ways better—results than a full suite of tools. More specifically, the average root mean squared error (RMSE) of prediction for models with these variables is seven percentage points, compared to four percentage points for models estimated with all 141 available checks.Footnote 5 In other words, using a full suite of 141 variables for evaluating interview quality, we typically assign a  $96\%$ probability of being low-quality to interviews that LAPOP canceled, and a
 $4\%$ probability to those that LAPOP did not. A quality control system pared down to just thirty variables produces predictions of
 $93\%$ and
 $7\%$, respectively. For most researchers, these differences will be imperceptible in practice.
To evaluate whether our findings should be taken as an exact method to replicate or as general guidance, we then examine how well these quality control procedures travel across time and space. After training our models on each country in our data separately, we compare within- to across-country fit. Our results show that quality control procedures are slightly less effective when imported wholesale from another context, producing predictions that are approximately  $16\%$ less accurate, but are still useful for efficiently identifying low-quality interviews. Finally, we draw on data from the 2018/19 round of the AmericasBarometer to demonstrate that procedures from one survey round are nearly equally effective the following round. These results indicate that the procedures we identify are informative broadly, but can and should be tweaked according to context.
Taken as a whole, our estimates suggest that scholars can effectively diagnose problems of interview quality with just a few quality control procedures.Footnote 6 Our findings provide an emphatic answer to recent calls for more rigorous research into identifying and preventing problems stemming from low-quality data (e.g., Lupu and Michelitch Reference Lupu and Michelitch2018). By helping public opinion researchers choose a suite of methods to efficiently diagnose low interview quality,Footnote 7 we hope to empower researchers to improve the quality of their data, and thus the reliability of the inferences that can be drawn from survey research in political science.
2 Strategies for Preventing Low-Quality Interviews
Since the advent of polling, survey researchers have been concerned with the problem of enumerator “cheating” (Crespi Reference Crespi1945), and particularly “curbstoning,” the wholesale fabrication of interviews. Scholars have developed a variety of methods to detect fake interviews. Early strategies include asking enumerators to sign statements affirming that they correctly followed protocols (Bennett Reference Bennett1948). Perhaps the most effective, and most expensive, strategy for assuring data quality is the “callback,” where fieldwork supervisors conduct partial re-interviews with participants to verify their participation (Biemer and Stokes Reference Biemer and Stokes1989; Schäfer et al. Reference Schäfer, Schräpler, Müller and Wagner2004; Stokes and Jones Reference Stokes and Jones1989; Swanson, Cho, and Eltinge Reference Swanson, Cho and Eltinge2003; Winker Reference Winker2016). More recently, researchers have introduced checks for interview duplication and straightlining, wherein enumerators or staff at survey firms generate fraudulent interviews by filling out identical answers across a battery of questions (Blasius Reference Blasius and Thiessen2018; Blasius and Thiessen Reference Blasius and Thiessen2012, Reference Blasius and Thiessen2015, Reference Blasius and Thiessen2018; Simmons et al. Reference Simmons, Mercer, Schwarzer and Kennedy2016; Slomczynski, Powalko, and Krauze Reference Slomczynski, Powalko and Krauze2017).
Rapid expansion in the use of hand-held electronic devices for survey enumeration has created new opportunities to detect cheating. Researchers who conduct face-to-face surveys integrate CAPI methods to capture detailed metadata about each interview. These metadata are then processed to identify violations of fieldwork protocols (Seligson and Moreno Morales Reference Seligson, Morales, Atkeson and Alvarez2015). Among methods using such metadata, most common are those that rely on Geographic Positioning System (GPS) data: researchers unobtrusively capture GPS coordinates, documenting the precise location in which an interview was conducted (Bhuiyan and Lackie Reference Bhuiyan and Lackie2016; Montalvo et al. Reference Montalvo, Seligson and Zechmeister2018; Vanden Eng et al. Reference Eng2007). Such methods quickly identify interviews conducted outside the assigned area of enumeration. A more involved method relies on silent audio recordings of enumerators’ work, allowing researchers to audit interviews to ensure they reflect answers given by a real respondent (Gomila et al. Reference Gomila, Littman, Blair and Paluck2017; Hicks et al. Reference Hicks, Edwards, Tourangeau, McBride, Harris-Kojetin and Moss2010; Mitchell, Fahrney, and Strobl Reference Mitchell, Fahrney and Strobl2009).
These innovative quality control procedures have a decided advantage over their prede-cessors: they enable researchers to identify and resolve problems in semi-real time—just a few hours or days after the interview is conducted. By uncovering potentially serious errors so quickly, survey firms can replace substandard interviews at relatively low cost, since enumerators are likely to still be in the field. Methods for detecting fraud that rely on patterns observable only in a complete sample (e.g., stereotypical response patterns in partially falsified interviews; Landrock Reference Landrock2017; Menold and Kemper Reference Menold and Kemper2014) may uncover serious problems that are much costlier to fix ex post.Footnote 8 Given the challenges of sending enumerators back into the field in a second wave to address earlier mistakes, researchers may decide not to correct these problems, resulting in a smaller or lower-quality sample than originally designed.
However, these methods pose their own challenges. They incur nontrivial time and overhead costs, since interview metadata must be audited continuously while fieldwork is ongoing. Recent studies have introduced statistical and computational techniques to ease this burden, typically by imposing distributional assumptions on the metadata and automatically identifying interviews which are anomalous under those assumptions. For instance, researchers can analyze incoming interviews for too little missingness: long survey instruments are unlikely to be consistently 100% complete, so scripts can automatically compute completion percentages as interviews arrive from the field and quickly flag those that have suspiciously few missing answers (Bredl, Winker, and Kötschau Reference Bredl, Winker and Kötschau2008; Murphy et al. Reference Murphy, Baxter, Eyerman, Cunningham and Kennet2004; Turner et al. Reference Turner, Gribbe, Al-Tayyip and Chromy2002). Another group of widely used automated methods are algorithms such as Percentmatch, which detect near-duplicate interviews and flag them as likely to be fraudulent in semi-real time (Kuriakose and Robbins Reference Kuriakose and Robbins2016). Abnormal participation rates and interview duration, among other patterns in the raw data and metadata, can similarly be mined for clues about data fabrication (Birnbaum et al. Reference Birnbaum, DeRenzi, Flaxman and Lesh2012; Blasius Reference Blasius2018; Blasius andThiessen Reference Blasius and Thiessen2012, Reference Blasius and Thiessen2018; Bredl, Storfinger, and Menold Reference Bredl, Storfinger and Menold2011; Murphy et al. Reference Murphy, Baxter, Eyerman, Cunningham and Kennet2004).
In addition to detecting outright fraud, scholars have deployed audit-based and automated methods for identifying genuine but low-quality interviews. While curbstoning is an obvious and evocative problem, smaller, unintentional deviations from fieldwork protocols may be a greater problem for total survey error (TSE; Biemer and Lyberg Reference Biemer and Lyberg2003). For example, silent audio captures can be used to correct fieldwork mistakes and retrain enumerators, improving overall data quality (Bhuiyan and Lackie Reference Bhuiyan and Lackie2016).Footnote 9 Passing even minimal information back to enumerators—for example, only whether their interviews had been accepted or rejected on quality grounds—can be sufficient to improve data quality across the duration of a project (Gomila et al. Reference Gomila, Littman, Blair and Paluck2017). Enumerators may even hew more closely to fieldwork protocols based solely on the knowledge that an auditor may be listening (Mitchell, Fahrney, and Strobl Reference Mitchell, Fahrney and Strobl2009).
Taken as a whole, these studies provide survey researchers with a large suite of tools to weed out low-quality data arising from fraud and enumerator error. Manual duplication checks, respondent re-contacting, GPS and audio auditing, and automated metadata parsing can identify enumerator deviations from fieldwork protocols. Yet a key challenge remains for survey researchers who wish to prevent low-quality interviews from creeping into their data: lack of evidence as to the relative merits of these tools.
In an ideal world, every survey would include a lengthy battery of quality control procedures. In reality, however, implementing these tools requires time and money, and survey researchers are typically extremely short on both. Faced with these resource constraints, they may wish instead to employ a narrower, more streamlined range of quality control checks. Yet the evidence for which tools are most efficient is scant, with very little scholarly research testing, validating, and assessing the generalizability of these checks.Footnote 10 Even studies that introduce innovative quality control procedures typically test them informally, and in isolation (Bhuiyan and Lackie Reference Bhuiyan and Lackie2016; Finn and Ranchhod Reference Finn and Ranchhod2017; Gomila et al. Reference Gomila, Littman, Blair and Paluck2017; Mitchell et al. Reference Mitchell, Fahrney and Strobl2009). There are good reasons for this lacuna: quality control checks are often proprietary, and there are few survey projects that can facilitate such a broad study. Nevertheless, without any aggregation of knowledge about these tools, researchers are left with little guidance on how to mobilize their resources efficiently. Scholars need to know each quality control procedure’s contribution to reducing TSE, and its ability to complement other tools as part of a broader quality control package, in order to ensure a high-quality sample.
3 Quality Control in the 2016/17 AmericasBarometer
We address this problem by documenting a suite of 141 quality control procedures used in the 2016/17 round of the AmericasBarometer, and evaluating them with a large classification task. These data, shared with us by the Latin American Public Opinion Project, are unique for two reasons: they comprise a nearly-identical instrument across a large cross-national sample, and they include every quality control procedure of which we are aware.
The 2016/17 AmericasBarometer study’s quality control system consisted principally of three levels, each of which provided an opportunity to cancel an interview deemed low-quality. Survey teams in each country used trained auditors to listen to audio recordings captured during each interview. Next, auditors employed by third-party firms or in LAPOP’s central office ran spot checks such as reviewing interview logs and verifying the field team’s auditing. Finally, a staff member at LAPOP’s central office ran weekly (and sometimes daily) checks of interview metadata. While auditors were able to review survey and metadata, they were not able to edit survey responses, which were uploaded to a remote server when mobile telephone service was available.Footnote 11 Additionally, LAPOP conducted extensive enumerator training ahead of fieldwork to both reduce enumerator cheating and increase the overall quality of data collected.Footnote 12 We note that although interviews were removed from the final dataset at different points in this process, by different actors, and using different information about quality, our analysis includes all quality control procedures for all interviews: even if an interview is canceled at one level, we are still able to evaluate whether checks at other levels would have flagged it as being potentially low-quality.
Our sample consists of every interview uploaded to LAPOP’s primary software for CAPI interviews in 2016/17 (SurveyToGo, or STG), from countries where all quality control checks are available (Cohen and Larrea Reference Cohen and Larrea2018).Footnote 13 The data consist of 13,253 interviews across Argentina, Bolivia, Chile, Guatemala, Haiti, Jamaica, Mexico, Peru, and Uruguay, gathered between January 28 and June 2, 2017. In our sample, 933 observations (7%) were coded as 1 for canceled, with the remaining 12,320 coded 0 for published. This binary indicator is our outcome of interest.
We then matched these interviews to all metadata collected for the 2016/17 round. These include some 150,000 audio recordings and image captures. We also obtained the logs automatically generated by STG, which record the button presses taken by enumerators during each interview, as well as silent actions such as GPS captures.Footnote 14 For our covariates of interest, we used these data to code 141 distinct quality control variables, one for each procedure used to decide whether interviews are acceptable for publication in the AmericasBarometer. Full descriptions and coding rules for each variable are provided in the Appendix.
Broadly, these checks fall into three groups. First are 12 automatic flags in STG which screen interviews in real time.Footnote 15 These include, for instance, whether the enumerator’s username was different from that of the person who uploaded the interview to the server—which can indicate that an interview was started, stopped, and then restarted later by a different enumerator, in violation of fieldwork protocols. Second are 65 variables generated by automatic parsing of metadata from audio, photo, GPS, and log captures in R. These scripts evaluate interview quality in semi-real time, as they are run daily or weekly as data come in from the field. Such checks include inter alia: measures of cluster size and dispersion, to ascertain if the AmericasBarometer sampling procedure is being followed; Percentmatch;Footnote 16 average question timings, to detect when enumerators skip items; whether devices are in airplane mode, to see when enumerators attempt to conceal their location; and GPS captures. The third group includes 64 checks coded manually by the auditors discussed above. These include information about such items as careful reading of the consent form, enumerators skipping or interpreting questions, interviews being conducted in an inappropriate location such as a cafe, the presence of enumerators who were not hired to work on the project, or evidence that the enumerator is otherwise not following fieldwork protocols.Footnote 17
4 Evaluating Quality Control with Machine Learning
Our primary goal is to rigorously evaluate which quality control procedures are most useful for identifying low-quality interviews. Variables that best separate high- and low-quality interviews are considered the most informative, and therefore the most valuable to survey researchers. These quantities—variable importance metrics—are key quantities produced by machine learning (ML), the science of learning patterns from data. We therefore study a supervised ML classification task in which a series of models separate interviews into canceled and published categories, using the 141 covariates drawn from the AmericasBarometer quality control procedures. All analysis is conducted using the caret package in R (Kuhn Reference Kuhn2008; Kuhn and Johnson Reference Kuhn and Johnson2013),Footnote 18 which provides a streamlined set of functions to study predictive models implemented across a wide array of machine learning packages.
More specifically, we partition our final sample into training and validation sets, comprising  $75\%$ and
 $25\%$ of the data, respectively.Footnote 19 These sets preserve the marginal distributions of the outcome and all predictors. We then iterate through 36 models drawn from a variety of ML algorithms, including discriminant analysis, neural networks, random forests, generalized linear models, and others, listed in the Appendix. Because our data are unbalanced, with the majority of observed outcomes being 0s, each model run begins by using the synthetic minority oversampling technique to achieve better balance (SMOTE; Chawla et al. Reference Chawla, Bowyer, Hall and Kegelmeyer2002). We train each model using fivefold cross-validation, repeated five times, using the same resampling indices across models. Each model’s optimal hyperparameters are chosen by maximizing the area under the curve (AUC) across receiver operating characteristics, a widely used measure of classification accuracy, as computed during cross-validation. These optimal models are then fit to the training sample as a whole, variable importance summaries are computed, and the fitted models are used to predict outcomes on the validation sample which was held out from model training. We focus on interpreting results from the ten best-performing models due to space constraints, but the results are consistent across models.Footnote 20
We are interested in two sets of quantities. The first are measures of variable importance, which indicate how useful each quality control check is for predicting interview quality. Variable importance effectively measures the information provided to the model by an individual variable, and is a commonly used metric across disciplines (e.g., Hill and Jones Reference Hill and Jones2014). Each model computes variable importance differently,Footnote 21 but scales all 141 variables according to how useful they are for prediction, such that the most informative procedures are scored as 100 and completely uninformative procedures are scored as 0. Given the dearth of evidence comparing quality control procedures’ efficacy, we do not have strong expectations about which tools will be most important for classifying interviews.
The second set of quantities of interest are measures of predictive performance: how well quality control methods collectively screen out low-quality interviews. Good predictions would indicate that standard quality control procedures are effective for recovering the AmericasBarometer sample, regarded highly for its quality; bad predictions would indicate that they are ineffective, producing inconsistent information and leaving LAPOP heavily reliant on staff discretion in choosing to publish or cancel interviews.
To be clear, this modeling strategy does not assume that the AmericasBarometer sample is perfect, with publication and cancellation perfectly capturing high- and low-quality interviews, respectively. Instead, interview quality is better conceptualized as a latent variable generated by numerous factors, including, for instance, the survey instrument itself, sample design, enumerator adherence to fieldwork protocols, and respondent effort (e.g., Krosnick Reference Krosnick1999). Yet as a “ground truth” for our classification task, this latent variable is essentially impossible to observe and measure, so we instead rely on publication versus cancellation in the AmericasBarometer as a reasonable approximation of overall quality.
Nor does this modeling strategy prime favorable results. Scholars may be concerned that because LAPOP makes cancellation decisions using the quality control checks we study, there may a deterministic link between these variables and the outcome of interest—necessarily yielding high predictive performance. However, a number of factors break this simple dependence. For one, because LAPOP allows enumerators to respond to conditions in the field, the team leaves considerable room for auditor discretion in deciding whether to publish an interview. Further, at no stage in the quality control workflow does any individual have access to the full suite of quality control checks; as discussed above, there are multiple points in the review process at which an interview may be rejected. These decisions to cancel or publish an interview are often made with less than ten variables on hand. Finally, many of the quality control checks we study were implemented after fieldwork was completed, that is, after all decisions to cancel or publish interviews were made. For example, the measure of geographic dispersion within sampling clusters was developed and implemented after the entire round was complete. In short, the structure of (and continual improvements to) LAPOP’s workflow breaks any simple correspondence between quality control procedures and cancellation decisions.
5 Which Procedures are Most Useful?
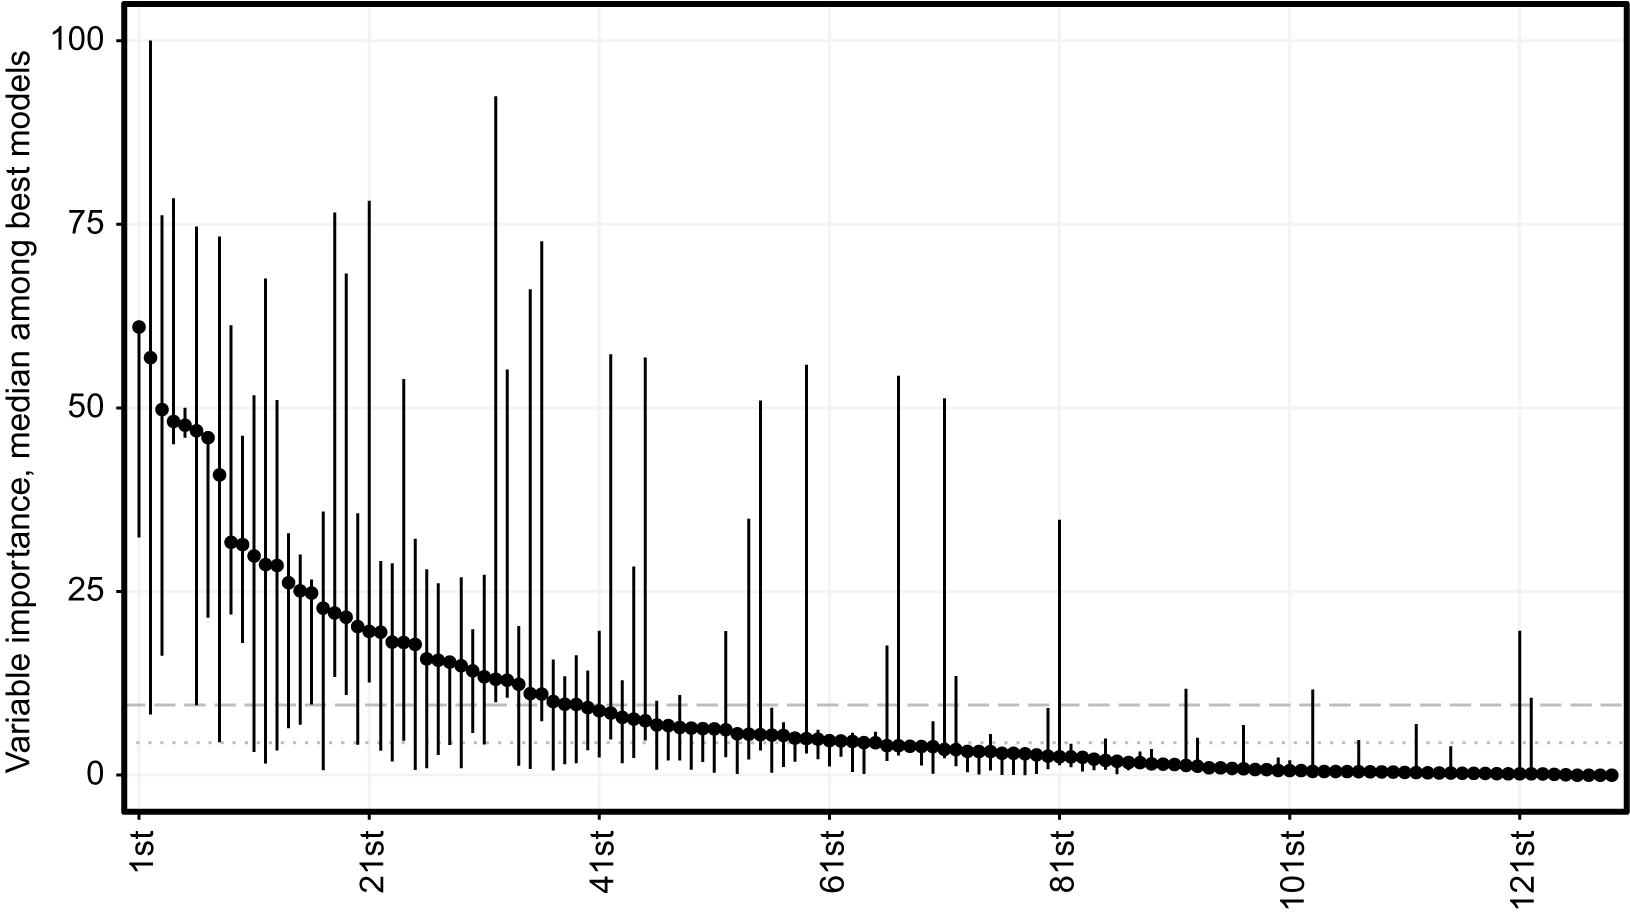
Our main goal is to identify which tools are most useful for recovering a high-quality sample. To answer this question, Figure 1 plots variable importance for each of the 141 procedures. Dots represent median values, and segments the interquartile range, across the ten best models (those with highest AUCs).
Variable importance for all quality control procedures across the ten best-performing models. Each dot represents a procedure’s median variable importance (y-axis), ranked along the x-axis. Larger values indicate methods that provide more information for distinguishing high- and low-quality interviews. Segments represent the interquartile range for each variable across the ten models. The dashed (dotted) line indicates mean (median) variable importance. The long tail of the low-importance predictors indicates that many quality control checks provide very little added value.

The results indicate that many procedures are essentially superfluous. Beyond the approximately 30 top performers, additional methods for detecting low-quality interviews add very little new information. This finding may be intuitive, since many of the procedures we study are close correlates of each other. For example, given automated variables that calculate each interview’s completion percentage and duration, it is unclear how much further information another variable to compute the average time spent on each question will add. However, at the same time, many of the “poor performers” would appear to add new information not otherwise captured by the more informative variables. For instance, a script which identifies large jumps in geolocation between attempted interviews does not provide much information to these models.
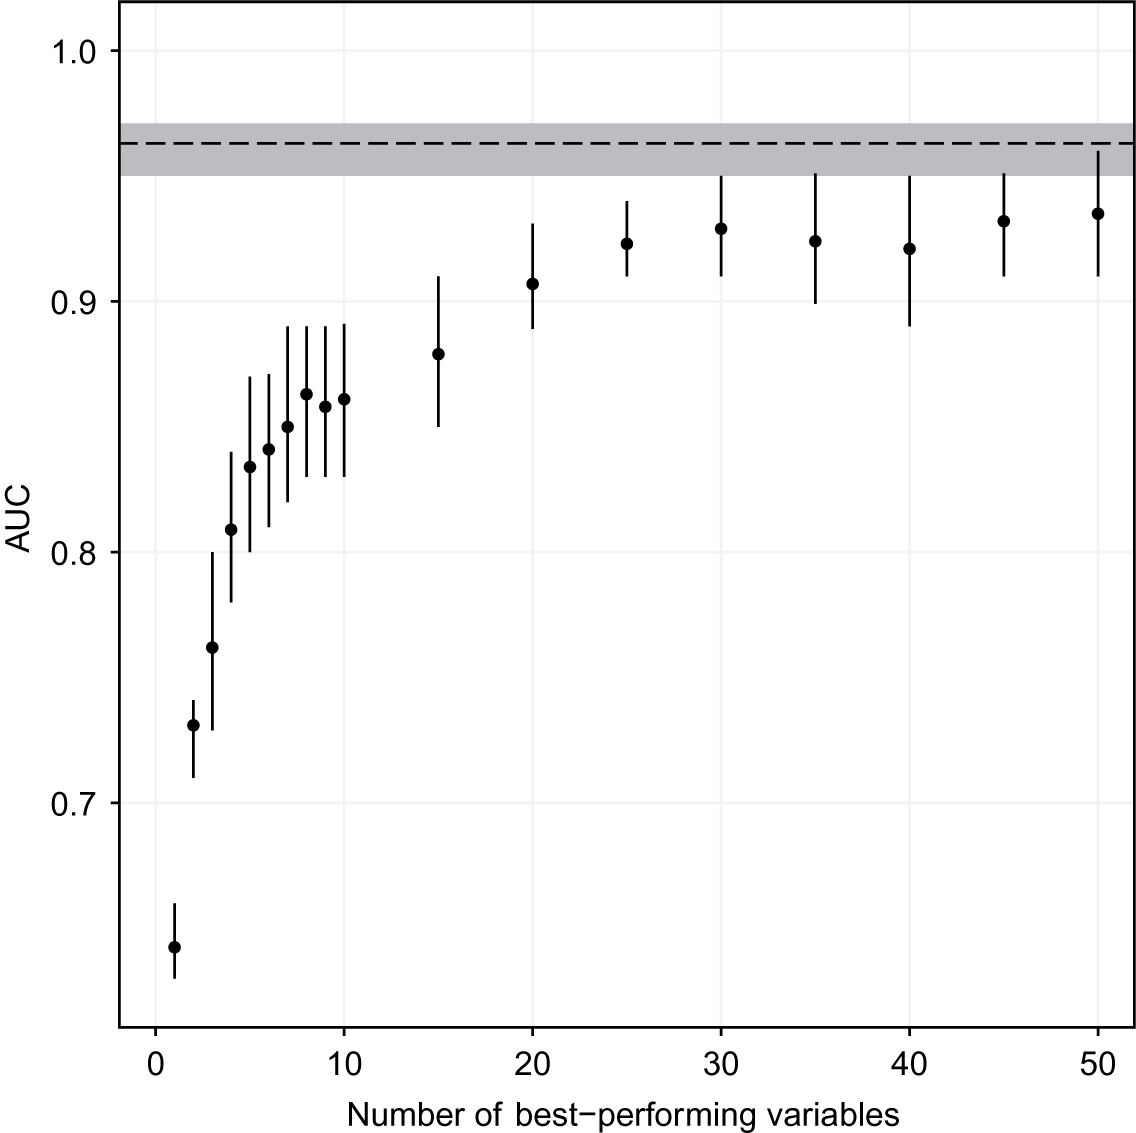
To analyze this finding more closely, we estimate the precise threshold at which a minimal set of quality control procedures performs as well as the full suite of 141 tools. Figure 2 plots the mean out-of-sample AUC across the same ten models using only the top n variables, where n is each integer from one to ten, and then incremented by five from ten to 50. As the Figure indicates, implementing additional quality control procedures quickly runs into diminishing marginal returns: the AUCs of the model fit to  $n=30$ variables is indistinguishable from that fit to all 141; adding further procedures yields very little increase in predictive performance.
Predictive performance by number of quality control procedures. Each dot represents the mean out-of-sample AUC for the ten best-performing models, with lines for the interquartile range. The dashed line (gray box) is the mean AUC (interquartile range) among the best-performing models using all 141 procedures. These results indicate that very little information is added after the top 30 variables.

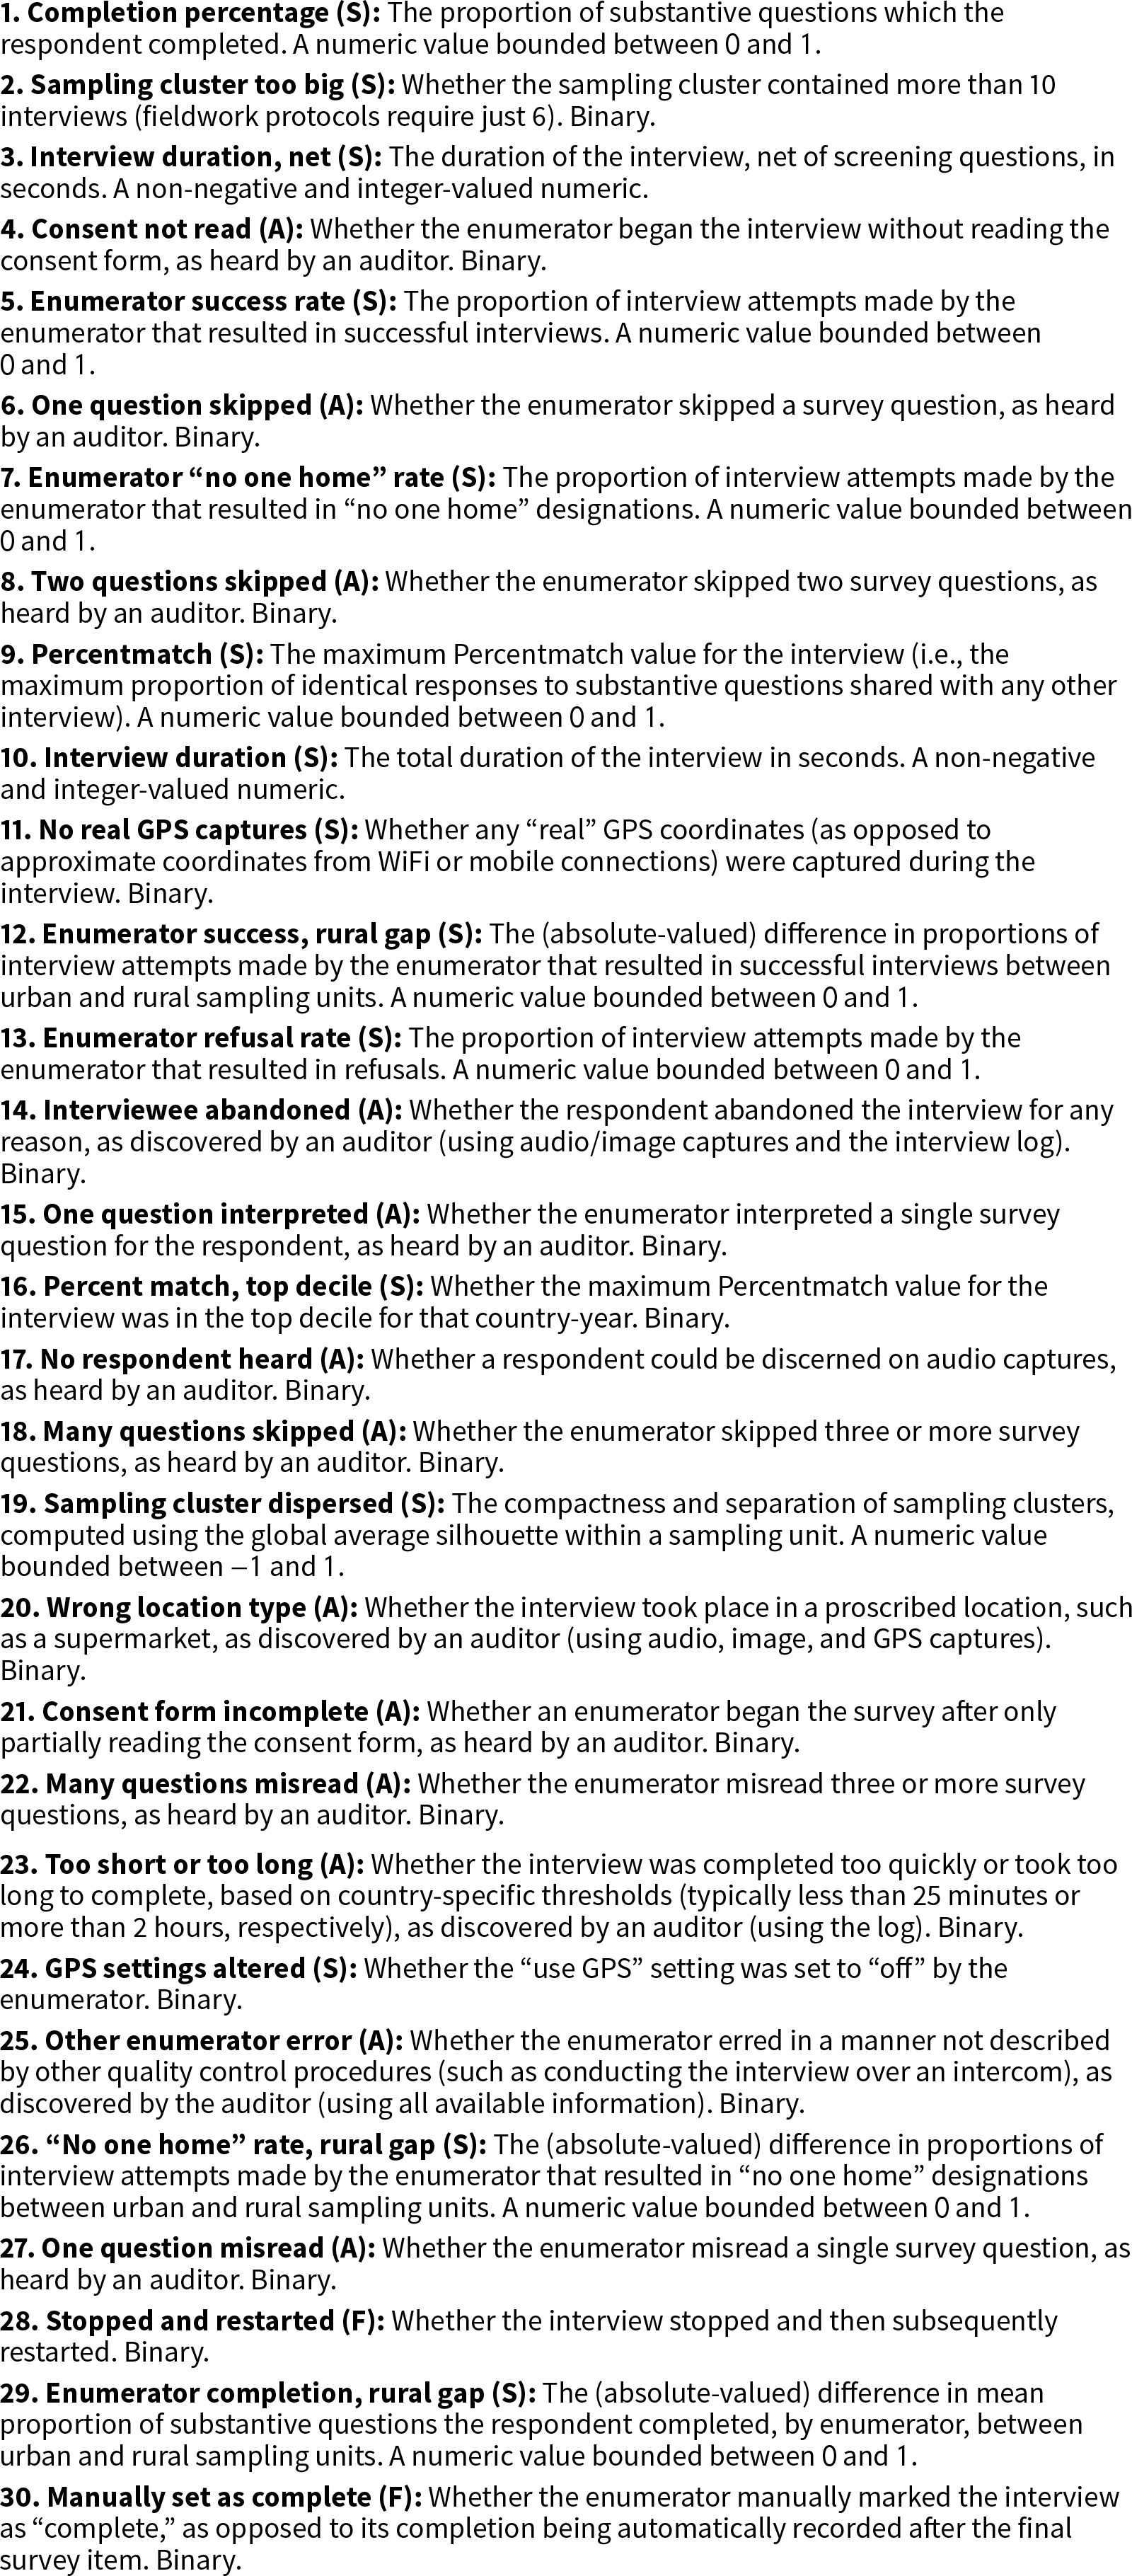
Table 1 lists these 30 procedures—the smallest subset that perform just as well as the full suite of 141 tools. Two examples help illuminate the nature of these procedures. “Consent not read (A)” is manually coded by auditors listening to recordings of the interview. An interview is coded as a 1 if the enumerator fails to read any of the study information and consent form, and 0 otherwise. (Separate variables are used to record enumerators reading the consent form incompletely or incorrectly.) Because obtaining informed consent of interviewees is critical to conducting survey research, failure to read the consent form corresponds to automatic cancellation of an interview. In contrast, “enumerator success rate (S)” is constructed by parsing interview metadata in R. More specifically, LAPOP sums the number of interview attempts recorded by each individual enumerator, as well as the number of interviews he or she uploaded to STG. Enumerator success rate is then just the enumerator-specific proportion of attempts that resulted in interviews. Because there is no automatic cancellation rule regarding enumerator success rate, the informativeness of this procedure may reflect that enumerators who cut corners on recording failed attempts are more likely cut corners administering the survey instrument, producing lower-quality interviews.
The most informative quality control procedures.

Variables are ordered according to their median variable importance as computed from the ten best-performing models. Letters in parentheses indicate whether the source of the information is an auditor check (A), STG flag (F), or R script (S). See the Appendix for details of all variables.
Broadly, Table 1 suggests that researchers should start by investing in the development of automated scripts to look for basic problems with required attachments (such as enumerator photos and GPS data); sample quota adherence (sampling cluster size and dispersion); enumerators failing to log unsuccessful attempts and incomplete interviews (e.g., interview success rates, refusal rates, and completion percentages); and complete or partial duplication (Percentmatch). Among the checks auditors should carry out, we suggest listening for the consent of the interviewee, as well as random spot-checks to identify questions the enumerator may have skipped, misread, or interpreted.
Two further findings stick out among the interesting patterns that emerge. The first is that the most informative variables are a mix of those generated by flags, scripts, and auditors. That is, we find that no one approach to quality control is itself sufficient to ensure a high-quality sample, in line with anecdotal evidence. Effective quality control requires multiple passes at the data, taken in real and semi-real time. The consistency and speed of automated metadata parsing must be paired with the flexibility of auditor discretion (and ingenuity in identifying new problems as they arise) in order to get high-quality data.
The second notable pattern is that the most informative variables are observed at different levels of analysis. Items like “no respondent heard” or “interviewee abandoned” are observed for each interview. On the other hand, “enumerator success rate” (the percent of attempts that result in interviews, by enumerator) is observed at the enumerator level. “Sampling cluster too big” is observed at each sampling cluster. And “Percentmatch” is observed across the entire sample. This finding provides clear evidence that interview quality is a function of multiple data-generating processes—not just enumerator fraud or error. Only by using an array of quality control procedures can researchers account for these complex causal pathways producing low-quality data.
We emphasize that Table 1 provides the list of procedures that provide the largest marginal benefit for predicting low-quality interviews, but it does not say anything about their marginal costs. Some of the variables in this Table will surely be costly to implement, such as manually checking audio recordings for enumerators deliberately omitting questions (e.g., “one question skipped”). However, the costs of implementing these procedures vary so widely by context and organization that we cannot provide an estimate of each variable’s cost-effectiveness. For instance, hiring auditors may be relatively cheap in Latin America but expensive in Western Europe. Similarly, a survey research organization with deep expertise in statistical programming might cheaply implement a measure of geographic dispersion within a cluster of interviews (“sampling cluster dispersed”), but another might have to hire an expensive contractor to write the same code. We recommend that survey researchers develop cost estimates specific to their project, and then use the worksheet provided in the supplementary materials to decide how to allocate resources most cost-effectively.
6 A More Efficient Quality Control System
Our results so far suggest that sample quality does not substantially degrade if a more limited suite of quality control checks is used instead of the full suite of 141 checks. To measure the size of this decline, we re-estimate the ten best-performing models using just 30 procedures. Results from these models are compared to those using all 141 procedures in the Appendix.
The results suggest that limiting the number of quality control procedures may lead to somewhat worse overall performance: on average, these models have lower AUCs and larger RMSEs. However, this decline is relatively small, and predictive power still remains very good: the AUC is above  $0.90$ and the RMSE is below
 $0.10$ for all ten models. Further, four of the models are actually better at predicting cancellations with fewer variables, producing higher recall rates than those generated by models using the full suite of quality control procedures.Footnote 22 That is, relative to models with 141 variables, these 30-variable models correctly identify more true cancellations and let through fewer interviews that were eventually canceled. Finally, for all models, decreased predictive power is driven by more false positives, evidenced by substantially lower precision (between
 $0.05$ and
 $0.28$ lower compared to the models with the full range of available checks). Yet in practical terms, this cost is slight: in our data, these models produce some 100 more interviews flagged for cancellation that were ultimately published, relative to the predictions from models fit on all 141 procedures, out of the 3,313 in the validation set. Researchers may even prefer this conservatism, accepting more false positives to ensure that no low-quality data slips into the published sample.
A closer look at the interviews misclassified by these models provides further evidence that these procedures are sufficient to recover a high-quality sample. We randomly sampled 24 of the 158 misclassified cases and conducted a re-audit of each, where the experienced auditor conducting the review was blind to both the real and predicted decision to cancel or publish the interview. Among this re-audited sample, we found no evidence of any systematic patterns that would suggest these quality control procedures are failing to identify a particular type of low-quality interview.
Further, among exactly half of these re-audited interviews, we found that the misclassification was not due to errors with the models’ predictions: in 12 of these 24 interviews, the re-audit upheld the model’s prediction and overturned the initial decision.Footnote 23 In the other 12 interviews, the models’ prediction was wrong and the initial decision was upheld. Although this sample is relatively small, the qualitative evidence suggests that these misclassified cases reflect statistical noise inherent to probabilistic models—noise which appears equal to that of the complete quality control process used by LAPOP. Overall, the re-audit suggests that limiting ourselves to just these 30 covariates does not add in any error, systematic or otherwise, over a full quality control suite.
7 Quality Control Across Space and Time
Researchers may be concerned that quality control procedures which are useful in one context are less useful in another. To examine this possibility, we conduct two additional exercises. We first test whether models estimated using data from just one country in the 2016/17 AmericasBarometer can accurately predict interview cancellation among the other countries in our sample. To do so, we split our data by country, train our models on each country individually, and then predict outcomes in all of the other countries (as well as a hold-out sample within-country). If predictive power remains high, then scholars can be confident that lessons from one survey generalize—that they can import procedures which are effective in one context to another.
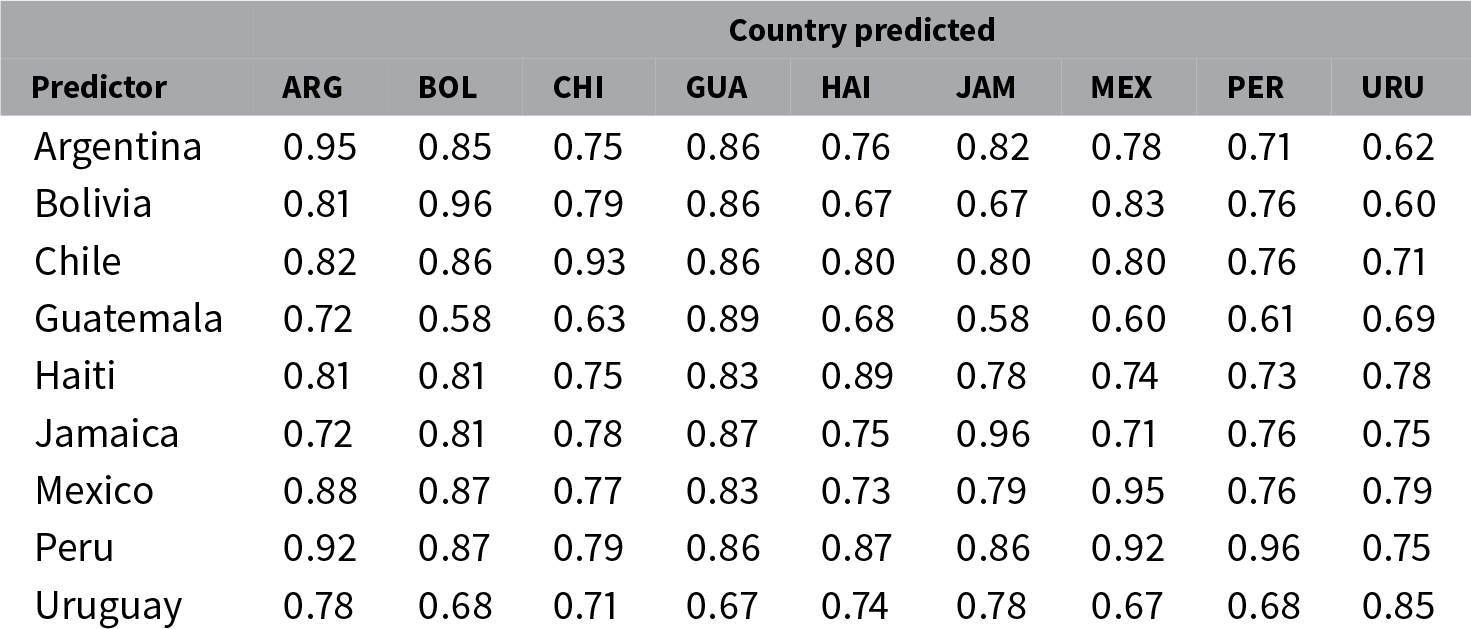
Table 2 provides the results of these predictions. In general, the results suggest that importing quality control procedures directly from one country to another can work, but depends on the samples involved. For instance, our data from Haiti are all drawn from LAPOP’s oversample of the capital city; it is therefore unsurprising that models from other countries perform worse on this smaller, more urban subset of Haitians. The mean AUC drops to  $0.78$. Taken as a whole, these results indicate that scholars should use Table 1 as a guide to implementing procedures which are known to be informative across a broad sample—and not as an exact blueprint to replicate.
Predictive performance across countries.

Each value is the mean area under the curve (AUC) across the ten best-performing models. Rows refer to countries used to fit the models, while columns provide the countries which these model fits are used to predict. The diagonal provides within-country predictions using a 25% validation sample.
For our second test of the generalizability of our findings, we obtained early access data from the 2018/19 round of the AmericasBarometer in Argentina. LAPOP again generously provided us with the logs, attachments, and other metadata with which to compute the same full suite of quality control variables as with the 2016/17 sample. We train a model using only our 2016/17 data from Argentina, and then predict cancellations in the 2018/2019 sample.
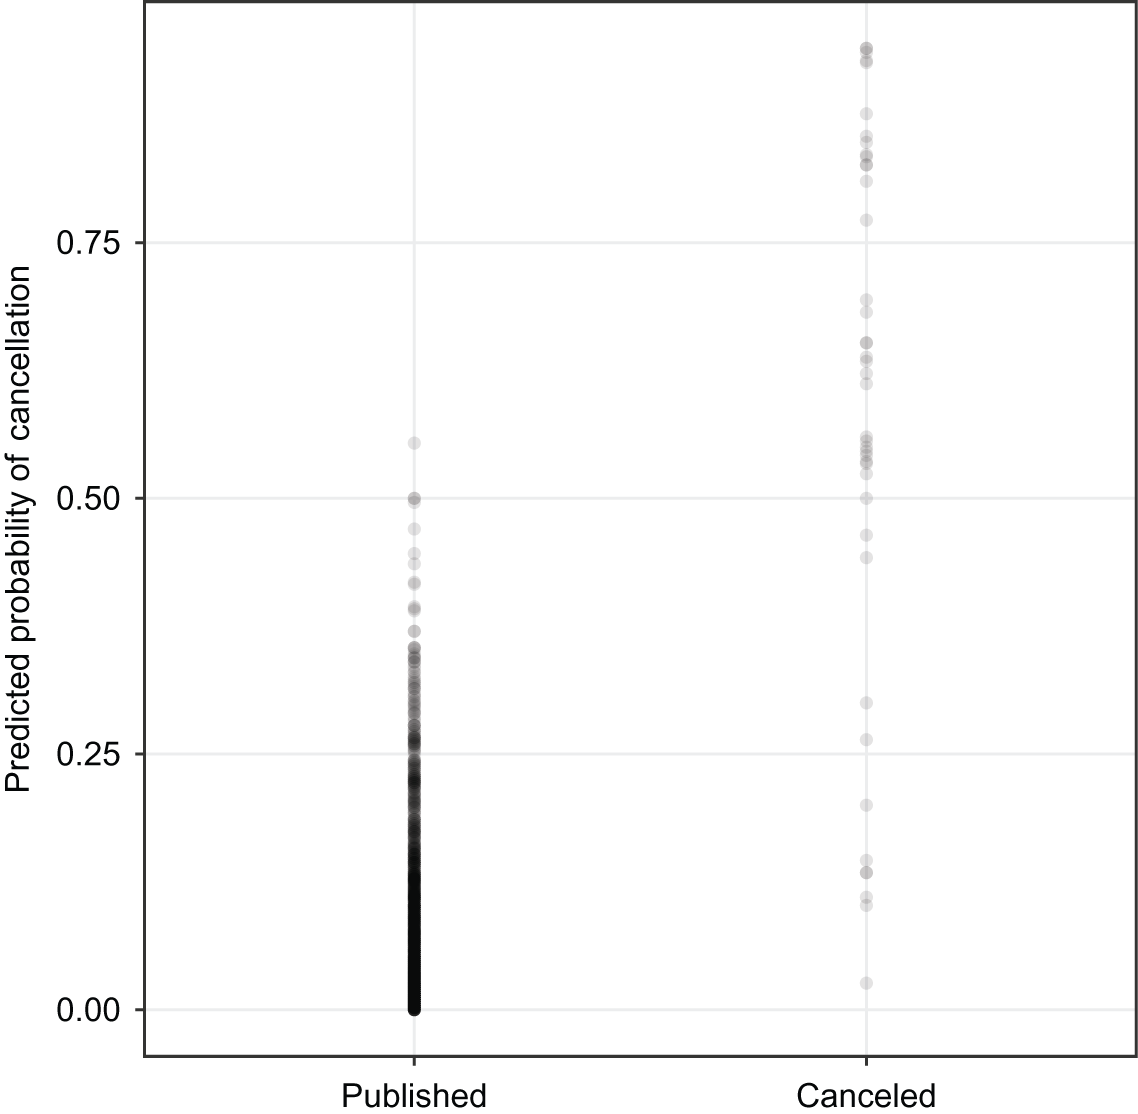
We find that predicting across rounds produces an average AUC of  $0.92$, about 4% worse than the AUC for Argentina’s hold-out validation sample within the 2016/17 round (see row 1, column 1 of Table 2). This result indicates that very little predictive power is lost across time. To underscore this point, Figure 3 plots predictions from the model for the 2018/19 round. As is evident, using a model fit on a previous round would produce a very efficient quality control system, with very few misclassified cases. Nor is this finding limited to just Argentina. We conduct an identical exercise using 2016/17 and 2018/19 data from Ecuador—a country not included in our main analysis because it lacked many of the 141 quality control procedures in 2016/17—and find that predictive performance declines by just 3%.Footnote 24 In both countries, quality control procedures developed at one time appear to be equally effective two years later.
Predictive performance across AmericasBarometer rounds in Argentina. Each dot represents an interview in the 2018/19 round, as predicted by a model fit on the 2016/17 sample. The y-axis indicates the predicted probability of cancellation, with the x-axis giving the real-world outcome. Darker dots indicate more observations.

Taken together, these results suggest that researchers can produce high-quality samples while relying on just a small sample of the available tools, significantly reducing their quality control effort compared to a full suite of procedures. Although few researchers have the resources to implement LAPOP’s full quality control workflow, our results indicate that these limitations need not prevent them from producing high-quality data. At the same time, our results suggest that scholars should take care when importing quality control procedures across national boundaries, as predictive performance may degrade by as much as 16%. While such caution does not appear to be necessary when predicting across survey rounds, our overall recommendation is that scholars take Table 1 as indicative rather than definitive.
8 Better Data, More Efficiently
One of the most important determinants of total survey error for large in-person household surveys is interview quality. Technological advances over the last decade have led to the rapid proliferation of tools for identifying and eliminating low-quality data to reduce TSE. Yet researchers seeking to implement these tools have little guidance on which procedures are effective, a pressing problem given that surveys are typically fielded under severe resource constraints. This paper provides the first steps toward solving this problem so as to help researchers produce more and better survey data.
We find that current tools are extremely effective in distinguishing high-quality interviews from low-quality interviews, as proxied by publication or cancellation in the 2016/17 round of the AmericasBarometer. However, they are also largely redundant: after dropping 111 of the 141 procedures we study, our models still predict interview quality as well as (and in some cases, better than) models fit using all of these variables. For survey researchers, the takeaway is clear: by implementing a limited, complementary set of quality control procedures, they can ensure a high-quality sample while freeing up resources to obtain more or richer data.
Our results identify the particular procedures, described in Table 1, which are most effective at weeding out low-quality interviews. More broadly, they indicate that researchers should implement quality control systems with two minimal characteristics. First, they should test for patterns that are observed at multiple levels of analysis, including indicators of fraudulent or low-quality data that can be detected in individual interviews, by enumerator, by sampling unit, and across the entire sample. Interview quality is determined by a number of distinct causal pathways; a workflow focused on just one level of analysis will necessarily miss some of these factors, leading to a lower-quality final sample. Second, effective quality control systems should take multiple passes at the data, with automated flags that work in real time, scripts that analyze batches of interviews, and light auditing continuously throughout fieldwork. All of these steps are necessary to fully assess interview quality.
Our results speak to the comparative effectiveness of quality control tools across the largest sample and the broadest range of countries of which we are aware. Yet they come with two important caveats. First, not all surveys will share LAPOP’s definition of “low-quality.” The AmericasBarometer assigns greater importance to some checks than others might; for instance, while informed consent is of primary importance to this study, this criterion may be less critical to other researchers. While we view LAPOP’s weighting of these priorities as generally applicable, we nonetheless encourage scholars to keep their own research priorities in mind while implementing these general recommendations. Second, we emphasize that these data do not allow us to measure interview quality directly. Our empirical strategy relies on the coarse proxy that is interview cancellation versus publication. Quality is a much more nuanced concept than this binary measure can capture, incorporating enumerator characteristics, respondent features, and contextual factors. Our goal is not to generate a fine-grained measure of interview quality; rather, we seek to help scholars efficiently identify interviews of sufficiently low quality that they merit rejection.
Implementing the procedures we identify is a feasible, minimalistic approach to increase the baseline quality of large in-person household surveys. Yet there remain a number of ways by which researchers can reduce TSE in these surveys. Most obviously, they can develop better quality control procedures. Many of the tools studied here were implemented ad hoc to combat specific behaviors observed in the field, but can be fine-tuned to better identify potential problems. We also encourage researchers to continue to invest in the development of entirely new tools. For instance, the process of auditing interviews for “no respondent” and other problems could be partially automated by creating scripts to analyze audio captures. Although our results indicate that many procedures add little value for determining interview quality, they do not suggest that researchers should stop innovating.
Finally, researchers can do much more to make their quality control workflow more transparent. The American Association for Public Opinion Research’s Transparency Initiative has called on major survey research institutions to routinely disclose methodological information. This initiative has led to advances in areas such as sampling frames and response rates; however, quality control procedures remain mostly private.Footnote 25 By publicizing their quality control workflow, researchers can contribute to better scholarly understanding of survey research methods, and ultimately, more credible social science.
Acknowledgments
For their advice and comments, we are grateful to Noam Lupu, Mitch Seligson, Chris Warshaw, Liz Zechmeister, and seminar participants at Cardiff and Essex. We thank the Latin American Public Opinion Project for generously sharing their data with us, and the LAPOP team (Rubí Arana, M. Fernanda Boidi, Nicole Hinton, Sebastian Larrea, J. Daniel Montalvo, Georgina Pizzolito, Mariana Rodríguez, and Carole J. Wilson) for its excellent work in data collection for this project. We also thank Alyssa Chvasta, Christine Huang, and Linzy Scott for their research assistance. A previous version of this paper was presented at the 2018 annual conference of the American Political Science Association. Both authors contributed equally; the ordering is alphabetical.
Data Availability Statement
Replication code for this article has also been published in Code Ocean, a computational reproducibility platform that enables users to run the code, and can be viewed interactively at https://doi.org/10.24433/CO.5039798.v1. A preservation copy of the same code and data can also be accessed via Dataverse at https://doi.org/10.7910/DVN/SV9B3E.