Introduction
There is a strong scientific consensus that global warming is happening; that it is largely man-made; that it is global, cumulative and potentially destructive; and that it will have to be brought under control sooner or later if disaster is to be avoided (IPCC, 2007; Stern, 2007; Royal Society, 2010; Committee on Climate Change, 2010). This consensus is accepted by most Western governments, and the EU has played a leading role in implementing, and going beyond, the Kyoto Agreement, a legally binding agreement ratified to date by thirty-four industrialised countries. The UK government is said to have adopted the world's most demanding and legally binding targets to reduce CO2 and other greenhouse gases (GHGs).
The policies implemented and planned to achieve these targets will have distributive consequences and thus implications for social justice and social policy, broadly conceived. Different groups have different responsibilities for climate change and suffer different impacts. Often these responsibilities and impacts work in opposite ways to create a ‘double’ or ‘triple’ injustice (Walker, Reference Walker2012: chapter 8; Gough, Reference Gough2012). Understanding of this distributional dilemma developed first at the global level. However, it also surfaces within nations (both developed and developing). Reviewing the evidence for European countries, Pye et al. (Reference Pye, Skinner, Meyer-Ohlendorf, Leipprand, Lucas and Salmons2008) conclude that households situated in the upper part of the income distribution contribute more to CO2 emissions in absolute terms than lower-income households; that poor households suffer most from environmental degradation; and that common environmental policy measures tend to have regressive effects, burdening lower income households more (cf. Vanhille, Reference Vanhille2011). This article seeks to contribute to this research, and to the role of social policies in reconciling environmental and social justice goals. It is one partial response to Fitzpatrick's (Reference Fitzpatrick and Fitzpatrick2011: 4) call ‘to turn environmentalism and social policy from distant acquaintances into firm friends’.
The main focus of the paper is on carbon mitigation policies (CMPs) and the distribution of emissions. (I ignore the second of Pye's three aspects: the direct impacts of climate change within the UK, such as flood risks, drought risks and heat waves, and their unequal distribution – on these see Benzie et al., Reference Benzie, Harvey, Burningham, Hodgson and Siddiqi2011; Walker and Burningham, Reference Walker and Burningham2011; DEFRA, 2012). It is a robust finding that many CMPs have regressive impacts; so various forms of countervailing policies are required if carbon mitigation is not to conflict with the pursuit of social equity and justice. Thus the sequence of my argument is as follows:
Climate mitigation policies → distributional dilemmas → countervailing social policies
This argument is then pursued in two parts according to whether emissions are conceived and accounted within a production or a consumption framework, a distinction discussed further in the next section. The first half works within the current targets and policy framework. It assesses the distributive impact of current CMPs and the current measures designed to reduce their regressive impact. It concludes by surveying and suggesting alternative policy scenarios that may better marry together the goals of carbon reduction and social equity.
The second half broadens our focus to study the distribution of all GHGs embodied in the consumption of the British population. It argues that to target these will require going beyond the current policy paradigm to develop more radical policies to modify preferences and behaviour, and to constrain total consumption demand. It then speculates on ways that radical new social policy programmes might combine the pursuit of these goals together with social equity.
The conclusion is that the future will lie with novel forms of policy integration. Alongside ‘traditional’ social policies, new pro-active, investment-focussed ‘eco-social policies’ will need to be developed:

The paper provides a broad-brush tour d'horizon, trusting that enough detail is provided to back up the central arguments, but within the journal's word limits. Discussion of some complex arguments is necessarily brief. The focus throughout is on the UK but I believe the analysis and arguments have wider relevance to the OECD world.
Climate change goals: from PAP to CAP
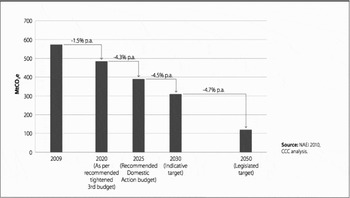
The Climate Change Act 2008 commits the UK to reduce GHG emissions by at least 80 per cent by 2050 and by at least 34 per cent by 2020, compared with the base year of 1990. Furthermore, it has set three intermediate carbon budgets for 2008–12, 2013–17 and 2018–22, and in May 2011 the coalition government committed the UK to further radical reductions for the fourth Budget period 2023–27. Figure 1 sets out the remarkable transformation in UK emissions this envisages.
Planned rate of reduction of greenhouse gas emissions (excluding international aviation and shipping), UK 2009−50
Source: Committee on Climate Change (2010: 25). Reproduced with permission.

Yet these targets only measure the amount of GHGs emitted within the territory of the UK. They do not track the emissions embodied in our growing volume of imports. Under the Kyoto Protocol a nation's emissions are defined as those generated within its national boundaries. It uses the ‘production accounting principle’ (PAP) to calculate these emissions, including emissions generated in producing goods for export but ignoring those embodied in imported goods. This works to the advantage of most rich countries included in Annex I of the Protocol, which in general have outsourced a growing share of their consumption during the last decades of globalisation.Footnote 1 For this reason, support has been growing for the alternative ‘consumption accounting principle’ (CAP) which measures the total emissions embodied in the consumption of inhabitants of the national territory in question (Bows and Barrett, Reference Bows and Barrett2010).
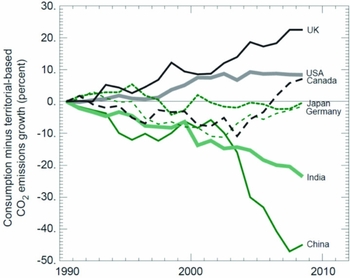
It is much more difficult to operationalise CAP since it ideally requires a multi-regional input-output model of the global economy (Turner et al., Reference Turner, Lenzen, Wiedmann and Barrett2007; Wiedmann et al., Reference Wiedmann, Lenzen, Turner and Barrett2007). At present, no international data are available which meet this exacting standard, though the OECD is working on it. Figure 2 presents data from the UK Energy Research Council, cited in the 2012 House of Commons Report on the subject. It shows that, while territorial emissions of CO2 in the UK declined by 19 per cent from 1990 to 2008, consumption-based emissions rose by 20 per cent. By 2008, the UK exhibited a greater ‘leakage’ of emissions than any other major country. The report concluded ‘We are concerned that the UK could be meeting its domestic carbon budgets at the expense of the global carbon budget’ (p. 10). Our own estimate of trade in total GHGs (including methane, nitrous oxide and hydroflourocarbons) finds an even wider gap (Gough et al., Reference Gough, Abdallah, Johnson, Ryan-Collins and Smith2011).
‘Consumption gap’ in CO2 emissions since 1990: selected high emitting countries
Source: House of Commons Energy and Climate Change Committee (2012: 10).

There are two arguments for moving from PAP to CAP: ethical and political. Justice arguments concerning national responsibilities for climate change are complex and cannot be reviewed here but the ethical case for allocating responsibility according to per capita emissions of greenhouse gases is a powerful one. ‘Most analysts who have studied the problem from an ethical perspective have concluded that equal per capita is a minimum standard of distributive justice, inasmuch as it ignores disproportionate historical emissions’ (Baer, Reference Baer, Dryzek, Norgaard and Schlosberg2011: 330; cf. Caney, Reference Caney, Beitz and Goodin2009; Walker, Reference Walker2012: chapter 8). Moreover, outsourcing is driving up the emissions of non-Annex 1 countries, which current climate change negotiations are keen to draw into international agreements limiting GHGs. Bows and Barrett (Reference Bows and Barrett2010) argue that a CAP approach can offer new opportunities for global carbon reduction. It would ease the emissions problems facing large exporters and thus the potential conflict between climate change and socio-economic development.
The two parts of the article which follow consider in turn PAP and CAP emissions, treating within each relevant CMPs, the ensuing distributional dilemmas and existing and proposed supporting social policies.
Production based emissions
Current climate change mitigation policies in the UK
We begin with the official targets and contemporary climate mitigations policies in OECD countries. Climate mitigation embraces a huge range of policies, from developing renewable energy sources to sustainable agricultural practices, from insulating buildings to emissions trading systems, from waste disposal to labelling of refrigerators – and countless more besides. These can be summarised under three goals: explicit pricing of emissions, promoting clean energy and improving energy efficiency. A recent OECD report (Bowen and Rydge, Reference Bowen and Rydge2011) provides an overview and evaluation of all such climate change policies in the United Kingdom (see also Marden and Gough, Reference Marden and Gough2011).
My focus is on the interaction between climate mitigation and social policy, so I will restrict myself to those programmes directed towards household actions and behaviours, namely carbon pricing and energy efficiency. These include direct government subsidies for thermal insulation, notably Warm Front and the Decent Homes programmes to improve social housing. More extensive are the programmes mandating energy companies to deliver certain energy efficiency benefits to lower-income households, such as the Carbon Emissions Reduction Target (CERT) and the Community Energy Savings Programme (CESP): here the ‘costs’ imposed on energy suppliers are assumed to be largely passed on to end users. Total spending on the entire suite of programmes has been surprisingly small – a mere 0.24 per cent of GDP in 2010–11 (Marden and Gough, Reference Marden and Gough2011). Indeed this total is outweighed by spending on the single Winter Fuel Payments benefit. There is no evidence yet of fiscal competition between CMPs and the welfare state.
Distributional impact of current household CMPs
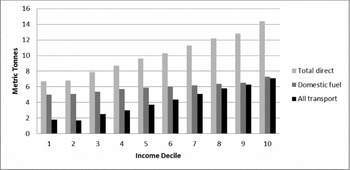
The most recent and thorough analysis of the distribution of all direct household emissions is by Fahmy et al. (Reference Fahmy, Thumin and White2011), mostly relating to the mid-2000s, summarised in Figure 3.
Direct UK household emissions by equivalised household disposable income (metric tonnes)
Source: Fahmy et al. (Reference Fahmy, Thumin and White2011: Tables A1-A5).

All direct emissions increase with household income, but more so in the case of emissions from private vehicles and aviation. Emissions from domestic fuel vary very little across income groups, meaning that as a share of income they rise rapidly with falling income. Since supplier obligations, which form the core of current CMPs, are intended to be financed by raising overall energy prices to domestic and business customers, their impact is highly regressive. The second finding is that many other factors also affect emissions. In the case of domestic fuel use, the major ones are the size and composition of households and the size and construction of dwellings. In the case of private vehicle emissions, additional factors include levels of car ownership and number of workers in the household (see also Dresner and Ekins, Reference Dresner and Ekins2006; Druckman and Jackson, Reference Druckman and Jackson2008; Thumin and White, Reference Thumin and White2008).
DECC (2010) estimated the impact of mandated policies on energy prices and consumer and medium size commercial energy bills in 2010, 2015 and 2020, compared to a counterfactual of no climate change policies.Footnote 2 It predicts a real increase in charges to households by 2020 of 33 per cent for electricity and 18 per cent for gas; yet predicts a rise of only 1 per cent in average combined bills. This is because it assumes great success in the uptake of energy efficiency measures and renewables incentives. These assumptions may be over-optimistic, not to say complacent. Even so, these burdens will fall heavily on lower-income households (DECC, 2010: 15, Chart 7). Moreover those who are able to benefit from energy saving measures, predominantly higher-income groups, will see their bills fall while those who do not will see their bills rise. For example, those taking up insulation measures are predicted to enjoy bills falling by 7 per cent and those taking up insulation and renewables, including the Feed-In Tariff, a reduction of 25 per cent, while those with neither will see a further increase of 2 per cent. A more recent model of the Green Deal shows 12 per cent of households receiving such measures in 2020 benefitting from reduced energy bills, and 88 per cent not receiving them whose bills would rise – by around 0.6 per cent of their income in the lowest decile (Hills, Reference Hills2012: Figure 5.1).
The issue of ‘fuel poverty’ is a critical aspect of the distributional impact of CMPs in the UK. The Warm Homes and Energy Conservation Act 2000 defined someone who is fuel poor as ‘a member of a household living on a lower income in a dwelling which cannot be kept warm at reasonable cost’. The measure agreed in 2001 defined fuel poverty as existing when ‘a household needs to spend more than 10 per cent of its income on total fuel in order to heat its home to an adequate standard (21○C in living room and 18○C in other occupied rooms in daytime hours)’. In response to growing concerns about the validity and reliability of this measure, the Hills Report has proposed an indicator closer to the original intent, namely where a household has required fuel costs above the median and were to spend that amount they would be left with a residual income below the official poverty line (Hills, Reference Hills2012: 9). Evaluating the proposed Green Deal scheme, Hills concludes: ‘on balance a successful Green Deal programme, accompanied by an Energy Company Obligation (ECO) that spends a relatively small amount of its total available funding on the fuel poor, would be expected to increase fuel poverty’ (2012: 112). Higher subsidies, whether public or mandated, would be necessary to avoid this, but if mandated would make fuel poor households less attractive to energy suppliers.
Social policies to moderate the distributional impact of CMPs
I consider here three sets of measures relevant to domestic energy use to moderate such regressive impacts: better income compensation, reduced energy bills and thermal efficiency policies. These correspond to the three ‘policy archetypes’ delineated in the Hills Report on Fuel Poverty 2012.Footnote 3
Better compensation
The only explicit mechanism for compensating higher fuel bills and fuel poverty are Winter Fuel Payments, a flat rate payment of £200 to households with pensioners (£300 if the oldest resident is at least 80) and Cold Weather Payments, which provide additional payments of £25 to pensioners and low-income households in areas with exceptionally cold weather. As Boardman (Reference Boardman2010, ch. 3) and others have shown, these are remarkably poorly targeted. Can more equitable forms of compensation be devised? All models so far suggest that, while losses due to higher carbon prices or taxes can be compensated on average across the income distribution, large numbers of households continue to lose out. This reflects the fact that the variables affecting domestic energy efficiency cannot be easily addressed by existing social transfer programmes since they encompass factors such as the energy efficiency of dwellings, urban–rural differences, commuting distances and availability of gas supplies.
Assuming steadily rising fuel prices in the coming decade, another measure would be to automatically adjust social benefits using a special low-income price index (see IFS, 2011). The central DECC projections of fuel cost increases mentioned above will drive up low-income inflation (even though lower-income households exhibit greater price elasticity than higher income; in other words, their consumption will likely decline as energy charges are driven upwards). Adjusting social benefits using a separate index for low-income households would provide additional protection as we enter an era of steadily rising oil − and food − prices. Yet all such policies can do little to compensate those households, which for a variety of reasons, often outside their short-term control, face above-average energy costs.
Variable energy prices
Another form of quasi-compensation would be to adjust directly the energy tariffs faced by different households and income groups. From 2011, the new Warm Home Discount will automatically award pensioners on Pension Credit annual rebates of at least £120 off their electricity bills, with some support available for other low-income groups. Between 2011 and 2015 this mandatory scheme is projected to cost £1.1 billion and to help around 2 million households per year. However, it would reach only one quarter of the fuel poor using the Hills measure (Hills, Reference Hills2012: 114). To extend it to all households on means-tested benefits would entail using complex data-matching and would be ‘extremely challenging’ (Hills, Reference Hills2012: 145).
Administratively more simple would be to require energy companies to operate a ‘rising block tariff’, lowering the marginal costs of initial units of electricity or gas consumed, and raising the marginal costs of successive units. (At present energy tariffs work in the opposite way.) This would recognise the basic need component of the first block of household energy and the progressive choice element in successive units. The UK Office of Gas and Electricity Markets (Ofgem, 2009) model found such a scheme would be both progressive and exert price constraints on higher user households. It would also help tackle fuel poverty directly since fuel poor households on average consume below average amounts of electricity and gas (Committee on Climate Change, 2008: 409; Druckman and Jackson, Reference Druckman and Jackson2008). However the Hills Report concluded it might increase fuel poverty so should not be countenanced until more targeted efficiency measures are in place. Perhaps more important, Hills and the Climate Change Committee recognise that interfering with energy tariffs would require a radical shift in the pricing policies and regulation of private utility companies − a reversal of the liberalisation and deregulation agenda of the past three decades. This raises substantial political and ideological difficulties.
Energy efficiency policies
EU and UK regulations on the energy efficiency of buildings, vehicles and products appear to have been remarkably effective in lowering emissions (Hills, Reference Hills2012: 43). Meanwhile, the main, though small, thermal efficiency programme, Warm Front, is to be replaced by the Coalition Green Deal programme. This is a complex programme, but at its heart is a new financial instrument that allows householders to upgrade the thermal efficiency of their home at no upfront cost, with investment paid back through electricity bills – the ‘golden rule’ whereby the expected financial savings from the measure are at least equal to the cost attached to the energy bill. It also comprises a new Energy Company Obligation (ECO) that requires energy companies to pay part of the upfront costs of energy efficiency measure, and an ‘affordable warmth’ obligation to make specified reductions in the energy bills of low-income and vulnerable households. Thus where the golden rule cannot be met – primarily solid wall insulation – an energy supplier may be able to provide some ECO subsidy to help co-finance the improvements (Hills, Reference Hills2012: 108). But the costs of this subsidy will be recouped through higher energy prices.
At the time of writing, precise details of the scheme have not been announced. It is clear that the scheme is designed to shift almost all costs to the private sector, reducing the already tiny public spending on domestic energy efficiency. It has been criticised by the government's Committee on Climate Change which predicts it will fall far short of its goals, resulting in the insulation of only 700,000 lofts (around 10 per cent of potential) and 1.7 million cavity walls (around 30 per cent of potential – and only 15 per cent of the rate achieved under CERT).Footnote 4 Other critics include the Royal Academy of Engineering (2012) and the Hills Report, which finds that it would be likely to increase fuel poverty unless subsidies through the ECO mechanism or from elsewhere are improved (Hills, Reference Hills2012: 112). A recent comparison of house retrofitting in Germany and the UK makes the case for more integrated policy measures to achieve combined carbon and social goals: ‘The Green Deal, Energy Company Obligation (ECO) and the Green Investment Bank are all welcome new policies in the right direction. But on the basis of the KfW experience, they will not go far enough on any of the key dimensions: the regulatory framework, the level of financial incentive, or the clarity of the message about integrating home energy efficiency and micro-generation’ (Schröder et al. Reference Schröder, Ekins, Power, Zulauf and Lowe2011; cf. Power and Zulauf, Reference Power and Zulauf2011).
Conclusions
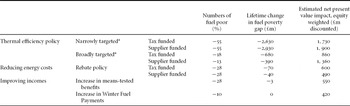
To indicate and compare the distributional impact of these strategies Table 1 summarises data from the Hills Report on the impact of spending £500m a year according to three measures. These are: (a) the reduction in the fuel poor, defined as those with low incomes and high energy costs; (b) the reduction in the lifetime fuel poverty gap; and (c) the net present value of spending these sums, weighing costs and benefits inversely according to household income. The conclusions are clear. First, energy efficiency measures are superior on all three counts. Within these, broader targeted measures are superior in reducing CO2 emissions, but narrowly targeted measures reduce fuel poverty more. The models suggest that supplier funded measures will yield somewhat higher benefit−cost ratios, due to the assumption that private suppliers will maximise the cost-efficiency of their insulation measures. However, this implies that they pick ‘low hanging fruit’ first and will face higher expenditures down the road. Second, rebates for low-income households would be moderately successful especially if tax-funded (the Report does not consider rising block tariffs). Compensating low-income households via more income is the least successful or efficient policy option, especially the current Winter Fuel Payments (which admittedly have other goals).
Estimated impact on various measures of fuel poverty of spending £500m via different policy strategies, UK 2016

Note: *Broadly targeted: delivers fully subsidised insulation and heating measures to households living in dwellings with a SAP of 55 or less. ‘Narrowly targeted’ restricts this to households receiving means-tested benefits.
Source: Hills (Reference Hills2012), Tables 7.13, 7.14, 7.15.
When focusing on domestic energy emissions, the only effective solution in the medium term, let alone the long term, is to develop new forms of eco-social policy. The government Green Deal programme is ambitious but will be inadequate in renovating sufficient dwellings or in securing inter-household equity. Yet to move further will press against the current economic orthodoxy in two respects. First, it will require direct tax-financed subsidy, alongside the mandated policies, which entail further regressive increases in energy prices. Second, at a time of fiscal austerity, it would entail a shift towards a different strategy, variously labelled ‘green growth’ (OECD, 2010), a ‘low-carbon industrial revolution’ (Stern, Reference Stern2011) or a Green New Deal (New Economics Foundation (Nef), 2008; UNEP, 2009; cf. Gough, Reference Gough2011). In conventional terms, the level of public investment and subsidy required would compete fiscally with current, reduced social spending on the welfare state. Bringing together Keynesian and Schumpeterian perspectives, this alternative calls for a sustained public programme to invest in renewable energy and to deploy radical retrofitting measures. Advocates would also contend that the current post-crisis macro-economic situation is extremely favourable, given a glut of savings and very low interest rates. There is thus a unique scope to leverage green investment and to fund extensive retrofitting to reduce household emissions (Romani et al., Reference Romani, Stern and Zenghalis2011).
Consumption-based emissions in the UK
I now turn to the broader CAP measure of UK emissions. I analyse their distribution across households, consider the policy measures that could reduce consumption-based emissions, and propose some combined eco-social policies that could address the distributive impacts of these policies.
This draws on a longer study of the UK in 2006, details of which are provided in Gough et al. (Reference Gough, Abdallah, Johnson, Ryan-Collins and Smith2011). It links together data from two datasets: the Stockholm Environment Institute's (SEI's) Resources and Energy Analysis Programme (REAP), which calculates UK carbon emissions at a per capita level, and the UK 2006 Expenditure and Food Survey. By so doing, we are able to calculate the average emissions per household and per person for each COICOP (Classification of Individual Consumption by Purpose) category.
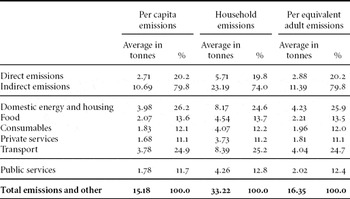
Our study finds that consumption-based GHG emissions in the UK in 2006 averaged 33.2 tonnes CO2e per household, or 15.2 tonnes per capita. Table 2 shows that direct emissions – household domestic energy use and petrol for private cars – account for only 20 per cent of total private emissions.Footnote 5 To concentrate on the direct emissions of households is to give an impoverished and distorted picture of the carbon and environmental footprint of consumption activities in a rich country like the UK. The table breaks down all emissions into six broad categories. Within private consumption, domestic energy and housing (including all housing services, repairs, refurbishments etc) and all spending on travel (including holidays abroad) each account for around one-quarter of GHG emissions. Food, consumables and private services each emit roughly one eighth. The table also shows emissions from government services of all kinds, including the NHS, education and social services, accounting for 1.8 tonnes per person, but this important issue is not discussed further here (see Gough and Meadowcroft, Reference Gough, Meadowcroft, Dryzek, Norgaard and Schlosberg2011).
Household emissions by consumption category, UK 2006

Source: Gough et al., Reference Gough, Abdallah, Johnson, Ryan-Collins and Smith2011, Table 3.
The distribution of total consumption emissions
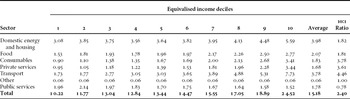
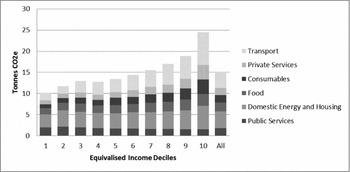
The distribution of all household emissions from private consumption is shown in Table 3 and Figure 4. They distinguish deciles of gross income,Footnote 6 calculated on an equivalised basis to take into account household size and composition. They show emissions rising in line with income; in particular, the highest income decile is out of line, emitting 5.7 tonnes per person more than the next highest decile. Income is significantly correlated with all types of emissions, but much more so with embodied than direct emissions. Comparing the per capita emissions of the highest and lowest deciles, we find these are 4.5 times higher for transport and over 3.5 times higher for private services and consumables, compared with a ratio of only 1.8 for the more basic goods of domestic energy and food. Table 3 also shows the emissions embodied in public services, notably the NHS, education and social work and social care. Because these are distributed according to need, they decline slightly as incomes increase; but this interesting finding cannot be discussed further here (see Gough et al., Reference Gough, Abdallah, Johnson, Ryan-Collins and Smith2011: 8).
Per capita GHG emissions by equivalised gross income decile (tonnes CO2e), UK 2006

Source: Gough et al. (Reference Gough, Abdallah, Johnson, Ryan-Collins and Smith2011: Table 4).
Per capita GHG emissions by equivalised gross income decile (tonnes CO2e), UK 2006
Source: Gough et al. (Reference Gough, Abdallah, Johnson, Ryan-Collins and Smith2011: Table 4).

Other variables (for which we have information) that impact on per capita emissions include household size, household type, housing tenure and the employment status and hours of work of the household reference person. Regression analysis reveals that income is the major explanatory factor: for each £5,000 increase in annual income, GHG emissions increase by 6.9 per cent. It is highly likely that growing income inequality in Britain has widened the emissions gap. Household size varies inversely with per capita emissions, illustrating economies of scale in consumption. Regression analysis finds that single person households have the highest per capita emissions, followed by two-person households, followed by households with children.Footnote 7 Non-retired ‘workless’ households emit significantly lower amounts than working households when income and composition is controlled.
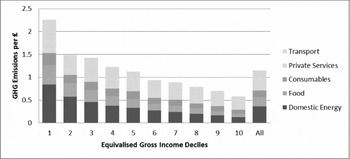
If we are concerned with the distributional implications of policies to reduce carbon emissions, it is also useful to calculate the ratio of emissions to income. Figure 5 then disaggregates this figure by income decile and source of emission (excluding here public services). Immediately the picture of rising lines is reversed. Per capita emissions, and all categories of emissions, are greatest in relation to income in the lowest income decile and fall as income rises: the lowest decile emits four times as much in relation to its income as the highest. But this pattern varies between consumption categories: the ratio is over six times for energy and food, three times for consumer goods and services and 2.3 times for transport.
Kilos of GHG Emissions per £ of Gross Household Annual Income by sector and equivalised income decile, UK 2006
Source: Gough et al. (Reference Gough, Abdallah, Johnson, Ryan-Collins and Smith2011, Table 14 (recomputed)).

This analysis confirms but modifies previous findings for direct emissions. The emission elasticities of all the large categories investigated are less than one; thus any rise in carbon prices, when generalised throughout the economy, will impact on lower-income households more. However the degree of regressivity varies according to the category of private consumption expenditure. Expenditures on, and emissions from, domestic energy and food take a proportionately higher share of incomes lower down the income scale than spending on, and emissions from, transport, consumer goods and personal services.Footnote 8
Policies to reduce consumption emissions
I summarise here two types of policies which might make serious inroads into all embodied households emissions: market-based incentives and behaviour change policies (see Gough, Reference Gough2011, for further arguments and references).
Within economic incentive policies there is a division between those influencing the price of carbon, such as a carbon tax, to which the quantity of emissions adjusts, and those capping or otherwise influencing the quantity of carbon emitted, to which its price adjusts. One study finds that the popularity of carbon taxes in the West which waxed in the 1980s and early 1990s has waned over the past decade (Environmental Tax Policy Institute, 2008). Pure environmental taxes in the UK according to the Treasury definition amount to only 0.5 per cent of total tax revenues in 2010–11.Footnote 9 Revenues from a wider definition including, notably, fuel duties are an order of magnitude larger, but their trend as a share of GDP is nearly flat (Marden and Gough, Reference Marden and Gough2011). According to Helm (Reference Helm, Helm and Hepburn2009) and Hepburn (Reference Hepburn, Helm and Hepburn2009) cap-and-trade has triumphed thus far over carbon taxation despite its many weaknesses due to governments’ fears of new taxes, the scope for rent-seeking and market manipulation, and new vested interests in carbon trading. Thus, EU Member States will rely in the medium term on cap-and-trade schemes, of which the major programme is the EU Emissions Trading System (ETS). This has many defects but targets about half of all industry and will thus in time raise the embodied carbon costs over a wider range of goods and services. As our research shows, the impact of any rise in the price of carbon will bear most heavily on low-income households and, within these, on smaller and workless households. The impact of ETS and broad carbon taxation will be less inequitable than current government policies, but it will remain regressive (cf. Büchs et al., Reference Büchs, Bardsley and Duwe2011: 7).
Policies to modify consumer behaviour in a low carbon direction vary according to underlying theory. They vary from orthodox economic consumer behaviour theory through psychology-based theories and advocates of ‘nudging’, to more sociological approaches that recognise multiple drivers (Tversky and Kahenmann, Reference Tversky and Kahnemann1974; Thaler and Sunstein, Reference Thaler and Sunstein2008; DEFRA, 2008; Taylor-Gooby, Reference Taylor-Gooby2011). Others go further still to recognise the role of intentional modifications of behaviour pursued by corporate interests (Seyfang and Paavola, Reference Seyfang and Paavola2008) or the role played by ‘systems of provision’ locking households into patterns of consumption (Jackson and Papathanasopoulou, Reference Jackson and Papathansopoulou2008). To counter these, some argue, requires more government regulation, pro-environmental investment and public planning. ‘Why retreat to nudge, where other influences may shape choices?’ (Taylor-Gooby, Reference Taylor-Gooby2011: 40). Others contend that these also require strong public action and collective engagement at sub-national levels (Dobson, Reference Dobson2006, Ostrom, Reference Ostrom2009, Whitmarsh, Reference Whitmarsh, Dietz, Michie and Oughton2011). It is safe to conclude that moving to low carbon lifestyles will require forms of collective action that go well beyond current government strategies for climate change mitigation.
Social policies to secure equitable carbon reduction
I conclude by surveying three policies which have been advocated to help reduce embodied emissions from consumption in an equitable way: taxing consumption and redistributing incomes, rationing carbon and reducing working time.
Taxing consumption
One solution would be to tax consumption spending directly, via either a progressive consumption tax or a luxury goods tax. Frank (Reference Frank2011) argues for the former, on the grounds that the spending habits of the rich foster an unending expansion in general notions of material adequacy. A consumption tax could be implemented as a progressive income tax that excludes savings. However, this would benefit higher-income groups – who save more – and would over time increase, not diminish, wealth inequality. More appropriate is selective taxation of high emissions consumption, such as air travel, though this would further challenge orthodox assumptions that consumer sovereignty should not be questioned except in case of direct harm.
There is circumstantial evidence, however, that the carbon savings in carbon and GHGs from such schemes would be less than might be expected. In a novel study, Druckman and Jackson (Reference Druckman and Jackson2010) estimate the GHG emissions of a ‘bare necessities’ household budget. They used the JRF minimum income standard for a decent life, which assumes drastic limits on consumption, such as: no private cars (public transport passes and occasional use of taxis instead), all households occupy dwellings closely matched to their family size, and all dwellings have basic insulation already fitted. Assuming that the entire UK population is living at these adjusted standards, they estimate that average household GHG emissions would have been just 37 per cent lower than actual in 2004: a radical transformation of consumption yields a relatively small reduction in emissions. This evidence suggests that traditional redistributive social policies alone would not suffice in an era of serious climate change and climate mitigation.
Rationing and trading carbon
An alternative policy would tackle both overall household emissions and the distributional dilemma head-on by instituting a form of universal carbon rationing, or personal carbon allowances, coupled with trading (PCAT). There exist a wide variety of such proposals, but all entail a cap on a country's total GHG emissions (decreasing year by year) and a division of this amount into equal annual allowances for each adult resident (usually with a lower allowance for each child) (Environmental Audit Committee, 2008; Fawcett and Parag, Reference Fawcett and Parag2010). In effect, a dual accounting standard and currency is developed − energy, goods and services have both a money price and a carbon price. Those who emit less carbon than the average can sell their surplus and gain, while higher emitters would pay a market price for their excess. Advocates claim that a PCAT scheme covering domestic energy, road fuel and air travel would on average be quite progressive. In addition, there is some evidence that it could generate psychological and normative motivations to encourage and sustain the kind of behavioural change that leads to emissions reduction (Fawcett and Parag, Reference Fawcett and Parag2010: 333). It could be implemented using personal carbon cards and smart metering, though the administrative difficulties should not be underestimated.
PCAT would be inherently progressive, so it overcomes the distributional dilemma inherent in upstream cap-and-trade schemes and carbon taxation. However, it does not avoid all issues of fairness; for example, those living in inefficient or underutilised housing, dependent on car travel, or with special needs. Too many exceptions to the standard allowance could undermine the scheme, but too few would result in rough justice, which could undermine public support (in addition to the political risks of such an overtly redistributive project). For these and other reasons, the UK government in 2008 abandoned its plans for testing the idea. A recent series of studies considered it a suitable future framework for delivering long-term, sustainable cuts in carbon emissions in a way that other policies cannot. However, its integration into the existing policy landscape, notably upstream carbon trading schemes like the ETS, would raise problematic questions which differ from country to country according to their energy sources, transport infrastructure and other factors (see Fawcett and Parag, Reference Fawcett and Parag2010, and other articles in that special issue).
Crucially for my argument, a way would need to be found to extend PCAT to include the carbon content of major supermarket goods and important services in a modern economy. The Tesco pledge to put carbon labels on 70,000 products has hardly begun. To implement a wide-ranging PCAT scheme would again require further public regulation and intervention in the wholesale and retail sector.Footnote 10
Reduced working hours
A final radical policy is to reduce working hours, which, it is argued, could reduce emissions in two ways: via the scale effect, by reducing incomes, expenditures, consumption and emissions, and via the compositional effect, by altering time and expenditure budgets towards lower carbon intensity. This introduces a new and radical policy goal for climate mitigation: to constrain aggregate demand.
Assuming a secular rise in productivity, this amounts to taking more of these gains in the form of rising leisure rather than consumption. Since 1975, when they had similar hours of work, the US has reduced average hours by 4 per cent and Germany by 22 per cent (Schor, Reference Schor2012). All other things being equal, Germany has deployed its productivity dividend in a less environmentally harmful way than the United States. Schor (Reference Schor2012), in a cross-national analysis of twenty-nine OECD countries, finds that ‘annual working hours are a large and significant predictor of ecological outcomes’ (cf. Nässen and Larsson, Reference Nässen and Larsson2011). Several European countries have initiated experiments in reducing work time which offer constructive lessons, including the French thirty-five hour week and the Belgian Time Credit Scheme which enables workers to accumulate rights to career breaks (Fagnani and Letablier, Reference Fagnani and Letablier2004). More radical proposals have been developed by Nef (2010) and Schor (Reference Schor2012). Such policies could in principle redistribute employment opportunities, enhance individual choice and wellbeing and save carbon. However, care would be needed to ensure that this policy shift would not raise other distributional dilemmas, including the risk of increasing poverty among the low paid, and growing ‘time inequality’ between the higher and lower paid (Burchardt, Reference Burchardt2008). Working time reduction would need to be combined with new forms of income support for low earners and other measures to adjust incentives for employers and employees.
Conclusion
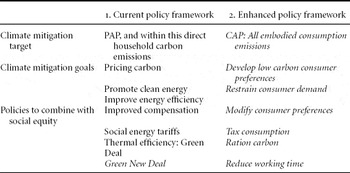
Table 4 summarises the structure and sequence of the arguments in this article.
Summary: policies to reconcile equity and sustainability

Two major conclusions follow. First, only energy saving policies can secure long-term reductions in direct carbon emissions coupled with avoidance of inequitable and unjust distributive outcomes. It is highly likely that these eco-social programmes will require substantially higher levels of public intervention, regulation, planning and subsidy than currently envisaged. To pursue this in the contemporary, long-drawn-out, post-crisis era will entail further challenges to contemporary neo-liberal orthodoxies, in particular some form of Green New Deal and a switch in arguments for public spending from compensation to eco-social investment (Helm, Reference Helm2012; Reed and Lawson, Reference Reed and Lawson2011).
Second, there is an ethical and political case for monitoring and targeting the total consumption-based emissions of rich countries like the UK. This would require policy goals additional to current climate mitigation efforts, namely measures to develop low carbon consumer preferences and to restrain overall consumer demand. These policies might include carbon rationing and reductions in working time. Again this would challenge the dominant doxa of the last three decades. We will need to move beyond countervailing and compensatory social policies to integrated eco-social programmes.
Acknowledgements
This work was supported by the Economic and Social Research Council [grant number 000-22-3683]. Many thanks to Tania Burchardt, Anna Coote, Peter Taylor-Gooby, Karen Turner, and two anonymous referees for helpful comments on an earlier draft.