I. Introduction
Consumers show an increasing interest for high-quality wines. Higher-income levels favour a shift in food and beverage consumption towards higher-price/higher-quality products, and wine is no exception. On the supply side, producers perceive the shift of demand and strive to improve the quality of their products. Although quality is a multi-facet and slippery concept, it has a very sound economic counterpart, since it is reflected in wine prices.
The search for quality is a particularly difficult task for ageing wines. There is an intrinsic uncertainty in what the final outcome will be of so many years of biochemical processes; the real quality of mature wines is often revealed only in the long run. This is the main reason both consumers and producers try to formulate predictions on future quality of these wines: producers anticipating their wine will be of a high quality will require higher prices even when they are younger, and consumers that make the same prediction will be ready to pay higher prices; the opposite is true when a lower quality is anticipated.
Saying that there is an intrinsic uncertainty on future quality, on the other hand, does not obviously mean that no prediction is possible. Consumers and producers do make predictions, and, moreover, experts provide opinions and ratings to this purpose. Much is known on the influence of several variables on wine quality and, among them, weather conditions during the growing and harvesting period are crucial. Information on weather conditions is largely available, but it is questionable whether experts efficiently exploit it. It has been shown, both for French Bordeaux and for Australian wines (Ashenfelter, Ashmore, and Lalonde, Reference Ashenfelter, Ashmore and Lalonde1995; Byron and Ashenfelter, Reference Byron and Ashenfelter1995), that weather data provide an accurate prediction of long-run wine prices (and, hence, of quality). Ashenfelter, Ashmore, and Lalonde's (Reference Ashenfelter, Ashmore and Lalonde1995) model explains 83% of total variation in log prices for Bordeaux wines, and Byron and Ashenfelter's 86% of total variation in log prices for Grange Hermitage.Footnote 1 More interestingly, it has been shown that these models give more accurate predictions of long-run prices than do market prices in the first years after the vintage. In other words, the market for immature wines over- or under-estimate the future quality and price of mature wines. Since the information on weather data on which the models are based is available, it is apparent that market operators do not efficiently use it.
Nevertheless, experts’ opinions and ratings are often the only or the most at-hand information that consumers can have to formulate predictions and to make purchasing decisions. It is, therefore, important to assess to what extent experts’ opinions are reliable. More so, when pricing data are not easily available. This is the case for Barolo and Barbaresco wines. Barolo and Barbaresco are produced in the hilly area of Langhe, in Piedmont, northwest of Italy, under strict appellation rules, and are well-known and prestigious wines, well fit for ageing. Although these wines for their better vintages can last as many years as the Bordeaux wines, there is no active market for immature wines, nor an auction system as the one that is active for mature Bordeaux. Of course, mature Barolo and Barbaresco are sold, but the market is very thin, and prices are, therefore, highly variable.
Indications on vintage quality mainly rely on experts’ evaluations. Experts usually rate vintages along an ordinal scale, according to their judgement on the future evolution they are anticipating for the wines. Available information on which their evaluations are based include the evolution of weather during the growing season, which is largely known, and, possibly, tasting of immature wines. The issue therefore arises, whether experts’ ratings efficiently exploit available information, much in the same sense as the issue whether the market efficiently exploits available information in the case of Bordeaux. If the information is common and is efficiently exploited, it should lead to a convergence of the experts’ evaluations.Footnote 2 We will assess the way experts’ ratings incorporate information on weather data when rating vintages. Since vintage quality ratings are only ordinal, we estimate their determinants using an ordered probit function that incorporates multiple indicators of quality and a common underlying structure of how the weather determines quality. Next, we evaluate the convergence across experts’ vintage ratings.
The remainder of the paper is organised as follows: in Section II, the data are presented; Section III presents the results of the estimated models, separately for the three experts we considered; in Section IV, we compare the experts’ vintage ratings to ascertain whether they are converging along a common pattern; some considerations conclude.
II. Data
Weather data are drawn from recordings of weather stations belonging to the Regional Service. The weather station in Castiglione Falletto was chosen as the most representative of the Barolo area, since it is included in the DOCG area for Barolo. Castiglione is located a few kilometres from Barolo, and the weather station is close to the top of the hill, at 360 m. above sea level, on the southwest side, and, therefore, represents rather well the typical situation of vineyards in the area. Records for Castiglione are nevertheless only available since 1980. For the previous periods, temperatures for Castiglione were estimated from data of the weather station in Cuneo, and rainfalls from data of the weather station in La Morra. Cuneo is about 50 kilometres from Castiglione, and is on the plain; nevertheless, temperatures are closely related, and the regression fits extremely well.Footnote 3 La Morra is very close to Castiglione, just the opposite side of the same valley; since rainfalls have a larger variation than temperatures, and since they may be quite different even at very small distances, the regression fits slightly worse, but still at very satisfactory levels.Footnote 4 Based on these regressions, fitted values were calculated for the 1970–1980 period, as well as for an individual missing datum (February 1988 temperature), and a complete 1970–1997 series of temperatures and rainfalls was made available.
We draw vintage ratings from three sources: the “Vini d'Italia” of the Gambero Rosso-Slow Food Arcigola wine guidebook (GR); ratings from Robert Parker on Barolo and Barbaresco (PK); and Sheldon and Pauline Wasserman's Italy's Noble Red Wines (WW) (Wasserman and Wasserman, Reference Wasserman and Wasserman1991).
Gambero Rosso is probably the most influential Italian wine guidebook. It is issued every year, also in German and in English. Ratings for wines from each winery considered are given (in terms of up to three “bicchieri” or glasses), but also a general rating of each vintage for the best DOCG wines (Barolo, Barbaresco, Brunello di Montalcino, Chianti classico, Vino nobile di Montepulciano, Amarone) is provided. Other important Italian wine guidebooks do rate each wine, but not vintages as such. For this reason, we chose GR for our exercise. Vintage ratings are given by GR in points ranging from 1 to 5, where 1 is the lowest level, and 5 the highest. The first GR vintage ratings were published in 1989; vintages since 1970 were rated since the beginning. For Barolo and Barbaresco (vintage ratings for the two wines are basically the same, the only exception being 1971, when Barolo vintage was rated 5, and Barbaresco 4), ratings are usually given after three years: for instance, the 1999 issue, written in fall 1998, rated vintages until 1995. This respected the compulsory minimum ageing period of three years for Barolo to be marketed as a DOCG wine (two years are needed for Barbaresco). Nevertheless, the 2000 edition, closed in fall 1999, rates vintages until 1997. It should be noted that in this way ratings are based, apart from general available information on weather conditions, on wine tasting of relatively young wines. Secondly, vintage ratings are rarely revised over time, which means that the increasing available information on actual wine quality is not usually incorporated in ratings.
Parker's ratings are on a scale 1 to 4, and are available since 1957 and until 1993, but many observations are missing in the first years. Wasserman's ratings range from 1 to 12, and go back to 1945, but are only updated until 1990. Since weather data are available from 1970 to 1997, the coverage is not the same for the three series. For this reason, we will examine first separately the three rating systems, and then compare them.
III. Results
A. Gambero Rosso Ratings
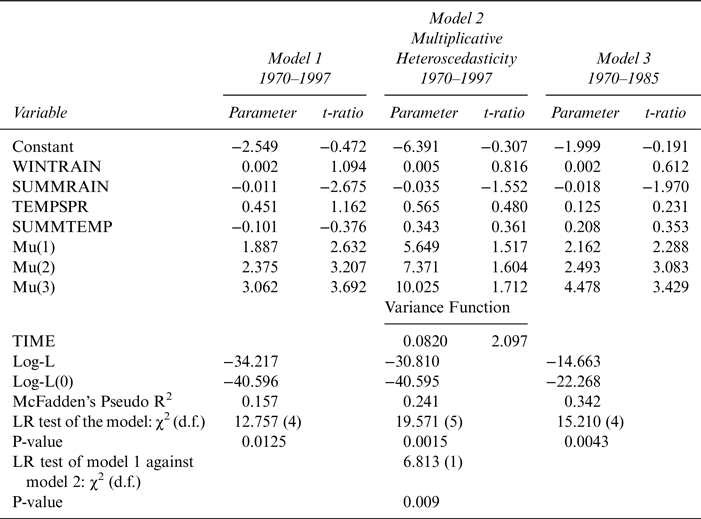
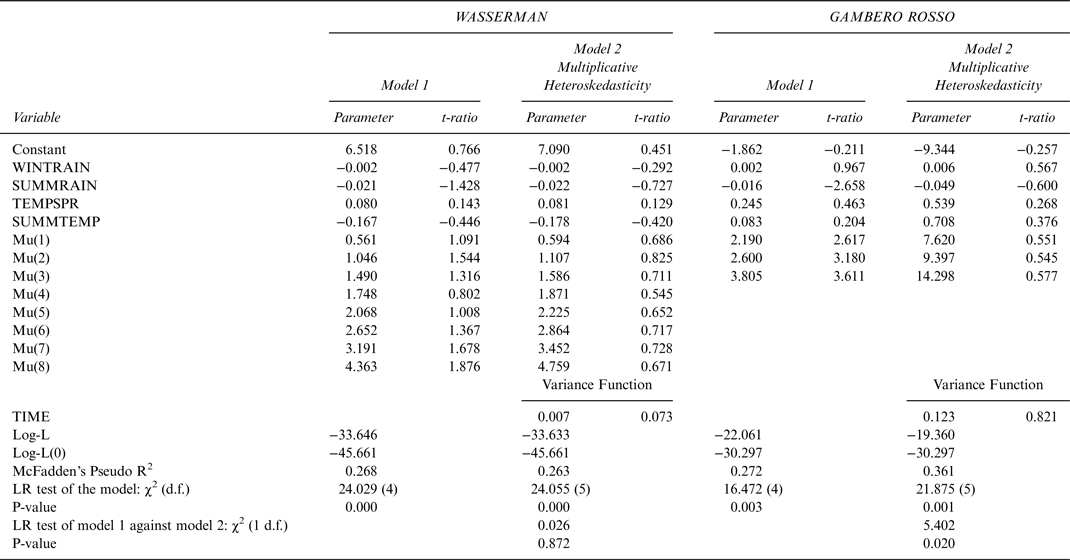
Since ratings are not an ordinal variable, but only indicate a ranking, and they are bounded from 1 to 5, the appropriate model is an ordered probit; Table 1 (first column, Model 1) shows the results of the model estimated from the weather data 1970–1997, where the dependent variable is represented by the GR ratings. The explanatory variables are basically the same as the ones used in Ashenfelter, Ashmore, and Lalonde (Reference Ashenfelter, Ashmore and Lalonde1995): WINTRAIN represents total rainfalls (in millimetres) between October and March of the season preceding the vintage; TEMPSPR is the average monthly temperature (in degrees centigrade) March to July; SUMMRAIN is total rainfalls in August and September; and SUMMTEMP the average temperature in the same months. The model also estimates the underlying implicit threshold values for the different ratings; since there are five different ratings, there are three threshold values.
Results of the Ordered Probit Models for Gambero Rosso Ratings, 1970–1997

Notes: WINTRAIN = total rainfall October–March, SUMMRAIN = total rainfall August–September, TEMPSPR = average monthly temperature April–July, SUMMTEMP = average monthly temperature August–September, TIME = YEAR–1969, Mu(i) = threshold values.
The overall fit of the model can be tested with a likelihood ratio test, which gives a χ2 of 12.757, significant at a 2% level. Nevertheless, the only significant parameters at the conventional levels are the variable referring to summer rainfalls, and the threshold valuesFootnote 5; also, the Pseudo-R2 value (McFadden, Reference McFadden1974) is quite low. The negative parameter of the summer rainfall variable indicates that vintages are rated high when August and September are dry. The other variables are not significant, but the signs indicate that a wet winter preceding the vintage increases the rating, as well as a warm spring. However, contrary to expectations, the summer temperature variable displays a negative sign.
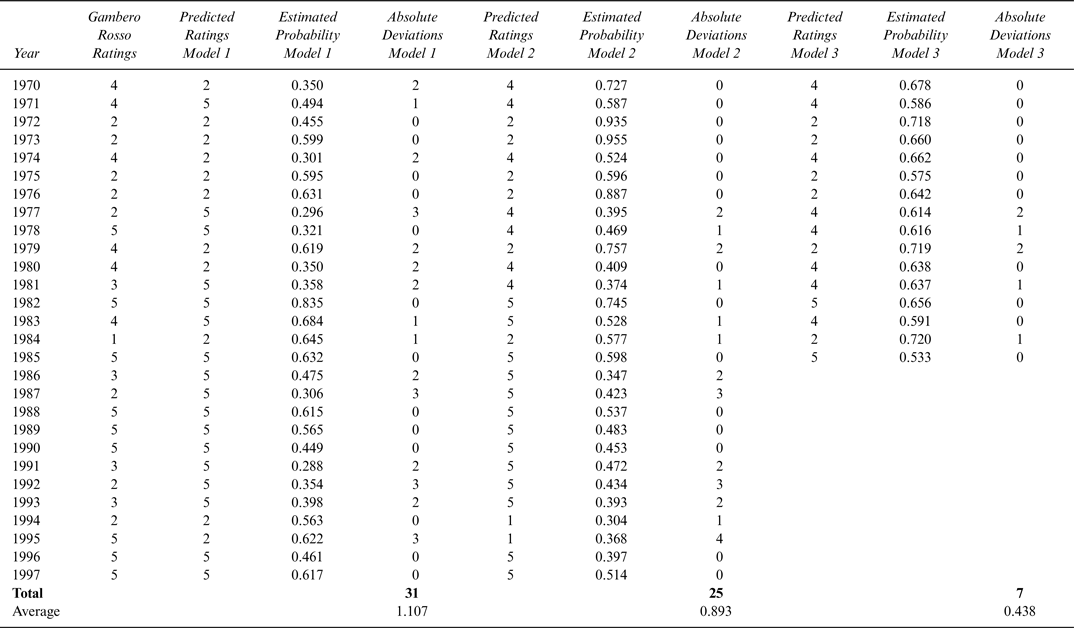
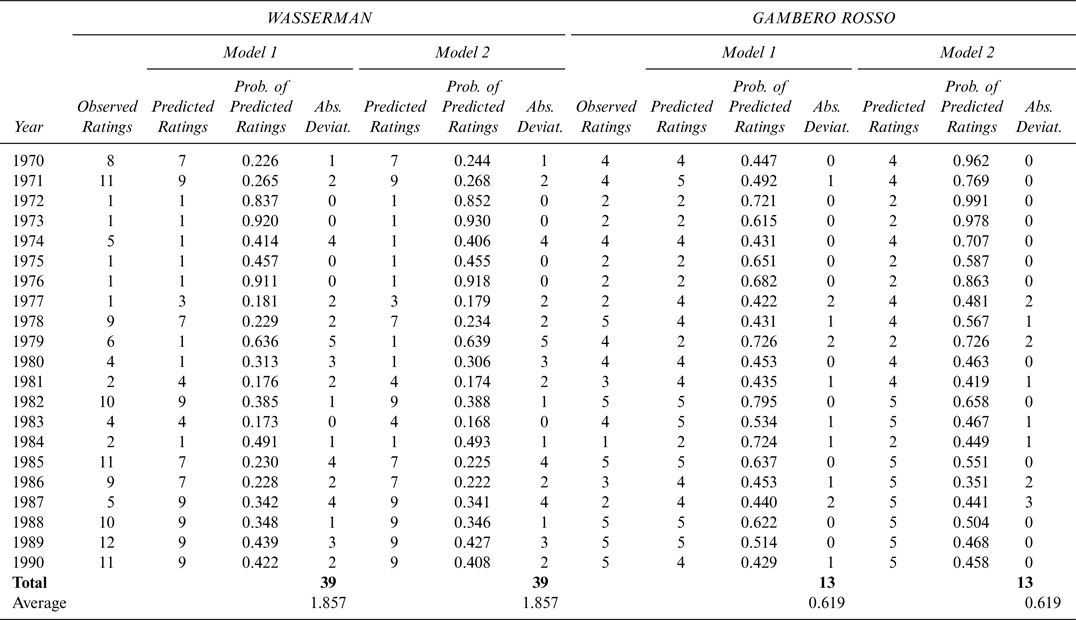
Since the purpose of the model is essentially practical, one might wonder how good is the model in predicting the ratings. This is shown in Table 2, where the observed and the predicted ratings are reported, as well as the probability of the predicted ratings. Predicted ratings are the ones that have the highest probability. Although there is a general correspondence between predicted and observed ratings, it is far from perfect. Observed and predicted ratings exactly match in 13 over 28 years, and on the average the model rates are 1.1 places above or below the observed ratings; in some years the difference is rather strong (e.g., 1977, 1987, 1992, 1995).
Observed and Predicted Vintage Ratings, Gambero Rosso 1970–1997 and 1970–1985

Of course, the limited fit of the model can stem from two opposite reasons: (a) weather data are unable to adequately explain vintage quality; or (b) GR ratings do not appropriately represent actual vintage quality. We can take advantage of other pieces of available information to try to ascertain which is the case. Specifically, we know that GR vintage ratings were first issued in 1989, with ratings starting from 1970. Therefore, unlike in more recent years, at that time information based on actual vintage quality, as revealed by mature wine, was available for more distant vintages. We therefore estimated two further models: the first one is estimated on the same series 1970–1997, and with the same explanatory variables, but with a further assumption of multiplicative heteroscedasticity, that is, that the variance of the random term is an increasing function of the time past from the first vintage.Footnote 6 This is equivalent to assuming that ratings are less and less accurate from the beginning of the series on. The results are reported in Table 1, Model 2. Again, the overall model is significant, now at the 1% level; the Pseudo-R2 value is also higher. Nevertheless, the parameter of the SUMMRAIN variable is now only significant at a 12% level and the threshold variable roughly at the same level or slightly better. The model can be contrasted to the previous one, both with a t-test on the TIME variable of the variance function, and with a likelihood ratio test on the overall model. Both tests reject the restriction implied in the previous model. Moreover, the rating predictions are now more accurate: they exactly match the observed ratings in 15 years, and on the average vintages are rated 0.9 places above or below the observed ones.
Another way to see whether ratings in the first period are more accurate than in the later one is to estimate a model like the first one, but on the 1970–1985 period. The idea here is to estimate a model for which GR vintage ratings were mainly based on the observation of the actual wine quality, since enough time passed in 1989, when the first ratings were published, to allow for tasting mature wines for vintages 1970 to 1985.
The results of this model are reported in Table 1, Model 3. The overall model is significant at the 1% level, and the significant parameters include the summer rainfall variable, and the thresholds; the Pseudo-R2 value is now 0.342. As compared to the model estimated on the 1970–1997 period, in this one all other parameters, although not significant at the usual levels, exhibit the expected signs: as already found by Ashenfelter, Ashmore, and Lalonde (Reference Ashenfelter, Ashmore and Lalonde1995), better vintages are the ones when the preceding winter was wet, spring and summer temperatures were high, and summer was dry. The model estimated on the 1970–1985 period also has much better predictive power (see Table 2): 11 over 16 vintage ratings are exactly predicted, and on the average predicted ratings are 0.4 places higher or lower than the observed ones. Even considering the shorter time span, this represents a dramatic increase in the accuracy of the model.
Both considering the model allowing for heteroscedasticity depending on time, and considering the model estimated on the first period, the conclusion is unavoidable that there is a decreasing correspondence between what weather data would predict and what the GR ratings are.
This conclusion supports the view that GR experts’ opinions, like market prices, do not fully exploit available information: when the relevant information on mature wines is available, ratings do correspond more strictly to what weather data would suggest.
B. Parker Ratings
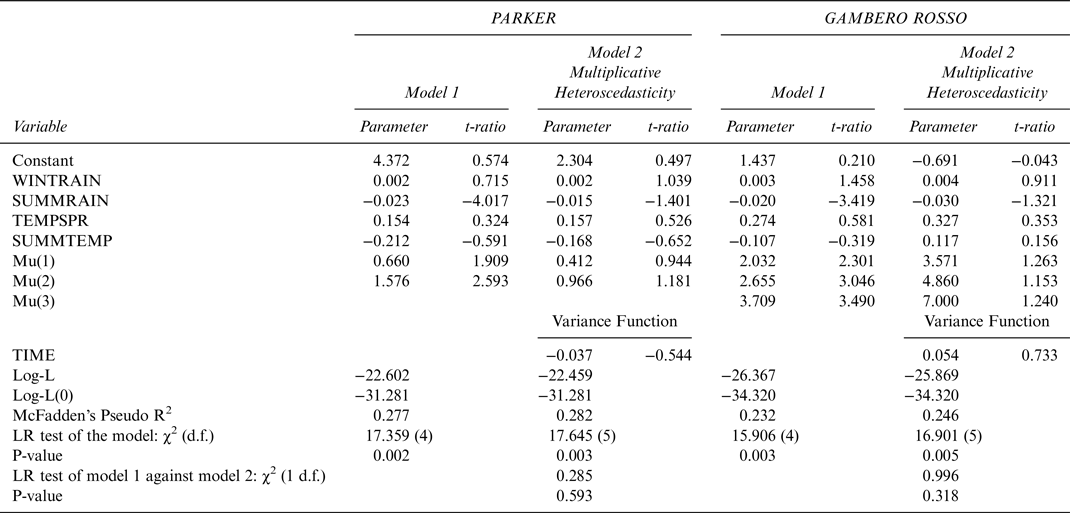
The ordered probit model estimated from Parker ratings for the period 1970–1993Footnote 7 gave the results reported in Table 3, which also reports the same model estimated for the same years with GR ratings, so to allow a comparison. Since PK ratings only range from 1 to 4, there are only two threshold values, as compared to the three for GR. The results for both rating systems are very similar; only the summer rainfall variable, and the thresholds, are significant at the usual values, and the parameter values for summer rainfall are negative for both, as expected, and very similar. The other variables are not significant, but the signs indicate that rainfalls during the winter preceding the vintage increase the rating, as well as a warm spring. Again, contrary to expectations, the parameter of the summer temperature variable is negative.
Results of Ordered Probit Models for Parker and Gambero Rosso Ratings 1970–1993 (1973 Excluded)

Notes: WINTRAIN = total rainfall October–March, SUMMRAIN = total rainfall August–September, TEMPSPR = average monthly temperature April–July, SUMMTEMP = average monthly temperature August–September, TIME = YEAR–1969, Mu(i) = threshold values.
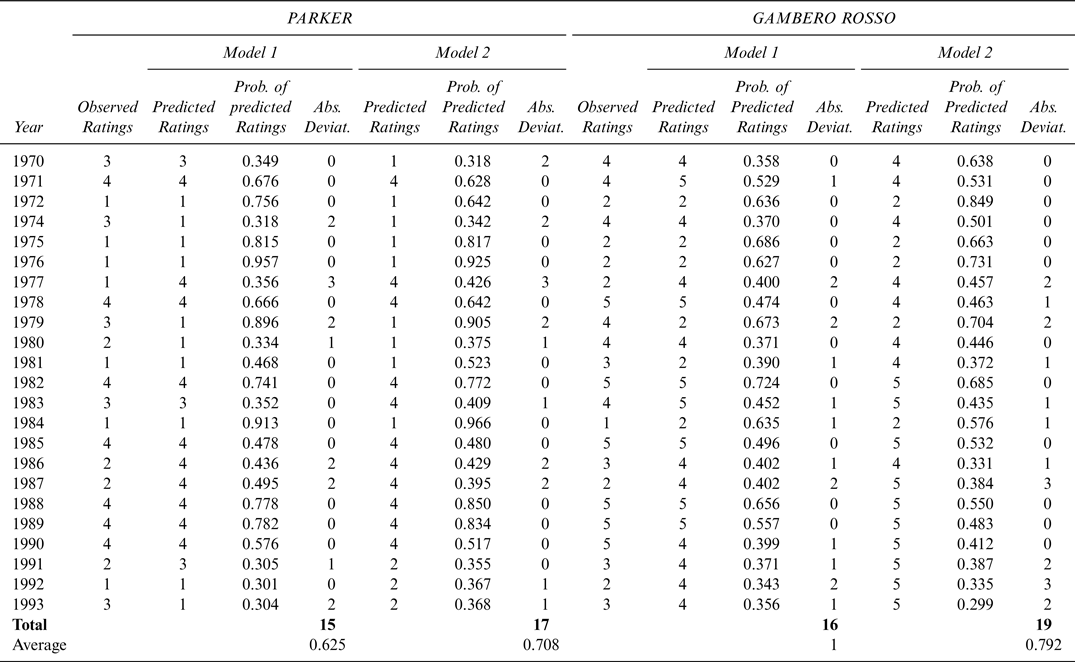
Observed and predicted ratings are reported in Table 4. For the PK model, predicted ratings are equal to observed ratings in 15 years over 23, and on the average the model rates 0.63 points above or below the observed rating; again, 1977, 1979, 1987 are years for which the difference between observed and predicted ratings is strong. For the GR model, 11 over 23 ratings are perfectly predicted, and the average absolute difference is slightly larger (0.67; but the range of ratings is larger, 1 to 5 instead of 1 to 4). Apparently, the overall fit is better for PK than for GR, also considering that both the log-likelihood and the Pseudo-R2 are larger for the former.
Observed and Predicted Vintage Ratings, Parker and Gambero Rosso 1970–1993 (1973 Excluded)

Finally, for both rating systems, a model with multiplicative heteroscedasticity was estimated, but for both likelihood ratio tests and t-tests could not reject the restriction implied in the model without heteroscedasticity.Footnote 8 For GR, since this series is shorter than the previous one, this result is not inconsistent with the explanation given earlier. As to Parker ratings, there is no apparent improvement along time in the correspondence between what weather data would predict and actual ratings.
C. Wasserman Ratings
The series on which a model can be estimated with WW ratings is even shorter, since it only goes from 1970 to 1990. The relevant results are presented in Table 5, along with an ordered probit model estimated on GR ratings for the same period.Footnote 9 Not surprisingly, given the short period and the number of parameters involved, the WW model is overall highly significant, but no parameter is significant at the usual levels (only two thresholds are marginally significant). Nevertheless, the parameter for summer rainfalls has a reasonably large t-value, and has the same sign and magnitude of the corresponding parameter estimated on GR ratings, which is the only significant one, apart from the threshold values.
Results of Ordered Probit Models for Wasserman and Gambero Rosso Ratings 1970–1990

Notes: WINTRAIN = total rainfall October–March, SUMMRAIN = total rainfall August–September, TEMPSPR = average monthly temperature April–July, SUMMTEMP = average monthly temperature August–September, TIME = YEAR–1969, Mu(i) = threshold values.
Predicted ratings, given the larger range, show on the average larger differences, relative to observed ratings, than the other rating systems, since they are 1.9 places above or below the observed ones (Table 6). The largest differences are in years 1974, 1979, and 1987; with the exception of the last one, they are years different from the ones where the largest differences are observed for the other rating systems. In this case, the fit is worse for WW than for GR.
Observed and Predicted Vintage Ratings, Wasserman and Gambero Rosso 1970–1990

IV. A Comparison between Expert Opinions
An interesting issue is detecting whether the experts have a common ground in evaluating vintages, or each of them has specific information and/or evaluation. Of course, a common ground does exist, based on weather data: so the issue is more precisely whether the experts have specific information and evaluation apart from weather data. If they have, their ratings, once the variation due to weather is removed, should be uncorrelated. By contrast, if the ratings, controlling for weather, are still correlated, a common ground does exist: this may be due to a common misperception of actual wine quality, for instance, because experts communicate among them, or because opinions are mutually reinforcing; or, the weather data, as modelled, do not appropriately represent all determinants of wine quality, and some specific, and common to all experts, quality determinant is left out.
After creating a series common to all three rating systems (1970 to 1990, except for 1973), the issue was addressed in two ways. The first one is estimating linear regressions of the different ratings on weather data, and calculating the correlation coefficients between the residuals of the three regressions; this gives an approximate evaluation of how the ratings are correlated, apart from the weather. The relevant correlation coefficients between the residuals are 0.806 between GR and WW, 0.876 between GR and PK, and 0.870 between PK and WW.
The second way is estimating the same ordered probit model for the three rating systems, and calculating a chi-square statistic between the residuals. Theoretically, the residuals are the difference between the ratings predicted by a model including weather variables (which are the common ground for the experts), and ratings predicted by a model without weather variables; since our models only include weather variables, the ratings predicted by a model without weather variables are simply the observed ratings, as they have the highest probability. A chi-square statistic is preferable to a correlation coefficient to measure the association between residuals, because residuals are difference in ordering, and not cardinal values.
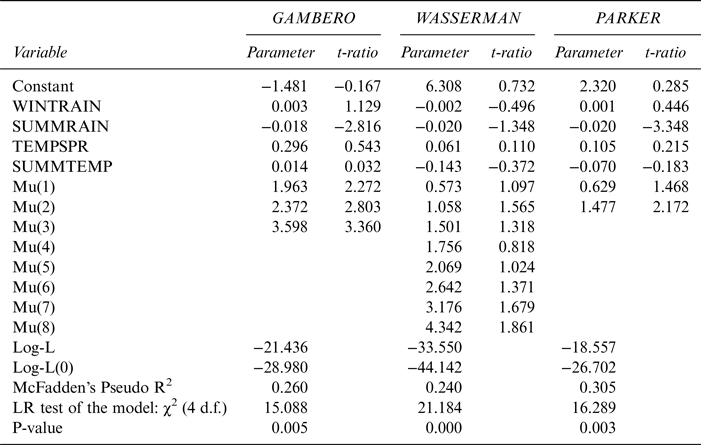
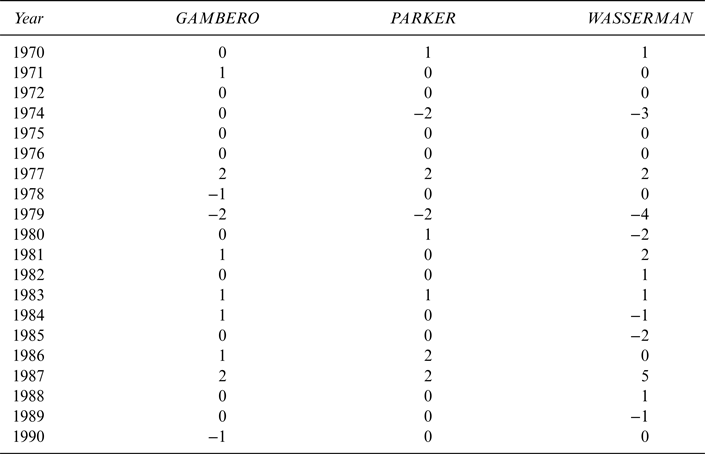
Table 7 presents the results of the ordered probit models estimated for the same years for the three rating systems, and Table 8 the residuals. The results of the ordered probit models are not very different from the ones presented earlier; the only significant parameters for GR and PK concern summer rainfall, while no parameter is significant for WW.Footnote 10
Results of the Ordered Probit Models for Gambero Rosso, Parker and Wasserman Ratings, 1970–1990 (1973 Excluded)

Notes: WINTRAIN = total rainfall October–March, SUMMRAIN = total rainfall August–September, TEMPSPR = average monthly temperature April–July, SUMMTEMP = average monthly temperature August–September, TIME = YEAR–1969, Mu(i) = threshold values.
Residuals of the Ordered Probit Models 1970–1990 (1973 Excluded)

The chi-square test of independence of the residuals gives values of 24.167 (12 d.f.) between GR and PK, 42.071 (28 d.f.) between GR and WW, and 36.190 (21 d.f.) between PK and WW. All values are significant at a 5% level or better.Footnote 11
Both approaches lead to the same conclusion that the hypothesis of independence between ratings of the different systems has to be rejected. Therefore, either the experts have some information in common that is not available to researchers, or they have a common misperception of how weather affects mature wine quality.
V. Summary and Conclusions
Different ordered probit models have been estimated of the influence of weather data on vintage ratings given by different experts. Since all models are overall significant, this shows that weather data actually are among the determinants of vintage ratings, but the only individual weather significant parameter is summer rainfalls, which may indicate that in evaluating vintages all experts attach a particular and overwhelming importance to August and September rainfalls.
The analysis on Gambero Rosso ratings shows a decreasing correspondence between predicted and observed ratings along time. This is consistent with what was found both by Ashenfelter, Ashmore, and Lalonde (Reference Ashenfelter, Ashmore and Lalonde1995) for Bordeaux wines, and by Byron and Ashenfelter (Reference Byron and Ashenfelter1995) for Australian wines: prices in the first years after the vintage over- or under-estimate future prices of mature wines and, since market prices are based on predictions on future wine quality, this means that market operators’ predictions in those periods are not accurate. Much in the same way, qualitative ratings given in the first years after the vintage may not accurately reflect future mature wine quality.
A comparison of the models estimated from different rating systems indicates that the evaluations of the different experts are highly correlated, so that either there is a common information not available to the larger public (researchers included), or there is a common misperception of actual vintage quality, or possibly a self-reinforcing imitation process in giving ratings.
Ashenfelter and Jones (Reference Ashenfelter and Jones2013) showed that expert opinion does not fully incorporate all available information. Expert opinion on Italian wines do not seem to behave differently. Of course, much greater caution is convenient in the case we are examining, because we do not have the counterpart of the “objective” evaluation of quality given by market prices for mature Bordeaux and Australian wines; and our conclusions, therefore, heavily rely on the assumption that weather, as modelled, does determine vintage quality. There is no doubt that weather is a determinant of wine quality, but many other weather characteristics may possibly have an important influence, in particular in connection with plant pathologies. Anyway, if the assumption is true, experts of Italian wines seem to incorporate less of the weather information than their French equivalents: for instance, Ashenfelter and Jones (Reference Ashenfelter and Jones2013) estimated ordered probit models of the ratings given by French experts to Bordeaux vintages, and they found that both average temperature and harvest rain were highly significant determinants of experts’ quality index, while winter rain was marginally significant. By contrast in our estimates winter rain and average temperatures are never statistically significant, and even rain in August and September is not significant in all models. Experts’ ratings of Italian wines seem to keep in mind the overall weather course (as shown by the models being overall highly significant), but not in such a way that the effect of specific characteristics are reflected in statistically significant parameters.