1. Introduction
Air quality regulation is incredibly controversial in developing countries. Emerging evidence from Latin American countries such as Mexico is that the consequences of poor environmental quality on health are severe (Gutierrez, Reference Gutierrez2015; Arceo-Gómez et al., Reference Arceo-Gómez, Hanna and Oliva2016). Yet the costs of improving environmental quality are perceived to be very high for rapidly urbanizing economies. Consequently, whether the average citizen is willing to pay for air quality improvements remains an open question. In this article, we provide an estimate of the benefits of improving air quality in a developing country context. The hedonic housing price method gives us one such opportunity to find evidence on whether the average citizen is willing to pay for air quality as measured by housing prices.
In particular, we study whether residents of Mexico City are willing to pay for air quality. Evidence on willingness to pay for air quality in developing countries is scarce due to data limitations. On the other hand, one cannot rely on estimates from the vast literature on hedonic studies in developed countries. Differences in average population, facing distinct trade-offs between pollution reduction and higher incomes, and access to information due to political-economy reasons, imply that hedonic price estimates from developed countries do not provide any indication of whether willingness to pay is positive, and by how much, in the developing world. Akin to densely populated developing cities, the real estate market in Mexico City exhibits a very wide range of price brackets as a result of substantial pressure on residential space and considerable wealth inequalities among its residents (Ribardière and Valette, Reference Ribardière and Valette2017).
This article makes three significant contributions. First, it provides early evidence on willingness to pay for air quality in a developing country context and for Latin America in particular. Second, we exploit panel data techniques that allow us to control for omitted variable bias in contrast to the few other studies in similar settings. We allow for sorting based on average zip code pollution levels and zip code by year pollution levels in our empirical model. In addition, we match the zip codes with census data on neighborhood characteristics and economic conditions that might influence both pollution and land value. We are able to utilize our measure of land value (as described below) to our advantage as the endogeneity problem of simultaneously choosing the plot of land along with its associated environmental amenities does not arise when there are no real transactions. Third, we present estimates of willingness to pay for a rich set of pollutants including PM2.5, which is important but understudied.
We model value of land available at the level of zip codes in Mexico City and over the years from 2006 to 2013. Our measure of land value is based on assessments that utilize contemporary real estate listings of properties without any built structure in the same zip code. According to Freeman (Reference Freeman2003), location specific attributes such as air quality are not part of the structure and its value should be reflected in the price of land alone. Admittedly, our measure is not based on market transactions or sales. These assessments are based on real estate listings of nearby properties or empty lots that follow standard methodology capturing the locational aspects of the property such as neighborhood and amenities like air quality.
Our results suggest that air quality improvements in PM10 are equivalent to a marginal willingness to pay (MWTP) up to US$2.61 per m2. Based on an average land area of 88.8 m2 for properties in Mexico City in the period 2006–2013, such improvement would translate into an MWTP of US$231.77 per property.Footnote 1 This estimate is almost six times the magnitude found in the only other comparable study in Mexico City. In alternative specifications, the magnitude of difference increases to almost ten times. Our elasticity estimates are also within the range of −0.20 and −0.35 found in Chay and Greenstone (Reference Chay and Greenstone2005) for total suspended particulates in US cities in the decade of the 1970s. The comparison is meaningful as the income per capita in the US in the 1970s was similar to that in Mexico City during the period 2006 to 2013 considered for our estimations.Footnote 2
In section 2, we describe air quality in Mexico City, followed by a description of the hedonic price model in section 3 and empirical evidence from developed and developing countries. Next, we describe the data in section 4, and then present the empirical approach in section 5, followed by discussions of our results and robustness checks in section 6. Section 7 concludes.
2. Air quality in Mexico City
Mexico City comprises 16 municipalities with a total of 8,851,000 inhabitants and generates 17.03 per cent of Mexico's gross domestic product. Taking into account suburbs and neighboring municipalities of nearby states, the Mexico City metropolitan area is the most populated region in Mexico, with 20,116,842 inhabitants.Footnote 3 The impact of population and economic activity are factors that partially determine pollution concentrations in Mexico City. For example, transportation is the primary source of pollution for carbon monoxide and nitrogen oxides, while the industrial, commercial and residential sectors combined generate the largest share of particulate matter and volatile organic compounds (SEDEMA, 2016a). In addition, Mexico City is located in a zone conducive to the prevalence of pollution. According to Molina and Molina (Reference Molina and Molina2004), altitude, solar intensity, and topography contribute to the formation of ozone and trap pollutants that reduce air quality in Mexico City.
In this article, we collect data on four criteria pollutants: PM10, particulate matter smaller than 2.5 micrometers (PM2.5), sulfur dioxide (SO2), and ozone (O3). The four different pollutants are not only amongst the most prevalent in Mexico City, but they also vary in terms of their primary source of pollution, perceptibility and health impacts. The hourly monitoring data comes from about 29 monitoring stations (depending on the pollutant reported) under the Automatic Air Quality Monitoring Network (called RAMA in Spanish). Residents of Mexico City have access to hourly air quality monitoring called the Metropolitan Index for Air Quality (IMECA). Whenever the ‘Bad Air Quality’ threshold level is reached, the government recommends that children, the elderly, and sensitive populations not engage in outdoor activities. This information can be accessed online and updated every hour indicating the maximum recorded value of a pollutant for each region in the city.
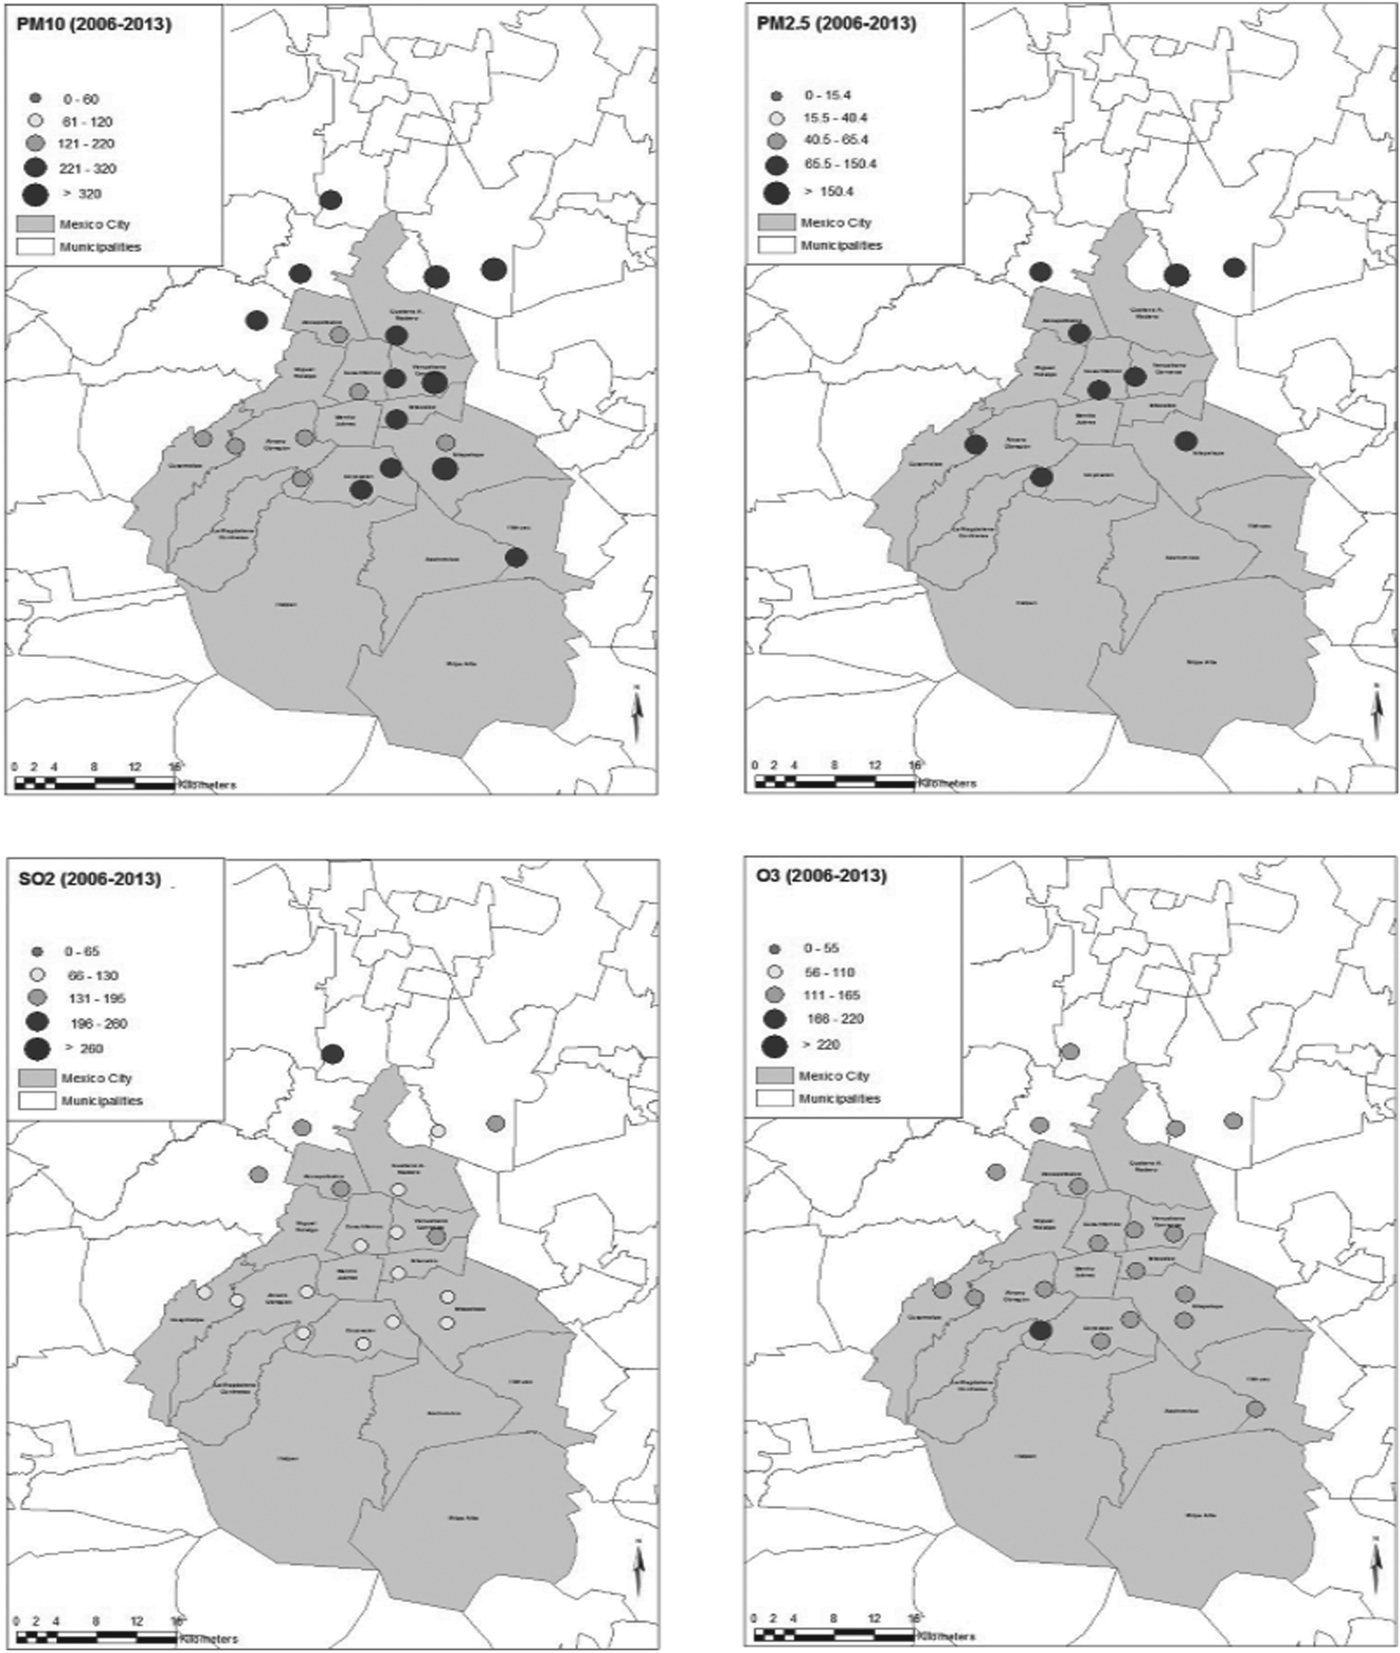
In terms of trends over time, all four pollutants witnessed significant reductions from their 1988 levels (SEDEMA, 2016b). However, beyond 2000 – and particularly for the period of our analysis (2006 to 2013) – except for SO2, there has been no declining trend. Figure 1 shows that pollution is not homogeneous in Mexico City due to different atmospheric conditions that each zone presents and the distance to pollution sources (factories or transportation). In general, there are higher levels of pollution in the north of the city compared to the south. The highest SO2 concentrations are measured in the northwest area of the city where the largest industries are located. Particulate pollution concentrations are highest not only in industrial and high traffic regions but also in areas with windblown dust regions like the northeast. O3 concentrations are highest in the southwest, primarily due to the prevailing northerly winds that transport pollutants to the south.
Air quality distribution across monitoring stations in Mexico City
3. Hedonic housing price model
The hedonic price model is an indirect valuation method that allows one to assess the value of a good that does not have an explicit market, such as air quality. Rosen (Reference Rosen1974) is one of the first authors to describe the hedonic price model. When looking at the transactions in a market with differentiated goods, the value of the underlying characteristics of the good can be estimated.
In this section, we present a brief discussion of Freeman's (Freeman, Reference Freeman2003) description of the hedonic model, as applied to the housing market. An individual's utility is a function of consumption of a composite commodity X, a vector of location-specific environmental amenities Q, a vector of structural characteristics of the house S, and a vector of characteristics of the neighborhood in which the house is located denoted by N. Hence, the utility of an individual who occupies house i is given by
 $$U=U(X,Q_i,S_i,N_i).$$
If preferences are weakly separable in housing and its characteristics, the demand for those housing characteristics are independent of the prices of other goods. The individual maximizes U(·) subject to the budget constraint
 $$M-P_{hi} -X=0,$$
where M represents income, and X is the composite good. The hedonic price function P h (·) is estimated for an urban area under the assumption that it can be treated as a single market for housing services. In other words, buyers (and sellers) have full information on all alternative choices and are free to choose a house anywhere inside the urban area. The estimation of the hedonic price function requires an additional assumption that the housing market is in equilibrium; that is, that all individuals have made their utility-maximizing choices given the housing prices and that the existing stock of housing alternatives is cleared.
 $$P_{hi} =P_h (S_i ,N_i ,Q_i).$$
Hence, the price of the ith residential location can be expressed as a function of the structural, neighborhood, and environmental characteristics of that location. As Freeman (Reference Freeman2003) points out, estimating the hedonic price function using actual sales prices of individual houses, along with relevant characteristics, requires the strong assumption that buyers and sellers have full information on willingness-to-pay and willingness-to-accept offers of other potential buyers and sellers. An alternative source of property value data would be professional appraisals of individual properties for taxation or other purposes (mortgage statement). As we will discuss later, we used third party neutral assessments provided by experts for our present purposes. This measure allows us to estimate the relationship between cleaner air and value of the land (on which the structure stands). Specifically, we can assign the impact of pollution without the confounding effects of the structural characteristics of the house, not to mention controlling for household characteristics of buyers.
Despite its limitation of not using real market transactions, we are able to use these assessments to mitigate the problem of endogeneity of current pollution in the hedonic models (a common econometric problem leading to perverse signs, etc.). The problem of endogeneity does not arise in our econometric framework as no buyer is making the simultaneous decisions of choosing the property as well as pollution as revealed by the purchase price.
By and large, we consider Mexico City as a single housing market because the buyers do not experience any barriers blocking access to housing markets throughout the city. However, when studying the causality of pollution levels on housing prices, one must address the problem of sorting (by households) based on average housing prices, as pointed out in (Kuminoff et al., Reference Kuminoff, Smith and Timmins2013, section 4.6). Estimation of a single hedonic price function, over time, makes the assumption that endogenous amenities such as neighborhood socioeconomic characteristics (rich people migrating away from polluted neighborhoods) do not change substantially in order to estimate the same hedonic gradient. Our empirical models allow for income-based sorting by including zip code by year interactions that control for demographic changes in response to changes in annual pollution levels within zip codes. Longer-term sorting in response to variations in zip code-specific levels of pollution are subsumed by the time invariant zip code fixed effects.Footnote 4
3.1 Hedonic price estimates in developed countries
There is a broad literature that assesses the effect of air quality on housing prices in developed countries like the United States using the hedonic pricing approach. Traditional hedonic models that focus at the individual, house, or property level have often found surprising results of higher pollution driving up housing prices, or no impact of pollution in the vicinity on house prices (Smith and Huang, Reference Smith and Huang1995; Zabel and Kiel, Reference Zabel and Kiel2000). Neighborhood characteristics such as per capita income affect both pollution and housing values. Higher per capita income drives up the demand for environmental quality; hence, it exerts a downward pressure on pollution and drives up housing prices. Such omitted/unobserved variables can lead to biased estimates of the effect of local pollution on house prices. These biases might be ‘fixed’ or unchanging over time which can be differenced out by looking at the effect of change in pollution on change in housing prices (Hanna, Reference Hanna2007). Bajari et al. (Reference Bajari, Fruehwirth, Kim and Timmins2012) argue that fixed effects may mitigate omitted variable bias in the presence of time invariant observables when panel data are available. However, this approach does not address time-varying factors that affect both pollution and house prices.
Chay and Greenstone (Reference Chay and Greenstone2005) use a panel of counties in the United States to estimate the impact of changes in exposure to total suspended particulate matter (TSP) pollution on housing values. To solve the omitted variables problem, they use an instrumental variable approach in which they consider the 1970 Clean Air Act's nonattainment status designation for each county as the source of exogenous variability of pollution. According to their estimates, a variation of 1 μ g/m3 of particulate matter causes an increase of 0.2 to 0.4 percentage points in the average value of houses, which is a higher value than the ones estimated before.
The study by Leggett and Bockstael (Reference Leggett and Bockstael2000) on water pollution is one of the few that estimates a separate regression for the value of land defined as a ‘residual’ of the total price of the house minus the value of the structure. It is one of the earliest studies that investigate the relative elasticities of market price and the price of land by estimating two dependent variables. Their data permitted them to model market price minus the assessed value of structure and the market price as a check for the validity of their assumption. The dependent variable of interest was based on the additive nature of the value of structure and value of land that is implicit in the tax assessor's appraisal scheme. Under this assumption, the assessed value of the structure can be subtracted from the market price to yield a ‘residual’ land price. They find only marginally higher coefficients on the land price estimations compared with the market price estimations.
3.2 Hedonic price estimates in developing countries
Yusuf and Resosudarmo (Reference Yusuf and Resosudarmo2009) discuss how housing markets in developing countries particularly suffer from information problems and price stickiness, among other things. The authors use hedonic prices to estimate the importance of air quality for the residents of Jakarta, Indonesia. They consider the presence of spatial effects that influence house values, such as distance from the district center. The authors conclude that the value per household from a 1 μg/m3 reduction in SO2 concentrations is US$28.00, which is a relatively small amount compared to other developed countries. Won Kim et al. (Reference Won Kim, Phipps and Anselin2003) perform a hedonic model for Seoul, and they conclude that SO2 levels have a significant effect on house prices. Their estimate of MWTP for a small change in air quality (a permanent 4 per cent improvement in mean SO2 concentrations) is about US$2,333, or 1.4 per cent of the mean housing price.
Carriazo et al. (Reference Carriazo, Ready and Shortle2013) develop a hedonic price approach to estimate the value for an improvement in air quality in Bogota, Colombia, on rental property values. Their principal contribution is that they account for the bias due to correlation between asymmetrically distributed unmeasured quality attributes of residential properties and the environmental quality attribute of interest. They find that the price elasticity for air quality is 25 per cent higher in the OLS specification than in their model with asymmetric random errors. This implies that an omitted variable bias in conventional hedonic models leads to the marginal value of air quality to be overestimated.
Using information on a cross section of individual housing sales between January 2003 and May 2004 from the three metropolitan areas of Guadalajara, Mexico City and Monterrey, Gonzalez et al. (Reference Gonzalez, Leipnik and Mazumder2013) determine whether residents care about air pollution in Mexican cities. The authors investigate pollution from particulate matter smaller than 10 micrometers (PM10), which they justify as the most visible pollutant.
Gonzalez et al. (Reference Gonzalez, Leipnik and Mazumder2013) exploit the seasonality of particulate matter (PM10) pollution to use seasons as an instrument for the potentially endogenous PM10 concentrations. PM10 measurements are higher in the dry season, such as winter, due to higher resuspension of PM10. Hence, home owners who made property visits in the winter experienced a higher level of pollution in contrast to those who made property visits during the rainy season. Also, the validity of the instrument depends on the assumption that buyers have no ability to take seasonality into account. Household data on income, number of dependents, age, education and type of employment of head of household making the purchase are included to proxy for neighborhood characteristics. They find a house price–pollution elasticity of −0.07 for Mexico City and Monterrey and −0.05 for Guadalajara, implying that a one-unit reduction in PM10 levels is valued per property at US$43.47 in Monterrey, US$41.73 in Mexico City and US$36.34 in Guadalajara.
Rodriguez-Sanchez (Reference Rodriguez-Sanchez2014) estimates that a household head in Mexico would pay at least US$46.90 (constant year 2000 dollars) for a one-unit reduction in particulate matter emissions per year. They incorporate migration or mobility costs into the hedonic approach by using a residential sorting model. They estimate a two-stage model. In the first stage, a discrete choice model to obtain the probability that a person chooses to live in any location or state depends on migration costs, income that an individual could have earned in any location, and the quality of life in every location. In the second stage, these location-specific effects (or quality of life) are regressed on air pollution concentrations to recover the willingness to pay for air quality across states in Mexico. Crime per capita, employment rate, government expenditure per capita, population, life expectancy, rankings of art, and number of firms in state are among the other variables considered in this modified hedonic regression.
As Gonzalez et al. (Reference Gonzalez, Leipnik and Mazumder2013) point out, hedonic methodology applied to developing countries is rare, especially in Latin American countries. We hope to fill a gap in this literature; specifically, for one of the most polluted cities in Mexico. In a typical developing country context, lack of information regarding the spatial distribution of air quality within a region means that willingness to pay estimates for improved environmental quality should be lower than in developed countries. However, due to the awareness of Mexico City's inhabitants regarding the high pollution levels, together with the relatively high income per capita for a developing country, this prediction may not be verified. A significant finding on the influence of local pollution on housing values would imply that average willingness to pay for air quality is positive for rapidly urbanizing cities like Mexico City.
4. Data
In this section, we describe our dataset on the dependent variable of value of land, our primary explanatory variables of measures of air pollution, and controls for time varying neighborhood variables.
4.1 Land values
The dependent variable of interest is the mean value of land (per square meter) by zip code and quarter for the years 2006–2013. We consider zip code level variability to more accurately capture variations in exposure to ambient air pollution in contrast to individual housing levels. We obtained data from external appraisals in Mexico City, gathered and published by the Federal Mortgage Association (Sociedad Hipotecaria Federal or SHF) where each appraiser must be registered. For each house, the appraiser estimates both the value of the land (details below) and that of the structure, considering its characteristics and location. Information on the type of property (houses, apartments, condos, and empty lots) and location (central, intermediate, peripheral, extension zone, or rural) – described as the proximity reference of the property – are also recorded at the time of assessment.Footnote 5 The values are deflated with Mexico City's December 2010 consumer price index. Of the total number of zip codes in Mexico City (1445), on average about 53 per cent had land value assessments; that is, an average of 771 zip codes over the 2006 to 2013 period.
These land parcels with structures or empty lots are appraised for purposes of obtaining mortgages to finance purchase of houses and land (empty lots). When appraising land parcels, contemporary real estate listings of comparable properties, i.e., empty lots without construction, are adjusted for factors such as location relative to predominant street and hidden or corner plots, and surface features such as area and shape. If land parcels without construction are not available in the same zip code or in adjacent areas, the observed market prices of nearest available empty lots within the same municipality are considered for the final (adjusted) price calculation. We appeal to analysis in Gray and Shadbegian (Reference Gray and Shadbegian2004) to argue that the errors in measurement introduced by appraisers are likely random (the process outlined above). The authors address potential endogeneity problem of socio-demographics of residents located in the immediate vicinity of industries (i.e., rich moving out of polluted neighborhoods) by exploiting the spatial dimension of variations in pollution, i.e., the impact of pollution declines with increasing distance. Gray and Shadbegian (Reference Gray and Shadbegian2004) utilize ‘spatially-lagged’ instruments by capturing socio-demographic characteristics of people living between 50 and 100 miles away from industries. The appraisers of the national credit institution go through a similar process of assigning land values from comparable lots that are exposed to similar levels of air quality as the piece of land being assessed.
Our data shows that the average land value for the observed quarters in Mexico City is $5,494 per m2 (2010 pesos) or US$435. Also, most of the properties are apartments (52.9 per cent) although there are many houses (28.59 per cent) and condominiums (14.22 per cent). Regarding the location category, most of the observations are considered as having an intermediate location (45.82 per cent), with the remaining coming from central (28.82 per cent) and peripheral (23.88 per cent) locations. Since both the type of property and the location matters for assessing the land value, the panel variable considers the average value at zip code level for the same type of property and location. The real estate stock of Mexico City exhibits considerable heterogeneity with house sales significant in the wealthy intermediate locations in the west for example, while apartments and condominiums for sale are more predominant in the central locations (Ribardière and Valette, Reference Ribardière and Valette2017).
4.2 Pollutants
The information on pollution levels in Mexico City comes from the Automatic Air Quality Monitoring Network (in Spanish, Red Automática de Monitoreo Atmosférico or RAMA), which consists of several monitoring stations that report pollution concentrations every hour. Each zip code in the sample is matched with the monitoring stations that are located within 3 km (from the centroid of each zip code) for estimating the pollution level that the population might be exposed to.Footnote 6 Quarterly zip code level exposures based on maximum values were calculated for the different pollutants reported from the hourly measurements. To assign a level of pollution for each zip code, a measurement from each nearby monitoring station was weighted by its inverse distance to give higher weights to the nearest stations.
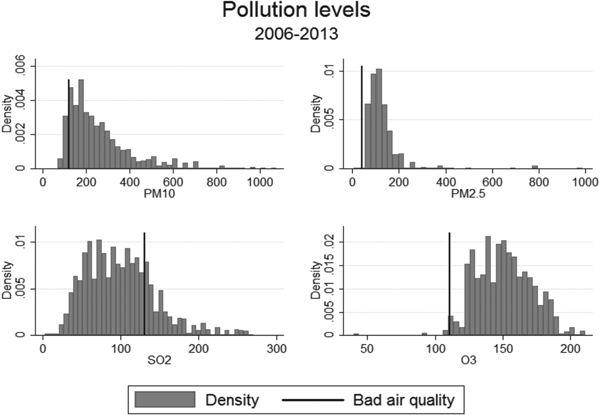
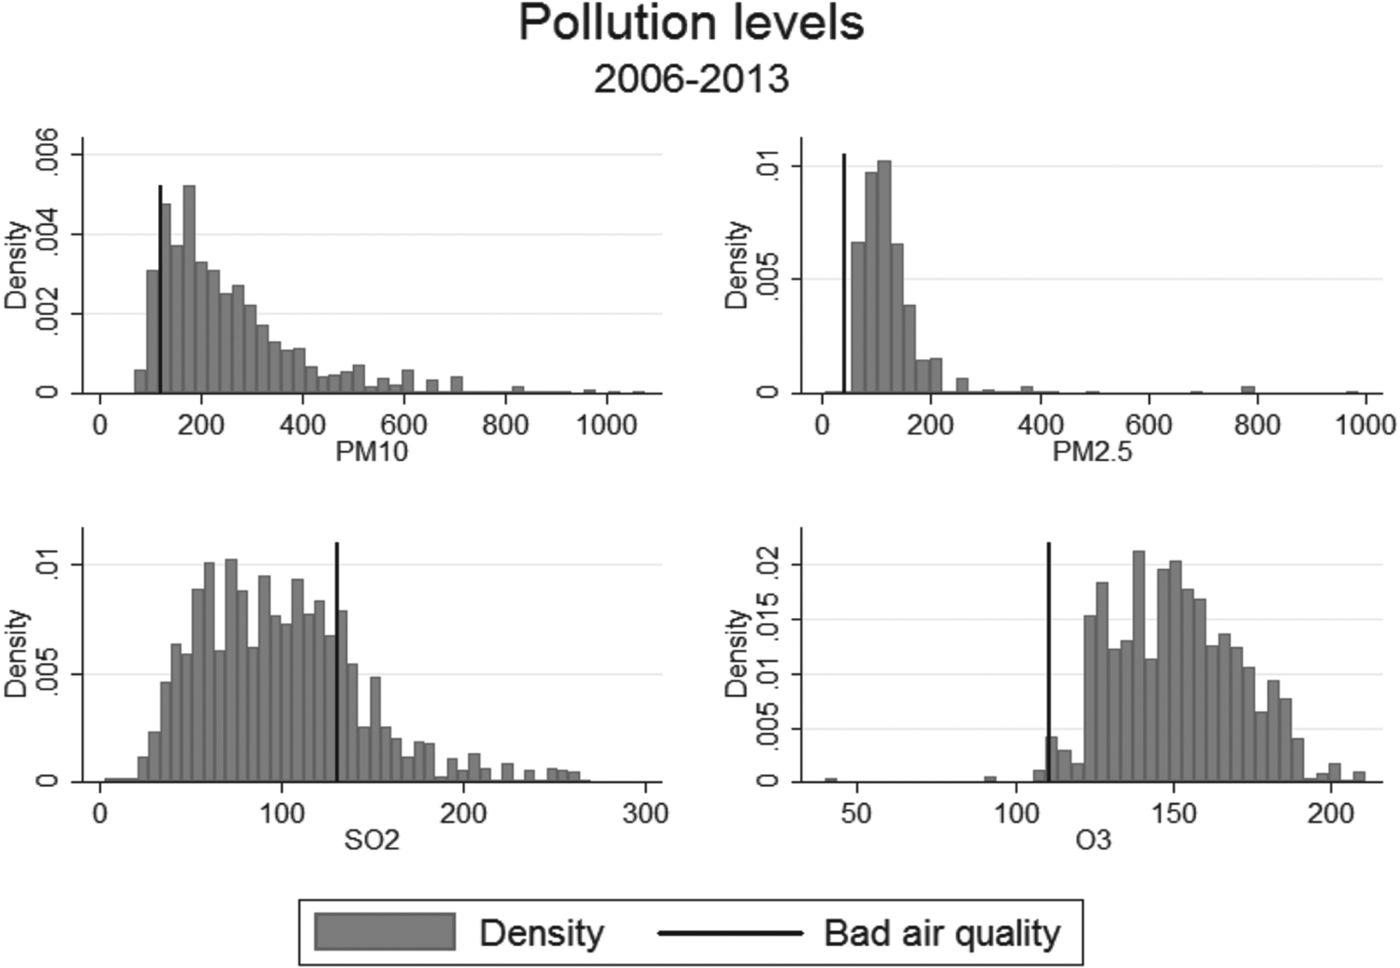
Figure 2 shows the maximum values recorded for each pollutant in Mexico City. We consider four pollutants: O3, SO2, PM10, and PM2.5, which are the most prevalent during the period. ‘Bad air quality’ refers to ambient concentrations above 120 micrograms per cubic meter of PM10 (24-h moving average), 40.4 micrograms per cubic meter of PM2.5 (24-h moving average), 130 parts per billion of SO2 (24-r moving average), and 110 parts per billion of O3 (hourly average). Whenever any of these threshold levels are exceeded, the government recommends that children and older people not perform outdoor activities. Figure 2 shows that quarterly zip code level exposures were particularly high for PM10, PM2.5, and O3.
Maximum recorded values of pollutants
4.3 Neighborhood characteristics and local economic conditions
As mentioned before, omitted variable bias poses one of the main obstacles to obtaining reliable estimates from hedonic specifications. To reduce this bias, all of our regressions include zip code fixed effects that control for all zip code time-invariant factors. In addition, we include time varying neighborhood socioeconomic characteristics and proxies for local economic conditions, as they are likely to influence both housing values and pollution levels. To capture socioeconomic characteristics, we include census data from the years 2005 and 2010, available at the AGEB level.Footnote 7 AGEBs are small urban areas (more than 2,500 inhabitants) with relatively homogeneous socioeconomic characteristics. We associate each AGEB to a zip code according to the centroids of both polygons. We construct a zip code level measure for socioeconomic characteristics by considering all AGEBs that are within one mile of each zip code centroid.
Mexico's censuses do not ask questions about income (and/or poverty) directly. Hence, we include proxies for income or socioeconomic status like percentage of houses with drainage and electricity, percentage of houses with three or more rooms, education levels such as number of years of study, and access to formal social security. Number of inhabited houses and population density are also likely to be related to socioeconomic status of the local population. A higher proportion of unoccupied housing and lower population density might be related to poorer economic conditions. Finally, to capture local economic conditions, we consider the total number of economic units or establishments in each zip code. We use the number of firms by major economic activity category (manufacturing, services, and business) at the AGEB level, obtained from the economic censuses of 2004 and 2009.
The resulting final dataset is an unbalanced panel of 449 zip codes from the first quarter of 2006 to the last quarter of 2013. Table 1 presents the summary statistics of the regression sample for the dependent and independent variables as well as the controls for neighborhood socioeconomic characteristics and number of economic units.
Variables and descriptive statistics for regression sample
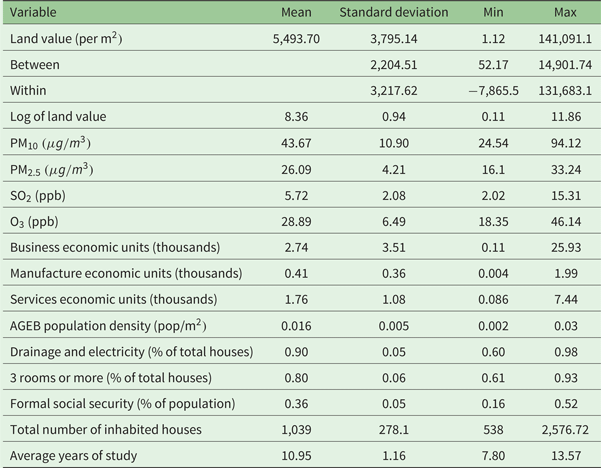
Notes: μ g/m 3 stands for micrograms per cubic meter, and ppb stands for parts per billion.
5. Empirical approach
In our model, we use quarterly average land values at zip code level for the period 2006–2013. We estimate the model presented below for zip code average land values; that is, the average taken across all types of properties and zonal locations.Footnote 8 The equation estimated is:
 $${LV}_{t,z} =\alpha_z +\beta_{1} {\rm Poll}_{C,z} +\beta_{2} S_{SC,z} +\beta_{3} EU_{EC,z} +\delta _Q +\rho _Y +u_{t,z},$$
where LV represents the average land value, for each zip code, z and quarter t. Based on findings of Cropper et al. (Reference Cropper, Deck and McConnell1988), the dependent variable is log transformed. The zip code fixed effects (αz) control for all time invariant factors that explain some of the variations in land values assessments. The time invariant component of traffic flows, which is a consequence of infrastructure in different parts of the city, is a location-specific aspect that is subsumed by the fixed effects. For example, a household living near a major freeway is likely to experience high traffic flows all year round. Wind direction, speed, and other weather conditions that affect the final exposure to ambient pollution are also captured by the location fixed effects and seasonal controls. For example, a household in the north of the city is likely to experience high PM exposure. On the other hand, a household in the southwest will have high O3 exposure as the northerly wind blows pollution in its direction.
Poll C, z is the average level of pollution weighted by the inverse distance of the nearest monitoring stations to the zip code and for the current quarter t to three quarters ago t − 3, denoted by C. We use the four quarter moving averages to focus on longer-term pollution measurements, as opposed to just one quarter.Footnote 9 We estimate separate regressions for the four pollutants considered, as each one of the individual pollutants is likely to be highly correlated with the other pollutants considered. But more importantly, different pollutants may be distributed in a distinct manner as discussed in the section on air quality in Mexico City. Importantly, we consider average pollution concentrations, which means that our estimates are conservative as opposed to considering the maximum recorded values of different pollutants.
S SC, z is the vector of socioeconomic controls assigned to zip code z and obtained from the 2005 and 2010 population censuses, denoted by SC. For the period 2006 to 2010, we associate variables corresponding to the 2005 census; for the period 2011 to 2013, we associate the 2010 census variables. EU EC, z is the vector of controls for local economic conditions: the total number of firms by manufacturing, services, and business establishments for zip code z; it is based on the two economic census years 2004 and 2009, denoted by EC. For the period 2006 to 2010, we associate variables corresponding to the 2004 economic census; for the period 2011 to 2013, we associate the 2009 economic census variables.Footnote 10
We lag local neighborhood characteristics to address sorting: i.e., contemporaneous land values and community characteristics are simultaneously determined.Footnote 11 For example, higher land values lead to the poor moving out and consequently lower contemporaneous income prevalent in the community. If the socioeconomic data is from a time period prior to when the land values are recorded, then at least they are exogenous to current land values. Similarly, we lag our proxies for local economic conditions as they might be correlated with pollution from industries or transportation.
The annual dummy variables or year fixed effects (ρY) are included to control for differences from one year to the next that are unexplained or not controlled for in the model. Similarly, we include quarterly or seasonal dummy variables (δQ) to control for seasonal variations in the housing market.
Lastly, the error term is likely to exhibit serial correlation as land values assessments within the same zip code are likely to be correlated from one quarter to the next. Following Cameron and Miller (Reference Cameron and Miller2015), we present our results with standard errors clustered at the municipality level, which is more aggregate; that is, at a higher level than the zip code, to control for arbitrary spatial correlation. In other words, land values within the same municipality are likely to be correlated because of similar location and regulatory features.Footnote 12
6. Results
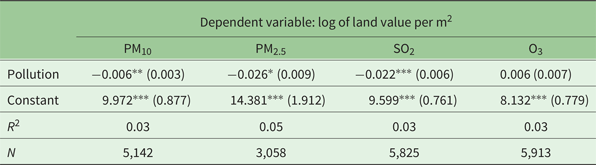
Table 2 presents the results of the log of quarterly zip code average land value assessments regressed on quarterly average pollution observed in the same zip code, and controls for socioeconomic characteristics, local economic conditions, and seasonal and yearly dummies. Our dependent variable is averaged over property type and zonal category; that is, we generate a single observation: the zip code average land value for each quarter for which there is data. We include zip code fixed effects and cluster standard errors at the municipality level. The negative coefficient on the pollution variable shows that higher pollution has a downward impact on zip code average land assessments.
Estimated coefficients with zip code fixed effects
Notes: Robust standard errors clustered at the municipality level in parentheses. Asterisks ***, **, and * denote significance at 1, 5, and 10%, respectively. All regressions include controls for socioeconomic characteristics and local economic conditions, zip code fixed effects, yearly and seasonal dummies.
The coefficient in column 1 of table 2 can be interpreted as a 1 microgram per cubic meter increase in PM10 leads to a decline in land values by 0.6 per cent. Evaluating this estimate at the average land value of US$435 per m2 in Mexico City, one can express the MWTP for lower PM10 pollution as US$2.61 per m2. Our per m2 estimate translates into US$231.77 per property based on the average exchange rate of 12.64 pesos per dollar in 2010 and the average land area of 88.8 m2 in Mexico City's properties throughout the period. Our point estimate is almost six times as much as the magnitude found in Gonzalez et al. (Reference Gonzalez, Leipnik and Mazumder2013).
Although the 95 per cent confidence interval in some of our specifications includes the point estimate in Gonzalez et al. (Reference Gonzalez, Leipnik and Mazumder2013), we believe that several reasons may be behind this difference, aside from our strategy to address omitted variable bias exploiting the panel nature of the dataset in our study. (1) Our study considers an eight-year period between 2006–2013 in which Mexico's City population became richer and environmental issues became more salient through different media compared to 2003–2004. (2) Our dataset includes both used and new homes of different types whereas Gonzalez et al. (Reference Gonzalez, Leipnik and Mazumder2013) considers only new houses which may be more concentrated in certain areas of the city and purchased by a particular subpopulation. (3) Our study considers only the value of land and not that of the structure.Footnote 13
For PM2.5, the coefficient is much larger in magnitude given that it frequently exceeded the bad air quality threshold; however, the coefficient is significant only at the 10 per cent level. In US$, the corresponding MWTPs per m2 for lower PM2.5 is as much as US$11.3. Similarly, for a 1 part per billion reduction in SO2, the MWTP is US$9.57 per m2. The coefficient on O3 is positive but not statistically significant. Ozone, albeit a persistent problem for Mexico City, is structurally distinct from particulate matter pollution with the latter being more visible. In our later robustness checks we investigate alternative measures such as past 2 or 3 years' averages. However, annual average measures are collinear with the yearly dummy variables leading to a drop in magnitude and statistical significance.
In terms of elasticity, the relative magnitude of the estimated coefficients tells a consistent story about exposure to these pollutants. A 1 microgram per cubic meter increase in PM10 represents about a 2.29 per cent increase in PM10 at the mean (with average pollution levels of 43.7 micrograms per cubic meter). In turn, this means that for each recorded 1 per cent increase in PM10, average land values decline by 0.26 per cent. Similarly, a 1 microgram per cubic meter recorded increase in PM2.5 represents about a 3.83 per cent increase in PM2.5 (with average pollution levels of 26.1 micrograms per cubic meter). This means that for a 1 per cent increase in PM2.5, average land values decline by as much as 0.68 per cent. For SO2, a 1 part per billion increase represents a 17.6 per cent increase (with average levels of 5.7 parts per billion). This means that for a 1 per cent increase in SO2, average land values decline by only 0.13 per cent. It is not surprising that land value-pollution elasticity is lowest for SO2 since concentrations for this pollutant did not frequently exceed the bad air quality threshold.
6.1 Robustness checks
In this section, we check whether the impact of pollution on land values is robust to controlling for all possible time varying factors that might be changing within the zip code, not restricting ourselves to only changes in socioeconomic characteristics and local economic conditions. We control for all annual time varying factors by including zip code by year fixed effects. Changes in transportation infrastructure and other local shocks, such as construction sites or new business hubs, are factors that are captured by the location dummies interacted with year fixed effects. For example, if there is a new bus rapid transit system built along specific locations within the city, then it is likely that traffic as well as pollution will go down over time while housing prices rise.
In equation (5) below, the log of zip code average land values is regressed on zip code by year fixed effects (αzY), average pollution for the current quarter t to three quarters ago t − 3, denoted by C, (P oll C, z) and seasonal dummy variables (δQ). Standard errors are again clustered within the same municipality to control for arbitrary spatial correlation.
 $${LV}_{t,z} =\alpha _{zY} +\beta_{1} {Poll}_{C,z} +\delta _Q+u_{t,z}$$
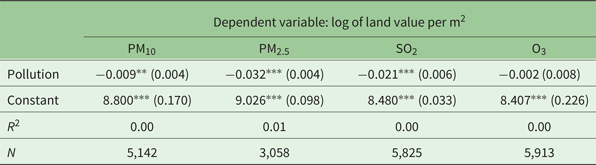
Our results, presented in table 3, show that the effect of pollution is robust to controlling for all time-varying factors that might change within the zip code. The magnitudes of the coefficients are somewhat larger for PM pollutants, where we control for two such time varying features – socioeconomic characteristics and local economic conditions. The coefficient in column 1 of table 3 can be interpreted as a 1 microgram per cubic meter increase in PM10 leads to a 0.9 per cent decrease in land values within the same zip code and property type and zone. In US$, this translates to a MWTP of $3.91 per m2. The MWTP in US$ is $13.92 for PM2.5, and $9.13 for SO2. Overall, the marginal impact of PM2.5 is larger in magnitude and has a higher level of statistical significance compared to PM10 and SO2. In elasticity terms, we again get a consistent picture with −0.39 for PM10, −0.8 for PM2.5, and −0.12 for SO2.
Estimated coefficients with zip code interacted with year
Notes: Robust standard errors clustered at the municipality level in parentheses. Asterisks *** and ** denote significance at 1 and 5%, respectively. All regressions include zip code interacted with year fixed effects, and seasonal dummies.
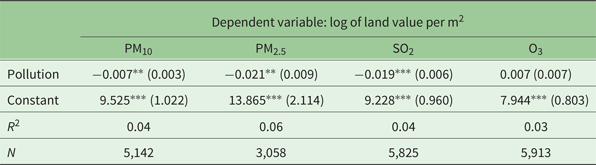
Our second robustness check exploits the variation in zip code land values by season by including zip code by quarter fixed effects as shown in table 4. Our primary explanatory variable of air pollution measures, as well as controls for neighborhood socioeconomic characteristics and local economic conditions and yearly dummy variables, is also included in this equation.
Estimated coefficients with zip code interacted with season fixed effects
Notes: Robust standard errors clustered at the municipality level in parentheses. Asterisks *** and ** denote significance at 1 and 5%, respectively. All regressions include zip code interacted with season fixed effects, controls for socioeconomic characteristics and local economic conditions, and yearly dummies.
Overall, the coefficients are very similar in magnitude to the land values regressions exploiting variations in land values within the same zip code (table 2). The MWTP estimates in US$ are $3.05 for PM10, $9.14 for PM2.5, and $8.27 for SO2. Similar to predominance in exposure to bad air quality thresholds, the magnitude of MWTP for PM2.5 is higher than that of SO2 (and PM10). Also, in elasticity terms, we find a similar pattern of relative importance. A 1 per cent increase in PM10 leads to 0.31 per cent decline in land values; a 1 per cent rise in PM2.5 leads to a 0.55 per cent decline in land values; and finally, a 1 per cent rise in SO2 leads to 0.11 per cent decline in land values. Ozone is again positive but not statistically significant.
This section presents our third robustness exploration utilizing a different measure of pollution. The main objective of this model is to provide consistency checks for the negative coefficient on pollution found in the prior three sets of results and sign on the ozone coefficient, especially because ozone is known to be a problem pollutant in Mexico City. The reduced form models consider only pollution and annual dummy variables to control for yearly variations. In equation (6) below, the dependent variable LV Yz is log of land values at the zip code level averaged over the four quarters. In other words, we take the annual average land value measures, where Y represents the year between 2006 and 2013. Accordingly, the pollutant measures are zip code level exposures averaged over the past 3 years, denoted by C, (Poll C, z). Lagged pollution measures are standard in the ambient air (and water) pollution literature as we thus avoid any potential omitted variables that jointly influence contemporaneous land values and pollution. Zip fixed effects (αz) and annual dummy variables (ρY) are the only other controls included to account for the panel nature of the data.
 $${LV}_{Yz} =\alpha _z +\beta_{1} Poll_{C,z} +\rho_Y +u_{,Yz}.$$
Table 5 presents the results of the log of annual average land values for each zip code (averaged over all four quarters in a year), regressed on past 3 years' annual average pollution, zip code fixed effects (to control for all time-varying factors), and annual dummy variables (to control for all year specific variations). In general, the coefficients estimates are larger in magnitude compared to previous results. One salient difference from the results in tables 2 to 4 is that the coefficient on ozone is now negative, consistent with our expectations of higher pollution leading to lower land values.Footnote 14 The MWTP for 1 part per billion reduction in ozone is US$7.03. The corresponding MWTP for PM10 is US$4.96, for PM2.5 is US$9.92 and for SO2 it is as much as US$23.53. The estimates of ozone lie in the range of the PM pollutants while SO2 takes on a large magnitude. In elasticity terms, we get estimates that are consistent with our previous results (for the other three pollutants): −0.61 for PM2.5, −0.58 for PM10, −0.49 for O3, and −0.34 for SO2.
Estimated coefficients with past 3 years' annual average pollution

Notes: Asterisks ***, **, and * denote significance at 1, 5, and 10%, respectively. All regressions include zip code fixed effects and yearly dummies.
Overall, we find evidence of negative effect of pollution on land values in Mexico City. Table 6 summarizes the MWTP estimates in US$ across the various specifications. MWTP for reduction in PM10 ranges between US$2.61–4.96, PM2.5 ranges between US$9.14–13.92. SO2 exhibits much more variability, ranging between US$8.27–23.53, while our only estimate for O3 of US$7.04 falls in the range of the PM estimates. The corresponding land value-pollution elasticities are more consistent in terms of prevalence of bad air quality during this time period with the highest coefficients in the range of −0.55 and −0.84 for PM2.5, −0.26 and −0.58 for PM10, followed by O3 at −0.49 and between −0.11 and −0.34 for SO2.
Summary of MWTP estimates (USD perm2) and land value-pollution elasticities

Notes: Asterisks ***, **, and * denote significance at 1, 5, and 10%, respectively. Elasticities are in parentheses.
7. Conclusions
This article provides early evidence on willingness to pay for air quality in a developing country context and for Latin America in particular. Within Latin America, we look at the most economically significant housing market in Mexico – its capital, Mexico City. Its unique combination of rapidly urbanizing growth and topographic features presents local policy makers with unique challenges to implement costly (and often ineffective) pollution control programs. We find that the average citizen in a developing country like Mexico is willing to pay a rather high implicit price for air quality.
Although we are not the first to estimate a hedonic housing price function for Mexico, we use a considerably richer set of pollution data and control for omitted variable bias. In addition, we exploit within zip code variation rather than seasonal variation in pollution. We are also the first to look at land values at the level of zip codes in an effort to identify the impact of pollution on the price of land without the confounding factors of the value of the structure.
We subject our fixed effects estimates to alternate sources of variation upon considering zip code by season fixed effects and within zip code variations. MWTP estimates vary between US$2.61–4.96 per m2 for PM10, US$9.14– 13.92 per m2 for PM2.5, US$8.27–23.53 per m2 for SO2, and only US$0.87–7.04 per m2 for O3. The coefficient on O3 is negative only in two specifications with larger magnitudes (and significance) in the annual average models. The corresponding land value-pollution elasticities vary between −0.55 and −0.84 for PM2.5, between −0.26 and −0.58 for PM10, between −0.06 and −0.49 for O3 and between −0.11 and −0.34 for SO2.
The results for ozone are not conclusive and deserve some discussion. Compared to particulate matter and SO2, ozone may be perceived of as a metropolitan-wide problem, as this is the pollutant that most frequently affects the entire population in the city through the restrictions imposed on transportation, recreation, and production by so-called ‘Environmental Contingencies’. More than 90 per cent of these contingencies (including pre-contingency, phase I, and phase II) since the beginning of the program in 1998 until 2013 (the last year in the period considered in our study) have been declared due to ozone concentrations reaching a value that is considered to pose major health risks (the remaining portion being declared due to PM10 exceeding maximum concentration thresholds). Importantly, during the period 2006–2013 only pre-contingencies were declared. As these impose less stringent restrictions compared to Phase I and Phase II contingencies, ozone may have been perceived as a problem that homogeneously affected every neighborhood in the city during our period of study, thus reducing its impact on housing prices across the city.
Evaluating the above estimates for PM10 at the average land value of US$435 per m2 and multiplying by the average land area of 88.8 m2, we get an estimate of willingness to pay for the average property. We conclude that residents in Mexico City are willing to pay US$231.77 more for an average property but with cleaner air (i.e., 1 microgram per cubic meter in PM10). Our point estimate is about six times the magnitude of Gonzalez et al. (Reference Gonzalez, Leipnik and Mazumder2013), the only other study in Mexico City based on a dataset that comprises new homes purchased between January 2003 and May 2004. In the annual average specifications, this magnitude of difference increases to almost ten times.
These comparative findings show the importance not only of addressing omitted variable bias in hedonic studies, but also the relevance of updating estimates as sociodemographic characteristics change in time and space. Furthermore, due to data on housing prices available in different contexts, it is important to further investigate whether pollution has different effects on land values and housing units. Our land value-pollution elasticities for PM10 (the pollutant closest to total suspended particulate matter) vary in the range of −0.26 and −0.58, which overlaps with the range for total suspended particulate matter found in Chay and Greenstone (Reference Chay and Greenstone2005) for US cities in the decade of the 1970s (−0.20 to −0.35). The comparison is meaningful as the income per capita in the US in the 1970s was similar to that in Mexico City during the period considered for our estimations.
This is a significant finding in a developing country context because it shows that problems of information in the housing market, as well as a presumable lack of awareness of air pollution (and its consequent health damages), do not seem to hinder capitalization of an amenity such as air quality into land values in Mexico City.
Acknowledgements
We would like to thank three anonymous referees, the Associate Editor and the Editor-in-chief of this journal; Jay Shimshack and Dan Phaneuf (Key Note Speakers at the Latin American Environmental and Energy Economics Workshop, Aguascalientes, Mexico); participants of LACEEP 10 + Event (Latin American and Caribbean Environmental Economics Program), Mexico City, 5th Annual AERE Summer Conference, Breckenridge, Colorado, and 91st Western Economics Association International (WEAI) Annual Conference, Portland, Oregon.