

Introduction
Quantitative genetic selection, using a weighted index of economically important traits, has been used by commercial breeders for over 60 years to improve the performance of egg-type stocks. Hazel (Reference HAZEL1943) first described how to construct and use a selection index, and industry breeding organisations subsequently used some form of an index that brought in both the genetic relationships among the traits and the economic value of changing those traits in order to select their pedigree flocks. The exact selection methods used by the various organisations is not contained in the literature, but from personal involvement by the second author and from conversations with other industry geneticists we know that indexes were used by commercial breeders of egg-type stocks, Selection has primarily been based on BW, feed conversion (FC), Hen-Day rate of lay, egg number, egg size, on various measurements of interior and exterior egg quality, liveability, and on an estimate of income over feed and chick cost. The genetic selection applied by those breeders has improved the performance of commercial strains tremendously, and the performance changes brought about have been documented in several summaries of random sample tests, as well as in several independent research studies (Wilson et al., Reference WILSON, JONES and DORMINEY1967; Hartmann, Reference HARTMANN1985; Heil and Hartmann, Reference HEIL and HARTMANN1991; Jones et al., Reference JONES, ANDERSON and DAVIS2001; Flock and Heil, Reference FLOCK and HEIL2002; Flock et al., Reference FLOCK, HEIL and DAMME2003). However, because selection for improved performance continues to take place annually by poultry breeding organisations, the performance of the strains that are available to commercial producers continues to change on a yearly basis, and both performance and management needs for those stocks also change over time.
For many years, Random Sample Tests (RST) were conducted at a number of agricultural universities and their results were utilised, primarily in North America and Europe, to compare the performance of commercial strains when grown and tested under the same conditions. The RST were located in a number of different geographic areas and were utilised for approximately 30 years in North America. An overseeing committee of the Poultry Breeders of America was in place for a portion of that time, which made recommendations to the various RST managers as to how their testing procedures might be improved. They produced a joint summary of all of the North American RSTs that were in operation from 1962 until the 1980s (e.g. USDA-SEA, Reference USDA-SEA1979).
As the number of commercial strains declined, due to the non-competitive nature of some strains and from the disappearance or consolidation of breeding companies, interest in such tests also declined to the point where most RSTs were terminated (Carey, Reference CAREY1988). In 1983-84, faculty members at North Carolina State University had the foresight to convert the NCRSLT to the North Carolina Layer Performance and Management Test (NCLP&MT - Martin, Reference MARTIN1984a; Reference MARTIN1984b). The North Carolina test has subsequently continued by including not only the commercial layer strains that are available at a given point in time, but also alternative management options that were of major interest to the commercial industry. All of the strains involved in the tests following that change have been compared in a restricted randomised complete factorial design with several management factors, which allow industry personnel to see how the various strains reacted to the management factors being tested.
In 2003, the United Egg Producer's released its ‘Animal Husbandry Guidelines for U.S. Egg Laying Flocks’ (United Egg Producers, Reference UNITED EGG PRODUCERS2002). Those guidelines were updated in 2005 (United Egg Producers, Reference UNITED EGG PRODUCERS2005) and called for a minimum of 413 cm2 and 465 cm2 of laying cage space for white-egg and brown-egg layers, respectively, by October 1, 2006. Those guidelines, along with the fact that most commercial layers are kept in 3-bird or 4-bird cages, were the basis for the choice of the cage size and densities used in the most recent NCLP&MT. In 2011, The NCLP&MT became a United Egg Producer (UEP) Certified Producer.
Induced moulting is a practice that has been used since the 1930s to rejuvenate laying flocks for a second or third cycle of production (for a historical review, see Bell, Reference BELL2003). Several moulting methods have been studied over the years, including: 1) feed removal or limitation, 2) low nutrient rations, and 3) various feed-additives (Bell, Reference BELL2003). Based on numerous research studies, the U.S. commercial egg industry over the past 50+ years has generally used a moulting programme that involved total feed withdrawal of up to 14 days with water supplied ad libitum to initiate the moult. In fact, as reported by Bell (Reference BELL2003), an informal survey of egg industry nutritionists in 2002 indicated that nearly all commercial flocks in the USA were being moulted, and that virtually all of the producers were utilising a feed withdrawal programme for inducing the moult at that point in time. When done properly, and when water was provided during the feed withdrawal period, the feed withdrawal moulting programme resulted in very satisfactory improvements in egg production and shell quality; and, it allowed the flock to continue to be maintained in an economically sound manner for an additional 25 to 30 weeks.
Over the past 10 to 15 years, animal rights and welfare communities have become increasingly critical of the total feed withdrawal practice for inducing moult. Such criticism prompted the USA egg industry to begin looking for alternative procedures for moulting their flocks (United Egg Producers, Reference UNITED EGG PRODUCERS2005). A potential procedure that had been looked at to a limited degree in the past (Anderson, Reference ANDERSON2004) was the maintenance of birds on a very low density (i.e., low protein, low energy, and high fibre) diet during the feed withdrawal portion of the moulting programme, so that procedure was compared with the ‘normal’ feed withdrawal procedure in the 34th and 35th tests. The NCLP&MT has since played an important role in developing, testing, and summarising the primary data that were needed by the egg industry to make its moulting procedure more acceptable to consumers as shown in the results of the 35th NCLM&PT (Anderson, Reference ANDERSON2005), and as to how the various white and brown egg strains involved have performed using several cage populations and when several alternative non-fasted moulting programmes were utilised.
All of the research flocks described herein were managed in accordance with the highest principles for the welfare of the birds involved; and since the early 1990s, under the principles and specific guidelines presented in the Guide for the Care and Use of Agricultural Animals in Agricultural Research and Teaching. That initial guide was revised in 1999. Following the advent of Institutional and Animal Care Committees under the Animal Welfare Act in the late 1980s, subsequent test protocols for each flock involved were approved by the Institutional Animal Care and Use Committee (IACUC) at North Carolina State University.
Historical data summary and review analysis
The overall objective of this review was to summarise and utilise the data from 50+ years of the North Carolina layer tests to assess the overall time trends in the productive performance of egg-type poultry. In order to do this, trait averages from each of the genetic strains of commercial layers that were entered into the 1st through the 37th North Carolina layer tests, placed between 1958 and 2008, were utilised. Individual strains were not tracked for this review, but the average performance of all of the brown egg, and of all of the white egg strains were utilised to provide time trends in brown egg and white egg strain performance. Since most of the strains that were being utilised by the industry were included in each test, these data should provide relatively good estimates of how the performance of layer stocks has changed over this 50+ year time span. The average performance of the brown egg and of the white egg strains for each trait from the 1st and 37th test were also compared to estimate the overall changes in performance over the entire 50+ year history of the tests.
Obviously, numerous management changes have also taken place over the 50+ year period of time involved with the North Carolina layer tests that may have had some effect on the performance levels observed. Those changes have included the lengths of time utilised in the different tests for the growing period, vaccination programmes, lighting programmes, feeding programmes, moulting programmes, and housing changes. It would take far too much space, however, to include all of the changes that have taken place during the 37 tests involved, but a few, especially the major grow and lay house facility changes have been taken into account, and are briefly described in subsequent sections. For those interested in seeing a more detailed summary of the major changes that took place during the 50+ year history of the North Carolina tests, it may be found on the following website: http://poultry.ces.ncsu.edu/layer-performance/.
A complete list of references for all of the publications related to each of the individual North Carolina tests can also be found on the above website, as well as electronic versions of all of the referenced documents that contain the individual performance for all of the strains involved in each of the North Carolina tests. The website also includes a list of references for all of the yearly USDA-ARS publications that summarised performance by strain from all of the North American random sample tests that were in operation during the years 1962 through 1979. The reports from the 37 tests were examined and summarised with segmented linear regression models, used to describe the changes in strain averages over time from the Rearing Reports. These regression models were fit using the REG procedure of SAS Institute (Reference SAS INSTITUTE1996) and had the flexibility to allow three different slopes for the three time periods defined by two breakpoints. The model was constrained so that the estimated regression function was continuous at these break points. Separate analyses were conducted for the brown and white egg strains. The two break points were determined by when major husbandry or housing changes were made in the rearing period testing procedures, which involved three subsets of tests, i.e. the three regressions involved test groups 1 to 18, 19 to 25, and 26 to 37 where the following rearing conditions were in place:
1. Tests 1 to 18: All pullets reared on litter flooring
2. Tests 19 to 25: Pullets reared in 3 different housing environments namely: 50% Litter/50% Slats; 100% Slats; or in Cages
3. Tests 26 to 37: All pullets were reared in growing cages at a constant density while comparing open-sided and light and temperature controlled housing.
The overall change in growing period performance from the 1st NCRSLT that was placed in 1958 and thirty-seventh NCLP&MT that was placed in 2009 were compared using the PDIFF, ADJ=TUKEY options of the LS MEANS statement of the GLM procedure of SAS. Experimental error rate was controlled at α = .05 using Tukey's HSD separation analyses were made using the average growing period performance for these two years for the white egg strains and for the brown egg strains that were included in each of those tests.
Segmented linear regression models were also used to summarise all 37 of the Laying Period Reports. Separate analyses were again conducted for the white and brown egg strains. The regression lines for the laying period were calculated using four separate groups of tests, where the break points were again determined whenever significant husbandry or housing changes were made in the laying facilities.
1. For tests 1 to 7, all of the production data was collected from trap-nests while the birds were housed on litter flooring.
2. For tests 8 to 18, the production data was collected from three different laying house environments, namely: a) 50% litter and 50% slats; b) 100% slats; and c) 100% cages.
3. For tests 19 to 25, all of the production data was collected from caged birds with comparisons of different cage populations and densities.
4. For tests 26 to 37, all production data was collected from hens that included a moulting programme, and the production cycles were extended from approximately 78 wks of age to 105-110 wks of age. Cage population and density studies were continued through this set of tests.
The overall change in production characteristics for the first production period from the 1st NCRSLT that was placed in 1958 and from the thirty-seventh NCLP&MT that was placed in 2009 were compared using the PDIFF, ADJ=TUKEY options of the LS MEANS statement of the GLM procedure of SAS. Experimental error rate was controlled at α = .05 using Tukey's Honestly Significant Difference. Separate comparisons were made for the white and brown egg strains involved in each of those tests.
The data for the post-moult cycle was first collected in the 26th NCLP&MT, at a time when controlled moulting had become a standard husbandry practice for the USA egg industry. Data from the post-moult laying period reports were also subjected to the segmented linear regression models as were described above to demonstrate the changes that have taken place during the post-moult laying period. Separate analyses were conducted for the white egg and for the brown egg strains. Two regression lines were developed for the tests that involved moulting, because of the transitional period for changing from the fasting type moult to several non-anorexic moulting programmes. Both types of moult programmes, i.e. fasting and non-anorexic were included in several of the tests during this change. The overall changes in production from the 26th and the 37th NCLP&MTs were again compared using the PDIFF, ADJ=TUKEY options of the LS MEANS statement of the GLM procedure of SAS, separately for the white egg and the brown egg strains.
‘Test’ equates to the flock number (1st NCRSLT through 37th NCLP&MT) in chronological order. All data were subjected to ANOVA utilising the GLM procedure of SAS (1996) with main effects of strain, cage population, and moulting programme. Separate analyses were conducted for white and brown egg strains. The interaction of moulting procedure and cage population was included in the analysis of the moult and 2nd cycle (post moult). Mean differences were separated via the PDIFF option of the GLM procedure of SAS.
Pullet performance
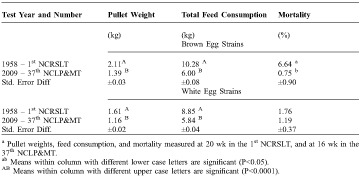
Performance during the growing period, in terms of pullet weight, feed consumption and mortality, for both the white and brown egg strains that were entered into the first 37 North Carolina layer tests are summarised in Table 1 and in Figures 1 through 3. Several major changes in pullet management were made during the 50+ year history of these tests, and those changes undoubtedly had some influence on the performance observed from the first to the 37th test. This is especially true with regard to the pullet body weights (PBW) and feed consumptions (PFC) that were measured during the grow period. One management change, and possibly the one with the greatest impact, was the age at which the pullet growing period was terminated. In the early NCRSTs, i.e. in tests 1-18, the rearing period was terminated at 20 wks of age. For the 19th through the 25th NCRSTs the pullet period was terminated at 19wks; for the 26th through the 30th NCLP&MTs, the rearing period was terminated at approximately 18 wks of age; and, finally for the 31st through the 37th NCLP&MTs, the growing period was terminated at 16 wks of age. Those changes in the length of the growing period were made in response to the decreasing age at which the pullets were coming into production, which was undoubtedly due to the selection pressure that was being applied on reducing the age at first egg by the commercial breeding organisations, but may have also been due to changes that were made with regard to the pullet nutrition programme that was used over time. That is, the earlier flocks were grown using starter and grower feeds only, whereas the later flocks have been grown on multiple rations utilising a phase feeding programme.
Two major pullet housing changes were also made during the 50+ years involved with these tests. One of those took place just prior to the 19th test, i.e. the change from all litter to half slat and half litter brooding; and, the second change, i.e. from floor to cage brooding, took place just prior to the 26th test. Those two pullet changes also had some effect on the performance measured during the growing period.
Changes in the average pullet body weight, feed consumption and mortality during the growing period from the 1st NCRST to the 37th NCLP&MT for the white egg and brown egg strains.a
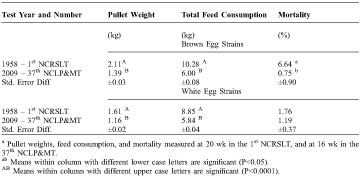
a Pullet weights, feed consumption, and mortality measured at 20 wk in the 1st NCRSLT, and at 16 wk in the 37th NCLP&MT.
ab Means within column with different lower case letters are significant (P<0.05).
AB Means within column with different upper case letters are significant (P<0.0001).
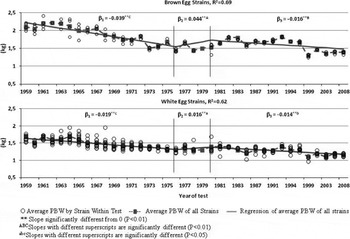
Pullet body weights (PBW) by strain within test, and the regression of the average PBW of all strains on the test number within three groups of tests with similar testing environments, for the brown and white egg strains entered from 1958 through 2008 into the 1st through the 377th North Carolina layer tests.

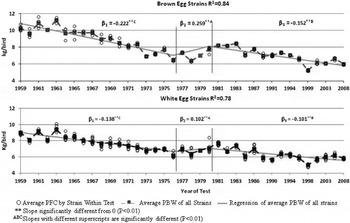
Pullet feed consumption (PFC) by strain within test, and the regression of the average PFC of all strains on the test number within three sets of tests with similar testing environments, for the brown and white egg strains entered from 1958 through 2008 into the 1st through the 377th North Carolina layer tests.

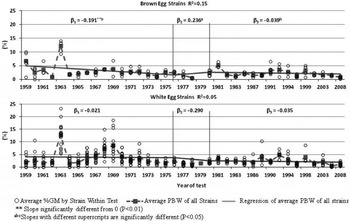
Percent grow mortality (%GM) by strain within test, and the regression of the average %GM of all strains on the test number within three sets of tests with similar testing environments, for the brown and white egg strains entered from 1958 through 2008 into the 1st through the 37th North Carolina layer tests.

pullet body weights
The average PBW for the brown and white egg strains decreased by 0.72 and 0.45 kg, respectively over the 50+ yr period between the 1st and the 37th tests (Table 1). Figure 1 shows that the decline in PBW has been a steady process over the entire history of the tests, and that the rate of decline has been greater in the brown egg than in the white egg strains. It needs to be reiterated that the PBW were taken at 20 wk of age for tests 1 -22, at 19 wk of age for tests 23-27, and at 16 wk of age for tests 28-37. These changes in the age at which the PBW were measured, along with changes in the timing of light stimulation to bring on sexual maturity, have undoubtedly entered into the magnitude of decline shown for PBW.
The three regressions for the two different types of pullets that were calculated for the different time periods involving different housing systems, showed some differences in the rates of PBW change. Overall, however, the rates of decline in PBW have been continuous throughout the history of the tests.
pullet feed consumption
Pullet feed consumption (PFC) during the growing period decreased by 4.28 kg per bird for the brown egg pullets, and by 3.01 kg per bird for the white egg pullets (Table 1). As with PBW, the PFC has steadily decreased over the entire test history for both types of pullets (Figure 2). The PFC did increase somewhat following the change from floor to cage growing facilities, but that change was probably related to improved health or increased feed wastage or both in the cages, and after a few tests, the PFC continued its decline for both types of pullets. The changes in length of the growing period have, as with PBW, undoubtedly affected the overall rate of decline shown for PFC.
pullet mortalities
Rearing period mortalities (%GM) slightly declined for the brown egg strains, but they remained quite stable for the white egg strains throughout the history of the tests (Figures 3). These results are not too surprising since the heritability of mortality rates has historically been reported to be extremely low, e.g. see Kinney and Shoffner (Reference KINNEY and SHOFFNER1965), and, therefore, most breeders have probably placed very little selection pressure on mortality rate. Flock mortality rates obviously fluctuate considerably from strain to strain and from test to test, but those fluctuations are primarily due to environmental factors such as exposure vs. lack of exposure to disease agents, or due to differences in the various strains susceptibility to disease agents due to the presence or absence of parental antibodies, rather than due to genetic reasons per se.
There was a considerable increase in the %GM of the white egg strains from the mid to the late 1960s. That increase was during the time that the U.S. egg industry (about 97%+ white eggs) was experiencing huge losses from Marek's Disease. Once Marek's vaccine was developed and introduced (about 1971), the %GM returned to its normal low level and has remained that way except for a brief period of time when some management problems resulted in increased mortality during the early 1990s.
Lay house performance through approximately 500 days of age
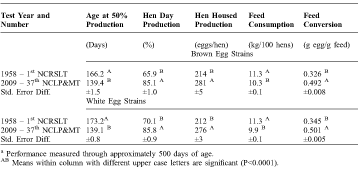
Changes in lay house performance for the 1st production cycle through approximately 500 days of age are summarised in Tables 2 and 3 and in Figures 4 through 11. Again, the performance changes for this period for each major trait studied are presented separately for the white egg and the brown egg strains. It should be noted that the lay house performance through 500 days (following the introduction of moulting in the NCLP&MT Flocks 26 through 37) is based on the performance of only that portion of each flock that was not moulted. The data from the moulted birds in flocks 26 -37 is discussed in a separate section of this summary.
Changes in the average laying house performance for the 1st production cycle from the 1st NCRSLT to the 37th NCLP&MT for the white egg and brown egg strainsa.
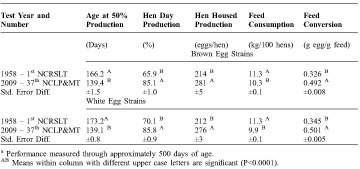
a Performance measured through approximately 500 days of age.
AB Means within column with different upper case letters are significant (P<0.0001).
age at 50% production
The average age at 50% production (Table 2) decreased by 26.8 days (P < 0.0001) for the brown egg strains, and by 34 days (P < 0.0001) for the white egg strains over the 50 + years involved with the 37 North Carolina tests. Those changes in sexual maturity for the two layer types, i.e. approximately a half day reduction per yr, are in good agreement with the annual change for sexual maturity reported in previous studies (see Jones et al., Reference JONES, ANDERSON and DAVIS2001 and Flock and Heil, Reference FLOCK and HEIL2002).
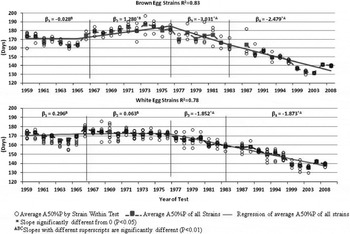
Figure 4 graphically presents the average age at 50% production for the 37 tests for the brown and white egg strains. The regressions for the four sub-sets of tests that involved major laying house changes, described in the statistical analysis section, show that sexual maturity increased slightly but significantly (P< 0.01) for the white egg strains in the tests placed from 1958 through 1976. But on the average, A50%P was at about 170 days during that period of time. For the same time period, A50% P initially decreased (years 1958-1966) and then it increased from 1967 through 1976 from about 171 days to about 184 days in 1976 for the brown egg strains. From 1976 on, A50%P decreased rapidly and fairly steadily throughout the remaining tests. The rate of decline for the brown egg strains was, however, considerably greater than for the white egg strains after 1976, and in the 36th and 37th tests, both types of layers reached 50% production at about 140 d of age.
Age at 50% production (A50%P) by strain within test, and the regression of the average A50%P of all strains on the test number within three sets of tests with similar testing environments, for the brown and white egg strains entered from 1958 through 2008 into the 1st through the 37th North Carolina layer tests.

Once the lay house environment was changed to cages, (tests 19-37), age at sexual maturity began to decrease rapidly. The timing of this change may simply be a coincidence with the timing of the housing change because, due to the computerisation of breeding records, commercial poultry breeders (although not documented in the literature) began placing greater emphasis on selecting for earlier age at 50% production beginning in the late 1960s and in the early 1970s. Although the downturn in age at sexual maturity started to show in about 1975-76 (Figure 4), with the system that is in place for the distribution of laying flocks around the world, commercial breeders require 4-5 years to get their breeding efforts at the pedigree level to actually reach the commercial production level. That is, the selection change has to work its way from the pedigree and great-grandparent (i.e. non-pedigreed sib flocks of the pedigree generation) level through the grandparent and parent levels to the commercial level, and each of these distribution levels takes 7 to 18 months depending on the time of the laying period that the hatching eggs are produced for each generation.
hen-day rate of lay and hen-housed egg production
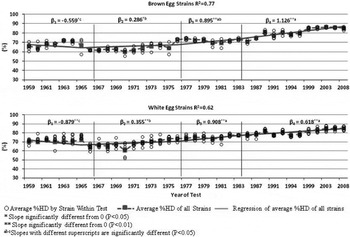
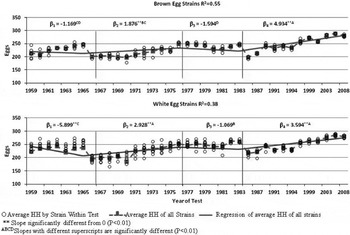
The %HD rate of lay and HH egg numbers for the 1st production period through to approximately 500 days of age are summarised in Table 2 and in Figures 5 and 6. The %HD rate increased by 19.2% (P < 0.0001) for the brown egg strains and by 15.7% (P < 0.0001) for the white egg strains, and the HH egg numbers increased by 67 eggs (P<0.0001) for the brown egg and by 64 eggs (P < 0.0001) for the white egg strains during the 50+ years from the 1st through the 37th North Carolina tests. Thus, egg production has increased by approximately 1.25 eggs per yr over the 50+ years during which these tests have been conducted. Again, this result is in good agreement with genetic changes that have been previously reported (Flock and Heil, Reference FLOCK and HEIL2002; Jones et al. Reference JONES, ANDERSON and DAVIS2001).
Figures 5 and 6 graphically present the changes in %HD (Figure 5) and HH (Figure 6) egg production through approximately 500 days of age. Similar to the situation with the changes observed in the age at 50% production, most of the changes in these two measures of egg production appear to have taken place after the mid-1970s. This is again probably due to the computerisation and increased accuracy of commercial breeding programmes that took place from the late 1960s through the early 1970s which greatly expanded the amount of data that could be quickly summarised and analyzed for estimating the breeding values used for selecting the candidates for reproducing the pedigreed breeding stock. Those improved technologies resulted in a steady increase in egg production for both the white and the brown egg strains that were available for commercial egg production, especially following the mid-1970s. Both types of layers show an improvement rate of roughly 0.5 eggs per year from 1975 through the 2008. The major housing changes that took place during the course of those tests appears to have had only minor effects on the rates at which egg production increased in the two types of layers.
Percent Hen-Day production (%HD) by strain within test, and the regression of the average %HD of all strains on the test number within three sets of tests with similar testing environments, for the brown and white egg strains entered from 1958 through 2008 into the 1st through the 37th North Carolina layer tests.

Hen-Housed Egg number (HH) by strain within test, and the regression of the average HH of all strains on the test number within three sets of tests with similar testing environments, for the brown and white egg strains entered from 1958 through 2008 into the 1st through the 37th North Carolina layer tests.

laying house feed consumption and feed conversion
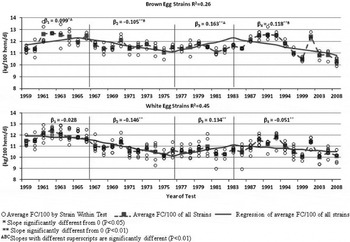
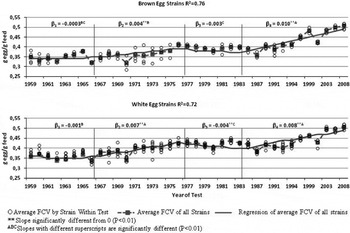
Laying house feed consumption, expressed as the kg of feed/100 hens housed consumed on a daily basis from the time of housing until approximately 500 days of age for the 1st production period is summarised in Table 2, and in Figure 7. Feed conversion expressed as the daily g of egg produced per g of feed consumed from the time of housing until approximately 500 days of age is also summarised in Table 2, and is graphically summarised in Figure 8.
Feed consumption steadily decreased over the course of these studies for both the brown egg and for the white egg strains. This is undoubtedly due to the steady decreases that have occurred in the BW for the two types of layers (see Table 1 and Figure 1, and Table 3 and Figure 10), but has also probably been tempered by the steady increases that have taken place in egg production (see Table 2, and Figures 5 and 6) and in egg weights (see Table 3, and Figure 11).
Daily feed consumption has declined by 1.0 kg (P < 0.0001) and by 1.3 kg (P < 0.0001) per 100 hens per day for the brown egg and white egg strains, respectively, from the 1st North Carolina test conducted in 1958 until the 37th North Carolina test conducted in 2008 (Table 2). Figure 7 shows that feed consumption has declined at a relatively steady pace throughout the 50+ year history of these tests.
Feed consumption per 100 hens (FC/100) by strain within test, and the regression of the average FC/100 of all strains on the test number within three sets of tests with similar testing environments, for the brown and white egg strains entered from 1958 through 2008 into the 1st through the 37th North Carolina layer tests.

Daily feed conversion in terms of g of egg produced per g of feed consumed has increased by 0.166 (P < 0.0001) and 0.156 (P < 0.0001) g of egg/day for the brown egg and white egg strains, respectively, from the 1st North Carolina test conducted in 1958 until the 37th North Carolina test conducted in 2008 (Table 2). Figure 8 shows that feed conversion during the 1st production period has also steadily improved throughout the history of the North Carolina tests.
Feed conversion (FCV = g egg/g feed)) by strain within test, and the regression of the average FCV of all strains on the test number within three sets of tests with similar testing environments, for the brown and white egg strains entered from 1958 through 2008 into the 1st through the 37th North Carolina layer tests.

laying house mortality, body weight, egg weight, and egg size distribution during the 1st production cycle
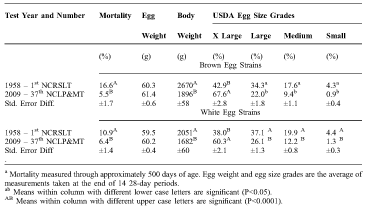
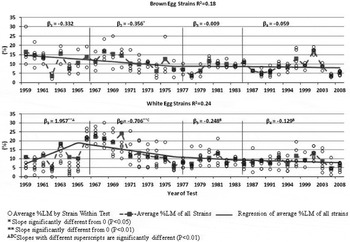
Laying house mortalities from housing through approximately 500 days of age from the 1st NCRST test that was placed in 1958 and the 37th NCLP&MT that was placed in 2008 are shown in Table 3.
Changes in the average mortality, egg weight, and egg size distribution from the 1st NCRSLT to the 37th NCLP&MT for the brown egg and white egg strains through 500 Daysa.
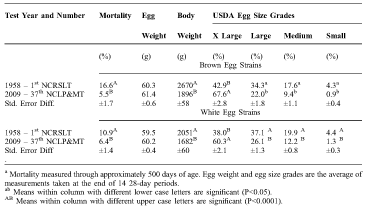
a Mortality measured through approximately 500 days of age. Egg weight and egg size grades are the average of measurements taken at the end of 14 28-day periods.
ab Means within column with different lower case letters are significant (P<0.05).
AB Means within column with different upper case letters are significant (P<0.0001).
For the brown egg strains, mortality averaged 11.1% less (P< 0.001) in the 2008 flock than in the 1958 flock. For the white egg strains, the difference in mortality was only 4.5%, which was not significant. As can be seen in Figure 9, this difference between the two types of layers is somewhat misleading, however, because the white egg strains experienced high levels of mortality during the late 1960s, shortly after the 1958 flock was placed, which was during a period of time when the USA egg industry (which was at that time about 97% white eggs) was struggling with severe outbreaks of Marek's Disease. Once Marek's vaccine became available and vaccination was started in 1970-71, the mortality levels for the white egg strains returned to normal (Figure 9), and the mortality of the white egg strains then steadily decreased from about 11-12% in the early 1970s to about 5-6% for the last couple of tests. As shown in Figure 9, even though there were considerable differences in mortality for the different strains within a given test, on the average the mortality levels for the brown egg strains and for the white egg strains, are remarkably similar, and mortality during the production period has obviously decreased over time for both types of layers.
Percent Lay house mortality (%LM) by strain within test, and the regression of the average %LM of all strains on the test number within three sets of tests with similar testing environments, for the brown and white egg strains entered from 1958 through 2008 into the 1st through the 37th North Carolina layer tests.

500-day body weight
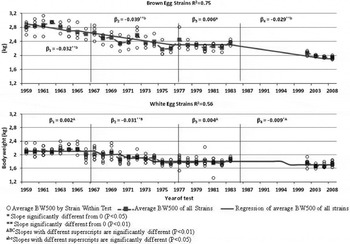
The average BW500 for the brown and white egg strains from the 1st and 37th North Carolina layer tests are also provided in Table 3. On the average, BW500 has decreased by 779 g and by 369 g for the brown and white egg strains, respectively, over the 50+ year history of these tests. As shown in Figure 10, BW500 has decreased at a pretty steady rate in both types of layers throughout this time period. Of course, the rate of decrease in the brown egg strains has been approximately twice the rate of decline in the white egg strains, and the average BW500 for the brown egg strains was only 214 g heavier than for the white egg strains in the 37th test.
Body Weight at 500 days of age (BW500) by strain within test, and the regression of the average BW500 of all strains on the test number within three sets of tests with similar testing environments, for the brown and white egg strains entered from 1958 through 2008 into the 1st through the 37th North Carolina layer tests.

egg weight
Egg weights were collected on the last day of 14 28-day test periods, and those 14 EW were then averaged to provide the strain averages. As can be seen in Table 3, on the average, egg weight has increased by 1.1 g and by 0.7 g for the brown egg and the white egg strains, respectively, from the 1st through the 37th tests. Although considerable strain-to-strain differences exist among the various brown and white egg strains in their average egg weights in any one test, on the average, the brown egg strains produced eggs that were about 1 g heavier than did the white egg strains. As is shown in Figure 11, despite the fact that pullet and BW500 have steadily decreased over time (Figure 10), egg weights during the first 12 or so tests steadily increased from about 60 g/egg for both types of strains to an average of about 66 g in the brown egg and about 63 g in the white egg strains during the late 1960s. Breeders have fairly steadily moved egg weight downward since that time, until the egg weights of both types of layers are now similar to where they were in the late 1950s.
Average Egg Weight (EW) by strain within test, and the regression of the average EW of all strains on the test number within three sets of tests with similar testing environments, for the brown and white egg strains entered from 1958 through 2008 into the 1st through the 37th North Carolina layer tests.

USDA egg size distribution and egg quality
The average USDA egg size grades (i.e. % X Large, % Large, % Medium, and % Small) for the 1st production period from the 1st and 37th tests are also summarised for the brown and white egg strains in Table 3. Over the years, as egg size has increased, size distribution, as expected, has moved toward a larger percentage of Large and X Large eggs. Those two categories are the primary ones that are in demand for the U.S. egg market. It appears that our egg-type breeders have settled on an average of about 60-61 g for the first production period to yield the best combination (88-89%) of Large and X Large eggs. That level yielded about 10-12% USDA Medium and about 1% of Small eggs in the 2009 test, which is down from 17-20% and 4-5%, respectively, in 1958. In order to reduce the length of this summary, figures for the various egg size categories, similar to Figures 1-11, are not included herein. Those figures are directly available on the following website (http://poultry.ces.ncsu.edu/layer-performance/).
Eggs for the U.S. market are also graded into several categories on quality measurements including USDA grade A, grade B, checked, and USDA loss eggs (USDA-AMS, Reference USDA-AMS2000). Again, due to space limitations, the figures (similar to Figures 1-11) for those egg quality categories are not presented in their entirety herein, but they can be viewed on the above website, and the data shows that as commercial egg-type breeders continued to select over the years for improved shell quality, that the percentage of USDA grade A eggs has increased from about 91-92% in both types of layers in 1958 to about 96-98% during the last few tests (conducted during the early 2000s). The % grade B. Eggs has dropped from about 8-9% in 1961 to about 1% during the early 2000s. Checked eggs have fluctuated with the type of housing used, but have also dropped from about 3-5% from the 1960s through the 1980s to a level of about 2-3% during the most recent tests. Likewise, the % loss of eggs has fluctuated somewhat over the years, but has generally decreased from levels of 0.8-1.2% in the late 1960s down to about 0.1-0.2% in the most recent tests. This reduction in ‘checked’ and ‘loss’ eggs is probably a result of both genetically improved shell quality and improvements in the equipment that is now used for housing egg-type layers. Again, in order to reduce the length of this summary, figures similar to Figures 1-10 for the various egg quality measurements have not been included herein, but they are available on the website (http://poultry.ces.ncsu.edu/layer-performance/).
Post-moult lay-house performance
A portion of the last eleven NCLP& MT flocks (i.e. the 26th through the 37th tests) were moulted in order to examine various ways of extending the productive life of the flock from 78 to 105 wks of age, and to be in step with what nearly 100% of the commercial U.S. egg industry was doing during that period of time (see Bell, Reference BELL2003). The production performance trait measurements that were taken during the post-moult period for those 11 flocks are summarised in Table 4.
post moult hen-day and hen-housed production
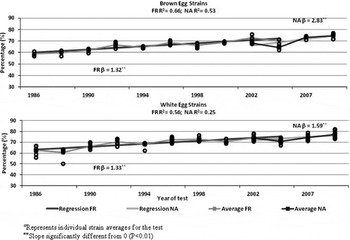
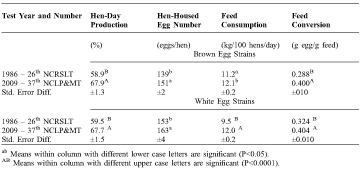
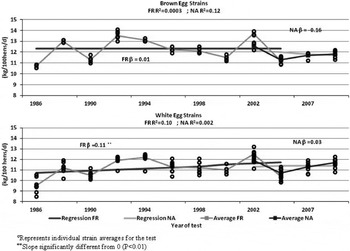
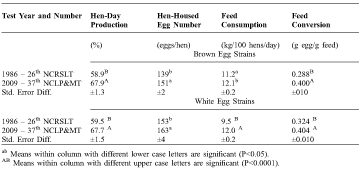
Post-moult hen-day and hen-housed production from the 26th NCLP&PT placed in 1986 and from the 37th NCLP&MT conducted in 2009 are summarised in Table 4, and in Figures 12 and 13. Post-moult HD rate of lay increased by 9.0% (P < 0.0001) and 8.2% (P < 0.0001) for the brown and white egg strains, respectively, during this 13 year period. As can be seen in Figure 12, the improvement in hen-day rate of lay has been fairly consistent throughout this 13 year period.
Post-molt Percent Hen-Day production (%PMHD) post-molt by strain within test, and the regression of the average %PMHD of all strains on the test number within the feed removal (FR) and non-anorexic (NA) molt programs, for the brown and white egg strains included in the 26th through the 37th North Carolina layer tests.

Changes in post moult production, feed consumption and feed conversion performance from the 26th to the 37th NCLP&MT for the brown and white egg strainsa.
ab Means within column with different lower case letters are significant (P<0.05).
AB Means within column with different upper case letters are significant (P<0.0001).
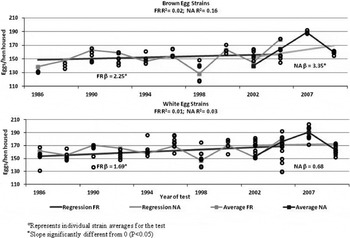
Post-moult HH egg numbers, which reflects the changes in both HD rate of lay and hen-survival, increased by 12 (P < 0.05) and 10 (P < 0.05) eggs for the brown and white egg strains, respectively, during this 13 year period. As can be seen in Figure 13, as with hen-day rate, the increases in hen-housed egg numbers was also pretty consistent in both types of layers throughout the 11 moulted flocks, and again, this change in productivity is most likely due to the on-going selection pressure that has been applied toward improving the rate of production over the years by the primary egg-type breeding companies. The slightly larger level of improvement in hen-housed egg number in the brown egg strains may also reflect the simultaneous improvement in liveability that has taken place in the brown egg strains (see Table 5).
Post-molt Eggs per Hen-Housed (PMHH) by strain within test, and the regression of the average PMHH of all strains on the test number within the feed removal (FR) and non-anorexic (NA) molt programs, for the brown and white egg strains included in the 26th through the 37th North Carolina layer tests.

post-moult feed consumption and feed conversion
Post-moult feed consumption rates for the groups that were moulted from the 26th NCLP&MT placed in 1986 and from the 37th NCLP&MT placed in 2008 are summarised in Table 4, and in Figure 14. Feed consumption, in this case, is expressed as the kg of feed consumed on a daily basis/100 hens housed from the initiation of the moult until approximately 735 days of age. Feed consumption increased by 0.9 kg and 2.5 kg/100 hen-days from the 26th through the 37th test for brown and white egg layers, respectively. This result is quite surprising, since both body weights and egg weights have been decreasing, but is probably due to the productivity rate increases between the 26th and the 37th tests. The production of 8-9% more eggs in test 37 than in test 26 obviously required the consumption of considerably more feed to produce those eggs.
Post-molt feed consumption per 100 hens (PMFC/100) by strain within test, and the regression of the average PMFC/100 of all strains on the test number within the feed removal (FR) and non-anorexic (NA) molt programs, for the brown and white egg strains included in the 26th through the 37th North Carolina layer tests.

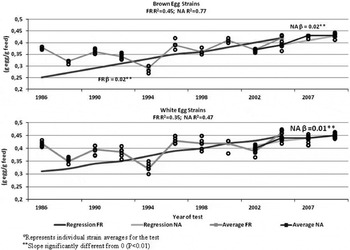
Post-moult feed conversion expressed in terms of g of egg produced per g of feed consumed has increased by 0.112 (P < 0.0001) and 0.180 (P < 0.0001) g of egg/day for the brown egg and white egg strains, respectively (Table 4 and Figure 15).
Post-molt feed conversion (PMFCV = g egg/g feed) by strain within test, and the regression of the average PMFCV of all strains on the test number within the feed removal (FR) and non-anorexic (NA) molt programs, for the brown and white egg strains included in the 26th through the 37th North Carolina layer tests.

post-moult laying house mortality, egg weight, and egg size distribution
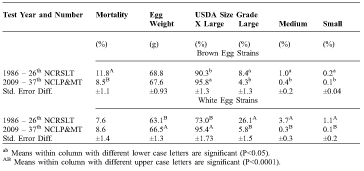
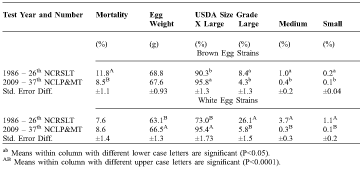
Laying house mortalities from housing through approximately 500 days of age from the 1st NCRST test that was placed in 1986 and the 37th NCLP&MT that was placed in 2009 are shown in Table 5 and in Figure 16. The difference in mortality rates between the 26th and 37th tests (3.2%) was significant (P < 0.0001) for the brown egg layers, but the difference for the white egg layers (2.0%) was not significant. The improved liveability of the brown egg layers during the moult undoubtedly contributed to the larger improvement in hen-housed egg production for the brown egg strains (Table 4).
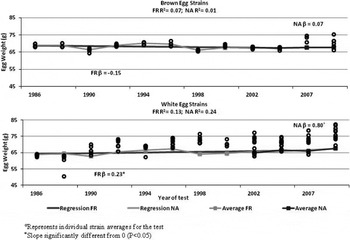
Post-moult egg weight was measured as the average weight of one-day's eggs produced every 4 weeks throughout the 38 week post-moult period. As observed for the first production period, the post-moult egg weight (1.2 g) did not increase significantly for the brown egg strains, but it did increase significantly for the white egg (3.4 g, P < 0.0001) strains (Table 5). The increase in egg weight for the white egg strains appears to have taken place gradually during the entire time period that the 11 moulted flocks were studied (see Figure 17).
Post-molt Percent Mortality (PM%M) post-molt by strain within test, and the regression of the average PM%M of all strains on the test number within the feed removal (FR) and non-anorexic (NA) molt programs, for the brown and white egg strains included in the 26th through the 37th North Carolina layer tests.

Changes in post moult mortality wks 60-105, egg weight and USDA egg size distribution performance from the 26th to the 37th NCLP&MT for the brown and white egg strainsa.
ab Means within column with different lower case letters are significant (P<0.05).
AB Means within column with different upper case letters are significant (P<0.0001).
Post-molt Egg Weight (PMEWT) post-molt by strain within test, and the regression of the average PMEWT of all strains on the test number within the feed removal (FR) and non-anorexic (NA) molt programs, for the brown and white egg strains included in the 26th through the 37th North Carolina layer tests.

post-moult usda egg size distribution and egg quality
As was done for the first production period, the average USDA egg size grades from the moult period are also included in Table 5 for the brown and white egg strains. Due to the weight of the eggs produced during the moult, over 99.5% of the eggs produced by both types of layers fell into the USDA large and extra large categories during the moult in the 37th test. This is up significantly (P < 0.05) for both types of layers from what was observed in the 26th NCLP&MT.
As they were during the first laying cycle, all of the eggs produced on one day during each 28-day period of production were also graded into several quality categories, including: USDA grade A, grade B, checked, and USDA loss eggs (USDA-AMS, Reference USDA-AMS2000). Again, due to space limitations, the data for these egg quality categories are not presented in their entirety herein, but the data from the individual test reports show that approximately 95% of the eggs produced during the 26th through the 35th tests were of USDA grade A quality. The moult was conducted using a feed restriction programme during those 10 tests. The percentage of grade A eggs decreased by several percentage points, however, during the 36th and 37th tests following the change to an anorexic moulting programme, and the numbers of grade B, checked and loss eggs consequently increased with that change. This situation has reversed itself in the 38thNCLP&MT that is currently being summarised.
Regardless of this minor set-back in shell quality, which is apparently due to the change in moulting procedure, production during the moult has continued to improve over time, and the egg size and egg quality has continued to be very acceptable, and far better than it is in non-moulted groups that were carried through to the same ages. These results continue to suggest that genetic selection based primarily on performance during the 1st lay cycle continues to improve almost all aspects of post-moult performance.
Again, in the interest of space, Figures similar to the ones provided for the production traits that include the data for the USDA egg size and grade categories during the moult, are not included herein. Those Figures are available on the following website: http//:www. ncsu.edu/depts./poultsci/tech info.html#layer.
Conclusions
Thirty-seven layer strain tests have been conducted during the past 53 years at the Piedmont Research Station in Salisbury, North Carolina. Those tests have included most of the commercial white and brown egg strains, and this summary of the data from all of those tests provides a broad overview of the general changes that have taken place in the performance of white egg and of brown egg production stocks during the past half century. Today's laying hens are in general smaller, they have less mortality, they have higher and more persistent levels of production, they produce larger eggs with better shell quality, and they are more efficient than were the commercial layers used in the middle of the 20th century. As shown in the data graphs presented, the performance changes observed have steadily taken place over time, as commercial breeding companies applied quantitative genetic selection procedures to their breeding flocks. Most of the changes observed are probably a result of the genetic selection that has been practiced by egg-type breeders. Some of the changes are probably from within strain selections, but some may also be due to changes in the strain utilised by the various breeding companies involved.
Obviously, some of these performance changes may also be attributable to improved vaccination procedures for diseases such as Marek's and infectious bursal disease that have taken place over the years, as well as to improvements in nutrition, but there is no way to separate or document the effects of those changes.
Poultrymen began moulting commercial laying flocks in the late 1960s and early 1970s, and moulting became an almost universal practice in the USA by the late 1980s. Moulting was first done using a feed withdrawal programme, but thanks to procedures worked out through the North Carolina test and at other University locations, it is now almost universally carried out using a low energy maintenance-type diet. The post-moult data from the most recent 20+ years of the North Carolina tests show that the performance improvements observed during the first production period clearly carry through to the post-moult production period. Small performance improvements continue to take place with each passing generation, and we see no reason to believe that they won't continue on into the future as the breeding companies continue to apply their selection programmes.
Acknowledgements
This review of the 37 North Carolina Layer Tests would not have been possible without the excellent collaboration that exists between the North Carolina Cooperative Extension Service at North Carolina State University (NCSU), and the North Carolina Department of Agriculture and Consumer Service's (NCDA&CS) Piedmont Research Station, Salisbury, NC. The authors wish to thank Mrs. Pamela K. Jenkins, Statistical Research Assistant, in the NCSU Department of Poultry Science for her help in compiling the data for most of these tests and for conducting the analyses for this review. Thanks are also due to Heather Cutchins Evans, who entered all of the data from the 1st through the 28th NCLP&MT reports into the Excel spread sheets. They also wish to thank all of the excellent staff members who managed the flocks and collected the data at the Piedmont Research Station. This report could not have been possible without their able assistance. Appreciation is also expressed to Dr Paul Siegel and Dr Karl Nestor for their helpful suggestions with regard to the development of the manuscript.