Introduction
Schizophrenia is characterized by impaired social functioning, commonly manifested in disturbances in communication (Sperber & Wilson, Reference Sperber and Wilson2002). These disturbances may be attributed, in part, to impairments in theory of mind (ToM), the ability to represent one's own and other persons' mental states in terms of beliefs, attitudes, thoughts and emotions (Premack & Woodruff, Reference Premack and Woodruff1978; Frith, Reference Frith1992; Leslie et al. Reference Leslie, Friedman and German2004). Developmentally, ToM is present in simple forms as early as 18 months of age (Leslie, Reference Leslie1987) and continues to develop through childhood and early adolescence (Baron-Cohen, Reference Baron-Cohen1995).
ToM deficits in schizophrenia are well documented (see Corcoran, Reference Corcoran, Corrigan and Penn2001; Brune, Reference Brune2005; Harrington et al. Reference Harrington, Siegert and McClure2005 for reviews; see Sprong et al. Reference Sprong, Schothorst, Vos, Hox and van Engeland2007 for a meta-analysis). Harrington et al. (Reference Harrington, Siegert and McClure2005) found evidence of ToM impairment in 27 of the 30 studies reviewed and the findings were largely independent of impairments in neurocognition (e.g. memory, attention). ToM deficits have been noted on tasks assessing first- and second-order false beliefs (Frith & Corcoran, Reference Frith and Corcoran1996; Roncone et al. Reference Roncone, Falloon, Mazza, De Risio, Pollice, Necozione, Morosini and Casacchia2002), as well as higher-order tasks involving comprehension of subtle suggestions (e.g. hinting), humor, metaphor, and irony (Corcoran et al. Reference Corcoran, Mercer and Frith1995, Reference Corcoran, Cahill and Frith1997; Mitchley et al. Reference Mitchley, Barber, Gray, Brooks and Livingston1998; Mazza et al. Reference Mazza, De Risio, Surian, Roncone and Casacchia2001; Brune, Reference Brune2005; Marjoram et al. Reference Marjoram, Gardner, Burns, Miller, Lawrie and Johnstone2005b; Mo et al. Reference Mo, Su, Chan and Liu2008). These deficits do not seem to be directly linked to psychiatric symptoms. Some studies have shown relationships with paranoid symptoms, negative symptoms, and formal thought disorder, but others have not (Roncone et al. Reference Roncone, Falloon, Mazza, De Risio, Pollice, Necozione, Morosini and Casacchia2002; Marjoram et al. Reference Marjoram, Tansley, Miller, MacIntyre, Cunningham, Johnstone and Lawrie2005a; Sprong et al. Reference Sprong, Schothorst, Vos, Hox and van Engeland2007; see Harrington et al. Reference Harrington, Siegert and McClure2005 for review). More consistent evidence supports a stable ToM deficit across acute and remitted clinical states (Herold et al. Reference Herold, Tenyi, Lenard and Trixler2002; Janssen et al. Reference Janssen, Krabbendam, Jolles and van Os2003; Randall et al. Reference Randall, Corcoran, Day and Bentall2003; Inoue et al. Reference Inoue, Yamada, Hirano, Shinohara, Tamaoki, Iguchi, Tonooka and Kanba2006; Sprong et al. Reference Sprong, Schothorst, Vos, Hox and van Engeland2007).
Persons with schizophrenia may experience particular difficulty in social situations that involve the processing of counterfactual information, such as when someone makes a sarcastic remark or tells a white lie that requires consideration of social cues beyond the literal meaning of the message. According to McDonald et al. (Reference McDonald, Flanagan, Rollins and Kinch2003), counterfactual verbal exchanges occur when the literal meaning of a message is contradicted by situational context. The true meaning is accessible only by incorporating social cues and other sources of information that place verbal statements into context. Difficulties understanding conversational exchanges involving counterfactual information are often noted in persons with traumatic brain injury (TBI) and have been linked to impairments in social functioning (McDonald, Reference McDonald2000; Dennis et al. Reference Dennis, Purvis, Barnes, Wilkinson and Winner2001; McDonald & Flanagan, Reference McDonald and Flanagan2004; McDonald et al. Reference McDonald, Flanagan, Martin and Saunders2004).
We are aware of only one previous study that assessed the ability to detect sarcasm in a schizophrenia sample (Leitman et al. Reference Leitman, Ziwich, Pasternak and Javitt2006). Relative to healthy controls, the schizophrenia group showed a decreased sensitivity to detect sarcasm plus an increased bias towards sincerity. Sarcasm perception scores did not significantly correlate with overall positive or negative symptoms. The relationship between the ability to detect sarcasm and community functioning was not examined. Regarding white lies, a few studies have examined the ability of children and adults with schizophrenia to infer the mental states of others using second-order ToM stories involving deception or lying, and the findings have been mixed (Pilowsky et al. Reference Pilowsky, Yirmiya, Arbelle and Mozes2000; Mazza et al. Reference Mazza, De Risio, Surian, Roncone and Casacchia2001; Brune, Reference Brune2003) or difficult to interpret because the detection task scores were part of a composite including second-order ToM stories not involving deception (Randall et al. Reference Randall, Corcoran, Day and Bentall2003).
ToM studies in schizophrenia have relied heavily on paper-and-pencil measures, such as short stories or sequential picture sets of line drawings (Happe, Reference Happe1993; Langdon et al. Reference Langdon, Coltheart, Ward and Catts2002; Mo et al. Reference Mo, Su, Chan and Liu2008), several of which were passed down from the developmental literature examining the social development of healthy children (Doody et al. Reference Doody, Gotz, Johnstone, Frith and Owens1998) and those with autism spectrum disorders (Baron-Cohen et al. Reference Baron-Cohen, Leslie and Frith1985; Happe, Reference Happe1993). These measures are not ideally suited for adults with schizophrenia because they are tailored for children and consequently relatively easy, and are also potentially confounded with reading, comprehension and working memory abilities. In addition, paper-and-pencil measures do not capture dynamic characteristics such as facial expressions, voice tones and gestures that are central to social communication and convey meaning apart from the content of speech. Compared to written texts, video clips of social interactions may be more ecologically valid, reduce potential confounds, and be more engaging for participants.
For the present study we used The Awareness of Social Inference Test (TASIT Part III: Social Inference – Enriched; McDonald et al. Reference McDonald, Flanagan, Rollins and Kinch2003), which was originally developed for use with persons with TBI. The test includes videoed vignettes of everyday situations enacted by professional method actors. Part III assesses the ability to draw inferences about the thoughts, intentions, beliefs and feelings of others engaged in conversational exchanges involving lies or sarcasm. Test–retest reliability of Part III (Form A) was 0.83 in a small sample of TBI patients (n=18; McDonald et al. Reference McDonald, Bornhofen, Shum, Long, Saunders and Neulinger2006). Discriminant validity of this TASIT component was demonstrated in a study comparing 12 TBI patients with 12 age-, education- and occupation-matched healthy controls (McDonald et al. Reference McDonald, Flanagan, Rollins and Kinch2003). TBI patients performed significantly worse than the controls on the sarcasm subscale and overall composite, but not on the lie subscale. In the TBI group (McDonald et al. Reference McDonald, Bornhofen, Shum, Long, Saunders and Neulinger2006), performance on Part III correlated significantly (positively) with performance on an emotion perception task (Ekman photos; Ekman & Friesen, Reference Ekman and Friesen1976) but not social problem-solving ability (Assessment of Interpersonal Problem-Solving Skills, AIPSS; Donahoe et al. Reference Donahoe, Carter, Bloem, Hirsch, Laasi and Wallace1990) or first- and second-order false-belief ToM tasks (Bibby & McDonald, Reference Bibby and McDonald2004). There are no published reports of studies using TASIT in schizophrenia; one co-author used it in a study of psychometrically defined schizotypy (Jahshan & Sergi, Reference Jahshan and Sergi2007).
The aims of the present study were to: (a) compare ToM abilities in conversational exchanges involving counterfactual information (lies, sarcasm) in a sample of stable, chronic schizophrenia out-patients versus demographically comparable healthy adults, and (b) examine the relationship of these abilities with community functioning in the patient sample. Based on the ToM literature in schizophrenia, we hypothesized schizophrenia patients to be impaired relative to healthy adults on perception of both sarcasm and lies. There are very few data on the relationship between ToM and community functioning in schizophrenia. Our examination of this relationship was exploratory.
Method
Subjects
The sample included 50 persons who met DSM-IV criteria for schizophrenia or schizo-affective disorder and 43 demographically comparable healthy adults. This project was part of the UCLA Translational Research Center for Neurocognition and Emotion (K.H.N., PI). All participants were considered to have chronic illness (i.e. onset of psychotic symptoms at least 5 years prior to participation), were clinically stable, and were previously enrolled in the UCLA Aftercare Program. None of the schizo-affective disorder study participants met criteria for current mood episode at the time of enrollment. Psychiatric diagnosis was reconfirmed for this study with a follow-up Structured Clinical Interview for DSM-IV (SCID-I/P; First et al. Reference First, Spitzer, Gibbon and Williams1996). Training of diagnostic interviewers involved viewing videotapes and conducting live interviews to establish adequate inter-rater reliability. A minimum κ of 0.75 was required of raters on symptom presence. Final diagnosis was determined during case conferences following presentation and review of interview data, information from previous SCID-I/P, and collateral information (e.g. medical records, informants). Inclusion criteria for schizophrenia participants included: (a) DSM-IV diagnosis of schizophrenia or schizo-affective disorder, depressed subtype, (b) age between 18 and 60 years, (c) estimated IQ>70, (d) able to understand spoken English sufficiently to comprehend testing procedures, and (e) at least 5 years since the onset of their first psychotic episode. Exclusion criteria included: (a) history of clinically significant neurological disorder (e.g. epilepsy), (b) history of head trauma with loss of consciousness >1 h, (c) physical, cognitive or language impairment of such severity to adversely affect the validity of the data, (d) alcohol or substance use disorder within the past 6 months, and (e) current treatment of psychotic symptoms with only conventional antipsychotic medication.
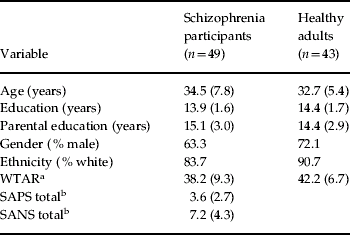
Healthy adults were recruited through newspaper advertisements, community colleges, trade schools, and the internet. Healthy adults were selected to be comparable as a group to the schizophrenia group on age, gender, race/ethnicity, handedness, parental educational level, and community of residence. This goal was accomplished by regular review of group means on these demographic variables and making recruitment adjustments accordingly. Exclusion criteria for the healthy adults included history of a schizophrenia spectrum disorder (avoidant, paranoid, schizotypal or schizoid personality disorders), bipolar disorder, recurrent major depression or >1 year of depressive symptoms, post-traumatic stress disorder, neurological disorder, significant head injury, alcohol/substance use disorder, or presence of a family history of psychotic disorder among first-degree relatives. All potential control subjects received a SCID-I and SCID-II (Cluster A and C sections) to assess selection criteria. Table 1 presents the demographic, illness chronicity, and symptom characteristics of schizophrenia participants and the demographic characteristics of the healthy adults. Written informed consent was obtained from all study participants based on a complete description of the study.
Demographic and clinical characteristics

Values given as mean (standard deviation).
a WTAR, Wechsler Test of Adult Reading; significant group difference; t(83)=2.32, p<0.02; seven subjects were missing WTAR scores (three in the schizophrenia group, four in the healthy adult group).
b SAPS, Scale for Assessment of Positive Symptoms; SANS, Scale for Assessment of Negative Symptoms; the SAPS and SANS total scores were calculated by summing the global scores from the respective subscales.
Procedure
All study participants were administered TASIT Part III (Social Inference – Enriched) Form A as part of their participation in a project on social cognition within the UCLA Translational Research Center. Parts I and II were not administered due to consideration of participant burden resulting from multiple Center projects administering other assessments to the same persons. Part III consists of 16 videoed scenes, each lasting 15–60 s, depicting lies or sarcasm (eight of each presented in a fixed random order; see Appendix for examples). The lie scenes involved either white lies or sympathetic lies. Each scene was administered only once. A prologue/epilogue or camera edit provided information to the viewer about the nature of the conversational exchange. Participants were provided a record form and asked to answer four types of forced-choice (yes/no) questions. The first question asks the participant to think about what one character in the scene is doing to the other, that is what he/she is trying to make the other person think or feel. The second question asks what the character is trying to say to the other person, that is what is the message he/she is trying to get across. The third question asks what the character is thinking, that is what is his/her underlying belief. The fourth question asks what the character is feeling, that is what emotion he/she is feeling or how he/she feels towards the other person or the situation. A practice scene is provided at the beginning to familiarize participants with the questions. During administration, the videotape is paused between each scene to allow the participant time to answer the four questions respective to that scene. The test is not timed, but required approximately 15 min for administration with schizophrenia participants in the current study. The test provides an overall total score (maximum=64), plus subtotals for each type of question (Do, Say, Think, Feel), scene condition (lie versus sarcasm), and type of cue provided (visual versus text).
In addition to TASIT, all schizophrenia participants received measures of positive symptoms, negative symptoms, pre-morbid intelligence, and community functioning (Role Functioning Scale, Global Functioning Scale) described briefly below. The two community functioning measures were administered to provide continuity in the assessment of this area across Translational Research Center samples. Ratings for the community functioning measures were based in part on collateral information from the Community Adjustment Form (Stein & Test, Reference Stein and Test1980), a comprehensive, multi-factorial, semi-structured interview.
(1) Scale for Assessment of Positive Symptoms (SAPS; Andreasen, Reference Andreasen1984a). This interview-based measure of positive symptoms of schizophrenia assesses four domains (hallucinations, delusions, bizarre behavior, positive formal thought disorder). The scale yields a global score for each domain (score range=0–5 with 0 indicating no symptom presence and 5 indicating severe presence). An overall composite was calculated by summing the global scores (score range=0–20).
(2) Scale for Assessment of Negative Symptoms (SANS; Andreasen, Reference Andreasen1984b). This interview-based measure of negative symptoms associated with schizophrenia assesses five domains (affective flattening or blunting, alogia, avolition-apathy, anhedonia-asociality, and attention). The attention subscale was dropped because it is not believed to represent a core component of negative symptoms (Blanchard & Cohen, Reference Blanchard and Cohen2006). The scale yields a global score for each domain (score range=0–5 with 0 indicating no impairment and 5 severe impairment). An overall composite was calculated by summing the global scores (score range=0–20).
(3) Wechsler Test of Adult Reading (WTAR; Wechsler, Reference Wechsler2001). This test of general word knowledge is frequently used as an estimate of pre-morbid intelligence and requires the individual to read aloud 50 irregularly pronounced words. The dependent score was the total number of words correctly pronounced (score range=0–50).
(4) Role Functioning Scale (McPheeters, Reference McPheeters1984). This measure assesses level of role functioning in four areas of everyday life: (a) working productivity, (b) independent living and self-care, (c) family relationships, and (d) social network relationships. The time-frame is the individual's functioning within the past month. Scores on each subscale range from 1 (very low) to 7 (optimal).
(5) Global Social and Role Functioning Scale (GSRFS; Auther et al. Reference Auther, Smith and Cornblatt2006; Niendam et al. Reference Niendam, Bearden, Johnson and Cannon2006; Cornblatt et al. Reference Cornblatt, Auther, Niendam, Smith, Zingerg, Bearden and Cannon2007). This global measure assesses two areas of functioning (role and social) at three time-points (highest, lowest, current). The current study focused on current level of functioning. Scores on the role and social functioning subscales range from 1 (very low) to 10 (superior).
Statistical analyses
All analyses were conducted using SAS version 9.1 (SAS Institute Inc, Cary, NC, USA). Initially, we examined the TASIT data for distribution normality and outliers. The lie scene data were negatively skewed and consequently transformed along with all other TASIT scores using a square root transformation. One study participant's data were dropped due to questionable validity yielding n=49 in the schizophrenia group for the data analyses. Demographic characteristics of schizophrenia participants versus healthy adults were compared using independent t tests for continuous variables and χ2 tests for categorical data. Using the SAS proc mixed procedure, a 2 (group: schizophrenia participants versus healthy adults)×2 (condition: sarcasm versus lie) repeated-measures ANOVA was performed and followed up with tests for gender effects. We collapsed across the four question types because preliminary analyses with specific variables (i.e. do, say, think, feel) did not reveal any significant three-way interactions and indicated a similar overall pattern of results. Hence, we opted to use only the subscale scores for lies and sarcasm and the overall total score in the current analyses for clarity and ease of presentation.
To examine the potential role of symptom severity on observed group differences in TASIT performance, we examined the correlations of the TASIT with SAPS and SANS total scores in the schizophrenia group. When significant relationships were found, we reran the 2×2 repeated-measures ANOVA using a subset of schizophrenia participants with low-level symptoms to see whether previously observed findings were not tied to symptom severity. Analysis of covariance was not feasible because of the absence of symptom data in the healthy adult group. Finally, we performed correlational analyses to examine the relationship between TASIT performance and community functioning in the schizophrenia group. To control for experiment-wise error due to multiple comparisons, we used a conservative p value of 0.01 based on the number of outcome measures (n=6) for these tests of significance. For significant or trend (p<0.05) relationships, we conducted follow-up regression analyses controlling for symptoms.
Results
Demographic comparisons
Schizophrenia participants did not differ significantly from healthy adults in age, gender composition, education, parental education or ethnicity, but did on the WTAR [t(84)=2.36, p<0.02; see Table 1]. Based on findings that impairments in intellectual functioning and academic performance are noted in persons with schizophrenia prior to onset of illness (Reichenberg et al. Reference Reichenberg, Weiser, Rabinowitz, Caspi, Schmeidler, Mark, Kaplan and Davidson2002; Weiser et al. Reference Weiser, Reichenberg, Rabinowitz, Nahon, Kravitz, Lubin, Knobler, Davidson and Noy2007), we opted not to treat this putative measure of ‘pre-morbid’ intelligence as a covariate in the analyses.
Group comparisons on TASIT
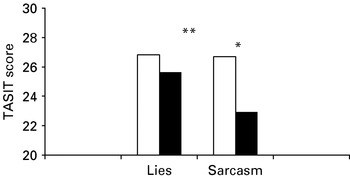
The results from the 2×2 ANOVA revealed significant effects of group [F(1, 90)=16.37, p=0.0001], condition [F(1, 90)=4.40, p=0.04], and group×condition interaction [F(1, 90)=4.80, p=0.03; see Fig. 1]. Follow-up between-group contrasts revealed that schizophrenia participants differed from controls on sarcasm [F(1, 90)=18.10, p=0.0001; Cohen's d=0.95] but not lie scenes [F(1, 90)=2.55, p=0.11; Cohen's d=0.33]. Follow-up within-group contrasts showed that healthy adults performed comparably on both sarcasm and lie scenes [F(1, 90)=0.00, p=0.95; lie mean=26.8 (s.d.=3.7); sarcasm mean=26.7 (s.d.=3.5)]; schizophrenia participants performed significantly worse on sarcasm relative to lie scenes [F(1, 90)=9.84, p=0.002; lie mean=25.6 (s.d.=3.8); sarcasm mean=22.9 (s.d.=4.4)]. The follow-up analyses adding gender to the repeated-measures ANOVA did not reveal any significant effects for gender or the gender×condition interaction. In sum, schizophrenia participants showed greater difficulty with sarcasm than lie scenes relative to healthy adults.
Comparison of healthy adults (□) and schizophrenia patients (■) for lies and sarcasm in The Awareness of Social Inference Test (TASIT). * Significant group effect [F(1, 90)=16.37, p=0.0001]. ** Significant group×condition interaction [F(1, 90)=4.80, p=0.03].

Group comparisons on TASIT (controlling for symptoms)
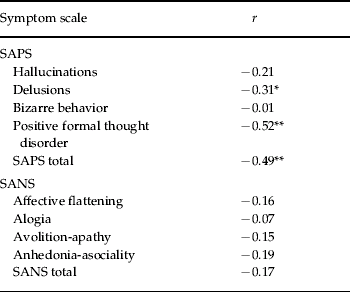
Examination of results from the bivariate correlational analyses involving TASIT and patient symptom measures revealed significant relationships between TASIT total score and selected indices from the SAPS, but not the SANS (see Table 2). On the SAPS, significant relationships were found with delusions (r=−0.31, p=0.04), positive formal thought disorder (r=−0.52, p=0.001), and SAPS total score (r=−0.49, p=0.001), but not hallucinations or bizarre behavior. To see whether the schizophrenia versus healthy adult group differences on TASIT remained in a subset of schizophrenia participants who were in a clinically remitted state, we reran the between-group analyses using only participants who did not show clinically significant elevations on any of the SAPS subscales (i.e. ratings ⩽2, n=30). These analyses revealed significant effects of group [F(1, 71)=5.95, p=0.02], condition [F(1, 71)=4.27, p=0.04], and group×condition interaction [F(1, 71)=4.62, p=0.035]. Follow-up between-group contrasts revealed that schizophrenia participants performed significantly worse than controls on sarcasm [F(1, 71)=9.22, p=0.003; Cohen's d=0.71] but not lie scenes [F(1, 71)=0.16, p=0.69; Cohen's d=0.00]. Follow-up within-group contrasts showed that healthy adults performed comparably on both sarcasm and lie scenes [F(1, 71)=0.00, p=0.95]; schizophrenia participants performed significantly worse on sarcasm relative to lie scenes [F(1, 71)=7.75, p=0.007]. These findings were essentially the same as those noted with the full schizophrenia sample.
Correlations between TASIT total score and positive and negative symptoms

TASIT, The Awareness of Social Inference Test; SAPS, Scale for Assessment of Positive Symptoms; SANS, Scale for Assessment of Negative Symptoms.
* p<0.05, ** p<0.001.
TASIT and community functioning
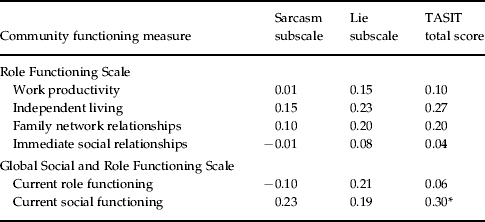
Table 3 presents the data examining the relationship between TASIT sarcasm and lie subscales and total score with community functioning. Using a threshold of α=0.01 to adjust for multiple comparisons, there was one trend finding between the TASIT total score and current social functioning from the GSRFS (r=0.30, p=0.04). No other noteworthy relationships were observed (all p's>0.07). To see whether the lone trend relationship remained present after controlling for positive symptoms, we ran a regression analysis with two independent variables (SAPS total and TASIT total score) entered simultaneously. The results revealed that only the SAPS total was significant (p=0.04), accounting for 16.35% of the variance in current social functioning. The amount of additional variance accounted for by TASIT over and above the SAPS was negligible (R 2 change=1.35%).
Correlations between TASIT scores and community functioning measures

TASIT, The Awareness of Social Inference Test.
* p=0.04.
Discussion
This study is the first to report findings of schizophrenia patients on TASIT, a videotape measure of ToM that assesses the ability to draw inferences about the intentions, beliefs and feelings of others in social interactions involving counterfactual statements (i.e. lies versus sarcasm). The primary finding was that schizophrenia versus control group differences were largely accounted for by differences in the ability to comprehend sarcasm. Compared with demographically comparable healthy adults, schizophrenia participants showed greater difficulty comprehending sarcasm than lies. This finding was present with the full schizophrenia sample as well as a subset with low-level positive symptoms. Hence, the relative discrepancy in the ability to comprehend sarcasm does not seem to be an artifact of psychotic symptoms.
Our findings are consistent with the one previous report on sarcasm involving a schizophrenia sample (Leitman et al. Reference Leitman, Ziwich, Pasternak and Javitt2006). In that study, in-patients and out-patients with schizophrenia or schizo-affective disorder were compared with a healthy control group. The ability to detect sarcasm was assessed using the attitudinal subtest from the Aprosodia Battery (Orbelo et al. Reference Orbelo, Grim, Talbott and Ross2005), which included an audiotape presentation of 10 semantically neutral sentences (e.g. ‘This looks like a safe boat.’) recorded by a female speaker in both a sincere and a sarcastic tone of voice. The participants' task was to ascertain whether the speaker was being sarcastic or sincere. Although the methods used in the Leitman et al. study were considerably different than those used in the present study, the results provide convergent evidence for a deficit in this area of processing.
We can only speculate about the reasons for impairment in the perception of sarcasm but not lies in persons with schizophrenia. Leitman et al. (Reference Leitman, Ziwich, Pasternak and Javitt2006) proposed that the observed deficits in sarcasm might be due to difficulties in the processing of physical features that give rise to the percept of sarcasm (i.e. alterations in stress and prosody) rather than a more general ToM deficit. In line with this possible explanation, it is noteworthy that the physical cues that ‘tip off’ the observer about whether someone is telling a white lie or being sarcastic are present only for the latter. For example, persons typically show little change in expression when telling a white lie in an attempt to conceal the deception. By contrast, persons making a sarcastic remark often present with exaggerated facial expression, voice tone, and gestures for effect. In the TASIT Part III scenes, the determination of white lies places fewer demands on information processing. Social cues are less relevant and the determination can be made by viewing the camera shot or prologue/epilogue, which reveals the true state of affairs to one of the characters but not the other. For the sarcasm scenes, this supplemental information is helpful but not sufficient to make an accurate determination. The viewer must attend to and accurately process subtle changes in paralinguistic and other social cues from the characters' conversational exchange in addition to information from the camera shot or prologue/epilogue. The findings from the present study suggest that persons with schizophrenia may not be impaired in ToM globally, but only in certain areas with greater information processing load, or perhaps in those ToM areas more intimately tied to the ability to perceive facial expression and paralinguistic cues. Of interest, impaired perception of sarcasm but not lies was also found in the one study with TBI patients using TASIT (McDonald et al. Reference McDonald, Flanagan, Rollins and Kinch2003).
Despite the observed differences in comprehension of sarcasm versus lies in the present study, care should be taken in interpreting these findings as definitive of a differential deficit. Testing for a differential deficit requires measures to be equated on true score reliability, variance and level of difficulty (Chapman & Chapman, Reference Chapman and Chapman1978). For the present study, no a priori efforts were made to ensure that the two conditions were equated on these psychometric properties. However, interpretation of findings should also consider two other sources of information, TASIT's administration methods and healthy adult data from the present study. It would be difficult to argue that schizophrenia participant difficulties on sarcasm versus lies were due to differences in the methods used to assess these conditions. For both sarcasm and lies, the structure of the scenes was highly similar (e.g. characters, settings, length of video clip), and the type of questions and response format were the same. Post hoc examination of subscale scores for sarcasm versus lies in the healthy adult group revealed highly comparable levels of performance accuracy and variance for both types of scenes, levels comparable with published norms for this test (McDonald et al. Reference McDonald, Bornhofen, Shum, Long, Saunders and Neulinger2006). Hence, even though the measures were not deliberately manipulated for the purpose of testing a differential deficit, they were fairly well matched.
Examination of the relationship between TASIT performance and community functioning yielded negative findings. Of 18 comparisons, one trend finding emerged and the significance of that relationship disappeared after consideration of positive symptoms. In hindsight, it is not clear that we should expect one. Despite the substantial number of studies documenting the presence of ToM deficits in schizophrenia, few have examined the relationship between ToM and community functioning. A recent review (Couture et al. Reference Couture, Roberts and Penn2006) revealed four published reports of ToM and functional outcome in schizophrenia; only one examined community functioning and the findings were mixed (Roncone et al. Reference Roncone, Falloon, Mazza, De Risio, Pollice, Necozione, Morosini and Casacchia2002). Perhaps ToM is less directly tied to broader community functioning, which can be influenced by a number of variables (e.g. family support, employment opportunities, social environment), and instead is more closely related to narrower areas within interpersonal functioning such as social communication. For example, it might be expected that the ability to ‘read’ other persons' mental states would be necessary to communicate effectively, and this ability may in turn facilitate the formation and maintenance of social relationships, although the latter could be influenced by other variables as well. There is some, albeit limited, evidence to support this notion (McCabe et al. Reference McCabe, Leudar and Antaki2004).
Our findings indicated a significant relationship between ToM ability and positive, but not negative, symptoms. Specifically, TASIT performance was related to SAPS subscales measuring severity of delusions and positive formal thought disorder, as well as overall positive symptom severity. By contrast, TASIT performance did not show a significant relationship with overall severity of negative symptoms or any of the negative symptom subscales. The findings for negative symptoms are generally consistent with those reported by Leitman et al. (Reference Leitman, Ziwich, Pasternak and Javitt2006), who also used the SANS. However, that study did not find a significant relationship between sarcasm and positive symptoms, perhaps because they used a different measure (BPRS versus SAPS). In general, reviews of the literature have yielded mixed findings for a relationship between ToM and positive and negative symptoms. The inconsistencies across studies may be due to differences in the samples, the measures used to assess symptom severity, the area of ToM assessed (e.g. first- and second-order false beliefs, sarcasm, irony), and the ToM measures used.
The study is limited by the lack of inclusion of other measures of ToM to evaluate how comprehension of sarcasm and lies compares with other ToM abilities such as understanding first- and second-order false beliefs, metaphors, jokes, empathy, or adult faux pas. In addition, a broad-based neurocognitive battery was not administered, so we cannot make claims about the independence of observed group effects on this measure relative to differences in general cognitive functioning. The schizophrenia sample was composed of stable chronic out-patients and we do not know whether these findings may extend to more acute patients or those early in the course of their illness.
In sum, this report is the first, to our knowledge, to use videotape recordings of social interactions to assess ToM in schizophrenia. In terms of ecological validity, TASIT has advantages over paper-and-pencil measures and more closely captures the kinds of ToM processes involved in daily interactions with others in everyday conversations. This study showed a differential impairment in the ability to perceive sarcasm versus lies for persons with schizophrenia. Although intriguing, this finding requires replication in other independent studies using TASIT or similar measures.
Appendix
Scene 2 (sarcasm)
RUTH Did Rosie write on your book? She sometimes does that.
GARY No. No. She didn't write on it.
RUTH Well, I had to punish her for it the other day.
Camera shot. Gary holds up the book for Ruth to see. The page is covered in red crayon scribbles.
RUTH I thought she learned her lesson.
GARY Well, you certainly taught her a good lesson.
Scene 3 (lie)
jane Hi.
ROWAN Hey.
JANE How's it going?
ROWAN Good. Billy brought back your CDs. You better check if they're okay.
Camera shot. Jane opens the CD case and finds it empty, but she doesn't show it to Rowan.
JANE Yeah, they're okay.
ROWAN He can be so careless sometimes. I'd never lend him anything.
JANE Oh, I wouldn't call him careless. He can borrow my CDs any time.
Acknowledgments
We thank the patients for their participation in the project, and Mike DeGroot, Robin Kite, Jeff Nishii, and Samantha Swain for their help in the data collection. The project was supported by an NIMH Center grant to K.H.N. (P50 MH 66586).
Declaration of Interest
None.