1. Introduction
Segregation of dense sheared granular mixtures of different-sized particles occurs widely in both nature and industry. Examples include particle sorting during debris flow (Hutter, Svendsen & Rickenmann Reference Hutter, Svendsen and Rickenmann1996) and particle separation in rotating tumbler mixers (Ottino & Khakhar Reference Ottino and Khakhar2000; Meier, Lueptow & Ottino Reference Meier, Lueptow and Ottino2007). In most circumstances, size segregation is undesirable and even destructive. Therefore, a model that can quantitatively predict size segregation is useful. This model should be capable of predicting two aspects of the process: (i) the final particle configurations when segregation reaches steady state; and (ii) the transient behaviour of size segregation that influences the efficiency of various industrial processes (e.g. segregation and mixing rate). While several models have been developed to predict size segregation in recent years (Shinohara, Shoji & Tanaka Reference Shinohara, Shoji and Tanaka1972; Boutreux Reference Boutreux1998; Khakhar, Orpe & Ottino Reference Khakhar, Orpe and Ottino2001; Gray & Thornton Reference Gray and Thornton2005; Gray & Chugunov Reference Gray and Chugunov2006; Gray, Shearer & Thornton Reference Gray, Shearer and Thornton2006; Shearer, Gray & Thornton Reference Shearer, Gray and Thornton2008; Thornton & Gray Reference Thornton and Gray2008; Gray & Ancey Reference Gray and Ancey2009; May et al. Reference May, Golick, Phillips, Shearer and Daniels2010; Fan & Hill Reference Fan and Hill2011; Woodhouse et al. Reference Woodhouse, Thornton, Johnson, Kokelaar and Gray2012; Tunuguntla, Bokhove & Thornton Reference Tunuguntla, Bokhove and Thornton2014; Fan et al. Reference Fan, Schlick, Umbanhowar, Ottino and Lueptow2014a ), most consider less complicated granular flows, such as plug, annular shear or chute flow. Although some of these studies (Gray & Thornton Reference Gray and Thornton2005; Gray et al. Reference Gray, Shearer and Thornton2006; Shearer et al. Reference Shearer, Gray and Thornton2008; Thornton & Gray Reference Thornton and Gray2008; Gray & Ancey Reference Gray and Ancey2009; Woodhouse et al. Reference Woodhouse, Thornton, Johnson, Kokelaar and Gray2012) considered time-dependent segregation problems, the time-dependent segregation models in these papers are for relatively simple flows and were not compared with or validated by experiments or simulations. In this paper, we use rotating tumbler flow, a flow with relatively complicated kinematics, as a model flow to develop a continuum model that quantitatively predicts both steady and transient size segregation.
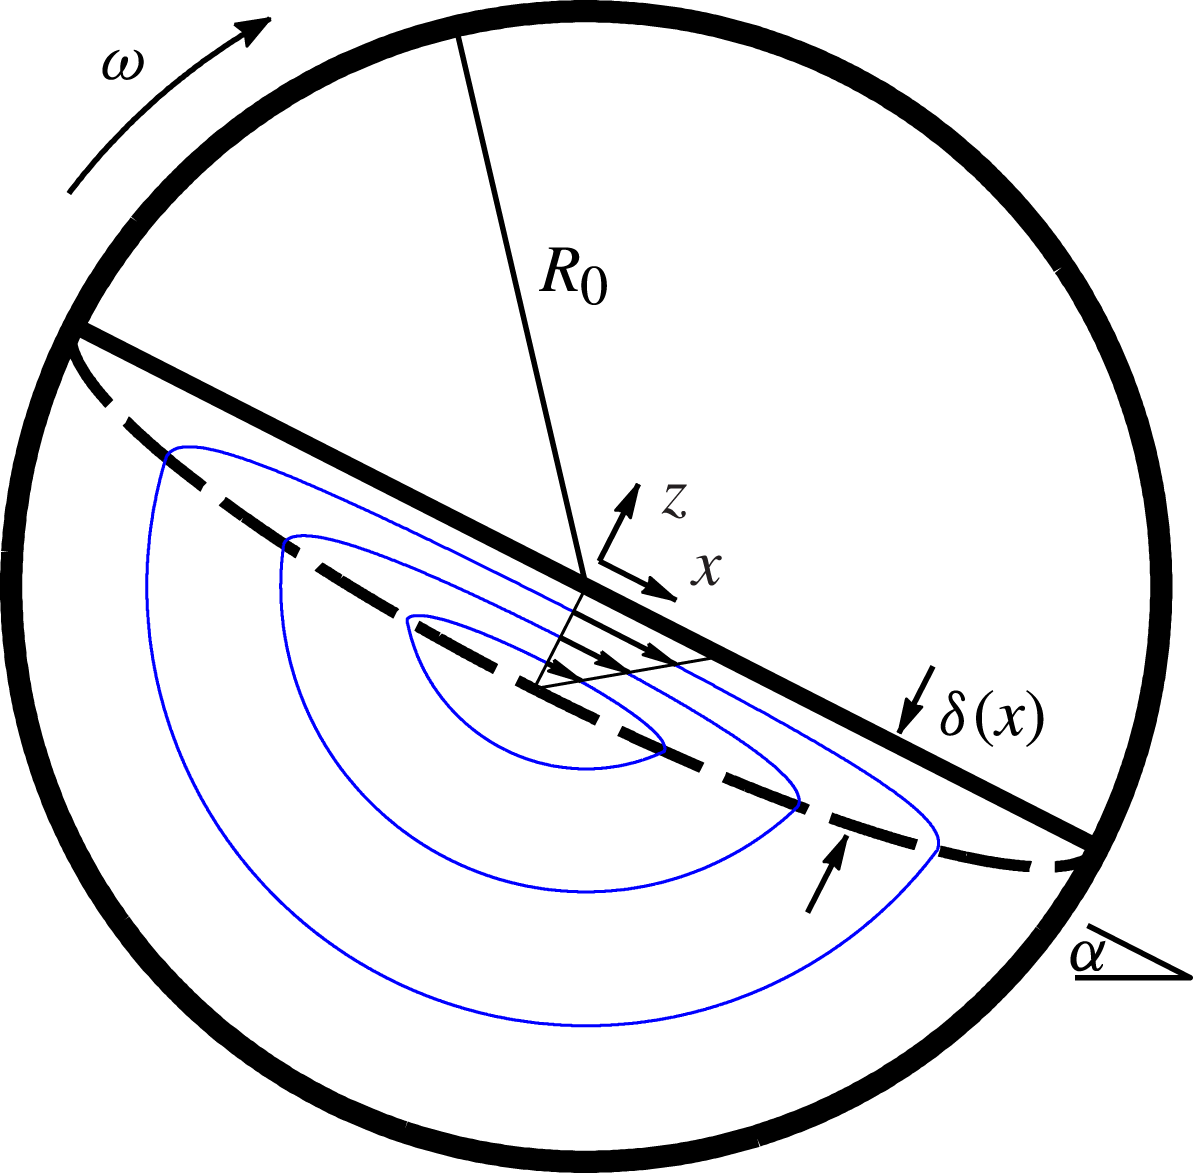
A schematic of continuous quasi-two-dimensional (quasi-2D) circular tumbler flow is shown in figure 1. As the tumbler rotates at angular velocity
 ${\it\omega}$
, most particles are in solid-body rotation (below the dashed curve in figure 1), rotating with the tumbler. In the flowing layer (above the dashed curve), particles quickly flow down the slope and re-enter solid-body rotation in the downstream half of the flowing layer (see the streamlines in figure 1). For a size bidisperse system, small particles (with diameter
 $d_{s}$
) in the flowing layer fall between large particle voids, percolate downwards and enter solid-body rotation towards the centre of the tumbler. Large particles (with diameter
 $d_{l}$
) segregate upwards, are advected to the end of the flowing layer and enter solid-body rotation near the cylindrical tumbler wall (Williams Reference Williams1968; Drahun & Bridgwater Reference Drahun and Bridgwater1983; Savage & Lun Reference Savage and Lun1988; Ottino & Khakhar Reference Ottino and Khakhar2000).
Schematic of continuous flow in a 50 % full quasi-2D circular tumbler with radius
 $R_{0}$
rotating clockwise at angular velocity
 ${\it\omega}$
. Particles are in solid-body rotation below the dashed curve, enter the flowing layer in the upstream (left) half of the flowing layer, flow down the flowing layer (above the dashed curve) and re-enter solid-body rotation in the downstream (right) half of the flowing layer. The flowing layer has thickness
 ${\it\delta}(x)$
and the angle of repose is
 ${\it\alpha}$
. The
 $x$
coordinate is the streamwise direction, the
 $y$
coordinate is the spanwise direction and the
 $z$
coordinate is normal to the free surface. The origin is located at the centre of the tumbler. Streamlines for mean particle trajectories are shown as grey (blue online) curves;
 $u$
and
 $w$
are the velocities in the
 $x$
and
 $z$
directions, respectively.

Various segregation patterns are observed in tumbler flow when the tumbler geometry or operating conditions are varied. For less than 50 % full circular tumblers rotating with a constant angular velocity, radial segregation patterns in which small particles accumulate in the middle of the bed of particles, while large particles accumulate near the outer tumbler walls, have been observed in both experiments (Cantelaube & Bideau Reference Cantelaube and Bideau1995; Metcalfe Reference Metcalfe1996; Hill et al. Reference Hill, Khakhar, Gilchrist, McCarthy and Ottino1999; Jain, Ottino & Lueptow Reference Jain, Ottino and Lueptow2005; Meier et al. Reference Meier, Lueptow and Ottino2007; Gray & Ancey Reference Gray and Ancey2011) and simulations (Dury & Ristow Reference Dury and Ristow1997, Reference Dury and Ristow1999; Pereira & Cleary Reference Pereira and Cleary2013; Alizadeh, Bertrand & Chaouki Reference Alizadeh, Bertrand and Chaouki2014; Arntz et al. Reference Arntz, Beeftink, den Otter, Briels and Boom2014). In addition to radial segregation patterns, lobed segregation patterns are observed for circular tumblers more than 50 % full (Gray & Hutter Reference Gray and Hutter1997; Hill, Gioia & Amaravadi Reference Hill, Gioia and Amaravadi2004; Meier et al. Reference Meier, Lueptow and Ottino2007, Reference Meier, Barreiro, Ottino and Lueptow2008), in circular tumblers with a non-uniform rotation speed (Fiedor & Ottino Reference Fiedor and Ottino2005) and in steadily rotating non-circular tumblers (Hill et al. Reference Hill, Khakhar, Gilchrist, McCarthy and Ottino1999; Ottino & Khakhar Reference Ottino and Khakhar2000; Cisar, Umbanhowar & Ottino Reference Cisar, Umbanhowar and Ottino2006; Meier et al. Reference Meier, Cisar, Lueptow and Ottino2006, Reference Meier, Lueptow and Ottino2007).
To model the segregation patterns observed in experiments and computational simulations, several theoretical approaches have been developed. Poincaré sections have long been used to explain the segregation patterns that occur in tumbler flows (Hill et al. Reference Hill, Khakhar, Gilchrist, McCarthy and Ottino1999; Cisar et al. Reference Cisar, Umbanhowar and Ottino2006; Meier et al. Reference Meier, Lueptow and Ottino2007; Christov, Ottino & Lueptow Reference Christov, Ottino and Lueptow2010). Cisar et al. (Reference Cisar, Umbanhowar and Ottino2006) developed a Lagrangian segregation model that incorporated the mean velocity of small and large particles, as well as a segregation velocity and a Langevin term to represent diffusion. From an Eulerian point of view, strange eigenmodes have been used to combine advection and diffusion to explain segregation patterns in non-circular tumblers (Christov, Ottino & Lueptow Reference Christov, Ottino and Lueptow2011). While results from these studies qualitatively matched experiments and discrete element method (DEM) simulations, the methods used in them alone cannot predict the segregation patterns and the degree of segregation based on the particle sizes, the rotation speed and the tumbler radius.
Several continuum models have been proposed for size segregation in tumblers (Prigozhin & Kalman Reference Prigozhin and Kalman1998; Chakraborty, Nott & Prakash Reference Chakraborty, Nott and Prakash2000; Khakhar et al. Reference Khakhar, Orpe and Ottino2001). However, these approaches have major shortcomings, such as assuming the flowing layer depth to be infinitely thin (Prigozhin & Kalman Reference Prigozhin and Kalman1998), completely separating the small particles and large particles (Khakhar et al. Reference Khakhar, Orpe and Ottino2001) and assuming large and small particles are approximately the same size, so the variation in small- and large-particle concentrations is small (Chakraborty et al. Reference Chakraborty, Nott and Prakash2000). These assumptions oversimplify the effect of key physical properties of segregation, so that it is difficult to predict and understand segregation patterns quantitatively across a broad range of physical parameters.
In this paper, we use a continuum approach based on the generic transport equation to model bidisperse size segregation in rotating circular tumblers. This continuum model has been developed and used by several research groups (Bridgwater, Foo & Stephens Reference Bridgwater, Foo and Stephens1985; Savage & Lun Reference Savage and Lun1988; Dolgunin & Ukolov Reference Dolgunin and Ukolov1995; Gray & Thornton Reference Gray and Thornton2005; Gray & Chugunov Reference Gray and Chugunov2006; Gray & Ancey Reference Gray and Ancey2009; May et al.
Reference May, Golick, Phillips, Shearer and Daniels2010; Fan & Hill Reference Fan and Hill2011; Marks, Rognon & Einav Reference Marks, Rognon and Einav2012) in different flow geometries and has achieved success in modelling size segregation qualitatively. Most recently, within this theoretical framework, we developed a model that considers the roles of three mechanisms: advection, shear-dependent percolation and collisional diffusion (Fan et al.
Reference Fan, Schlick, Umbanhowar, Ottino and Lueptow2014a
). The model predicted size bidisperse segregation in bounded heap flow quantitatively and revealed that all three mechanisms are important when modelling size segregation in complex granular flows. Specifically, using this approach, we found that the segregation patterns in bounded heaps depend on two dimensionless parameters: a parameter related to advection and segregation,
 ${\it\Lambda}$
; and a Péclet number,
 $\mathit{Pe}$
, related to advection and collisional diffusion. In tumbler flow, in addition to
 ${\it\Lambda}$
and
 $\mathit{Pe}$
, segregation also depends on a third dimensionless parameter,
 ${\it\epsilon}$
, the dimensionless depth of the flowing layer. Using this continuum equation approach, we parametrically study segregation patterns in 50 % full circular tumblers as a function of these three dimensionless parameters.
In contrast to quasi-2D bounded heaps (the system considered by Fan et al. (Reference Fan, Schlick, Umbanhowar, Ottino and Lueptow2014a )), tumbler flow presents new challenges. First, in tumbler flow, the flowing layer depth varies with streamwise position, while the flowing layer in the bounded heap is assumed to have a constant depth. Second, as the segregation pattern develops, tumbler flow is time-dependent, while in bounded heaps it is sufficient to consider steady-state flow. The time-dependent model allows the study of modulated flow, where the rotation speed varies with time.
2. Modelling tumbler flow
Here, for simplicity, we consider only half-full tumblers (sketched in figure 1), but the approach can readily be applied to other fill levels. Additionally, we consider only continuously flowing material for which the surface of the flowing layer is flat, which occurs when the Froude number,
 $\mathit{Fr}={\it\omega}^{2}R_{0}/g$
, which represents the ratio of inertial to gravitational forces, is in the range
 $10^{-4}<\mathit{Fr}<10^{-2}$
(Mellmann Reference Mellmann2001; Meier et al.
Reference Meier, Lueptow and Ottino2007). For Froude numbers not in this range, either avalanching, cataracting or centrifuging occurs, and different segregation mechanisms and patterns are possible (Meier et al.
Reference Meier, Lueptow and Ottino2007).
There have been many previous studies of flow kinematics in tumblers (Makse Reference Makse1999; Orpe & Khakhar Reference Orpe and Khakhar2001; Alexander, Shinbrot & Muzzio Reference Alexander, Shinbrot and Muzzio2002; Bonamy, Daviaud & Laurent Reference Bonamy, Daviaud and Laurent2002; Jain, Ottino & Lueptow Reference Jain, Ottino and Lueptow2002; Meier et al. Reference Meier, Lueptow and Ottino2007). The velocity field in the flowing layer can be assumed to have a constant shear rate (Jain, Ottino & Lueptow Reference Jain, Ottino and Lueptow2004; Meier et al. Reference Meier, Lueptow and Ottino2007), yielding the velocity field
 $$\begin{eqnarray}\displaystyle u(x,z) & = & \displaystyle \left\{\begin{array}{@{}ll@{}}{\it\omega}\left({\displaystyle \frac{R_{0}^{2}}{{\it\delta}_{0}^{2}}}-1\right)\left(z+{\it\delta}(x)\right)\quad & \text{if }z>-{\it\delta}(x),\\ {\it\omega}z\quad & \text{if }z\leqslant -{\it\delta}(x),\end{array}\right.\end{eqnarray}$$
 $$\begin{eqnarray}\displaystyle & & \displaystyle \nonumber\\ \displaystyle w(x,z) & = & \displaystyle \left\{\begin{array}{@{}ll@{}}{\it\omega}\left(1-{\displaystyle \frac{{\it\delta}_{0}^{2}}{R_{0}^{2}}}\right){\displaystyle \frac{xz}{{\it\delta}(x)}}\quad & \text{if }z>-{\it\delta}(x),\\ -{\it\omega}x\quad & \text{if }z\leqslant -{\it\delta}(x),\end{array}\right.\end{eqnarray}$$
 $R_{0}$
is the tumbler radius,
 $u$
and
 $w$
are the velocity components in the streamwise (
 $x$
) and normal (
 $z$
) directions, respectively, and
 ${\it\omega}$
is the rotation rate. Here,
 ${\it\delta}(x)$
is the flowing layer thickness at streamwise location
 $x$
and is defined as (Makse Reference Makse1999; Meier et al.
Reference Meier, Lueptow and Ottino2007)
 $$\begin{eqnarray}{\it\delta}(x)={\it\delta}_{0}\sqrt{1-\left(\frac{x}{R_{0}}\right)^{2}},\end{eqnarray}$$
where
 ${\it\delta}_{0}$
is the maximum thickness of the flowing layer. It is important to note that the velocity field given in (2.1) is an approximation. This is evident as there is a discontinuity at the bottom of the flowing layer (
 $z=-{\it\delta}(x)$
). However, since the particle velocity in solid-body rotation near the bottom of the flowing layer is small if
 ${\it\delta}_{0}/R_{0}$
is not too large, the discontinuity is inconsequential for the purposes of this approach, and (2.1) well describes the velocity of particles in a tumbler.
From (2.1a ), the surface velocity is
 $$\begin{eqnarray}u(x,0)={\it\omega}\left(\frac{R_{0}^{2}}{{\it\delta}_{0}}-{\it\delta}_{0}\right)\sqrt{1-\left(\frac{x}{R_{0}}\right)^{2}}.\end{eqnarray}$$
The velocity field, given by (2.1), is determined by
 $R_{0}$
,
 ${\it\omega}$
and
 ${\it\delta}_{0}$
. While previous work (Pignatel et al.
Reference Pignatel, Asselin, Krieger, Christov, Ottino and Lueptow2012) has extensively studied the relationship between
 ${\it\delta}_{0}$
and the system parameters, here we measure
 ${\it\delta}_{0}$
from DEM simulations. In addition to determining
 ${\it\delta}_{0}$
, DEM simulations are used to validate our theoretical modelling.
In DEM simulations, to compute the interactions between particles, we use a linear spring–dashpot force model for normal forces and a linear spring model with Coulomb friction for tangential forces. Details and validation of the DEM model appear in Fan et al. (Reference Fan, Umbanhowar, Ottino and Lueptow2013). In the simulations presented here, particles are millimetre-sized spheres with density
 ${\it\rho}_{p}=2500~\text{kg}~\text{m}^{-3}$
and restitution coefficient 0.8. Particle–particle and particle–wall friction coefficients are set to
 ${\it\mu}_{p}=0.4$
. The binary collision time is set to
 $t_{c}=10^{-3}~\text{s}$
for greater computational efficiency, yet sufficient for modelling hard spheres (Silbert et al.
Reference Silbert, Grest, Brewster and Levine2007). An integration time step of
 ${\rm\Delta}t=t_{c}/100=1\times 10^{-5}~\text{s}$
is used to assure numerical stability. To reduce particle ordering, particles of each species are given a uniform size distribution between
 $0.9d_{i}$
and
 $1.1d_{i}$
, where
 $d_{i}$
is the mean particle diameter for each species
 $i$
.
The simulated tumblers have two flat frictional endwalls separated by
 $4.33d_{l}$
. The tumbler radius is
 $R_{0}=75~\text{mm}$
, and the rotation speeds are 0.25, 0.5 and
 $0.75~\text{rad}~\text{s}^{-1}$
. The steady state for kinematics of the mixture is assumed to occur when the dynamic angle of repose,
 ${\it\alpha}$
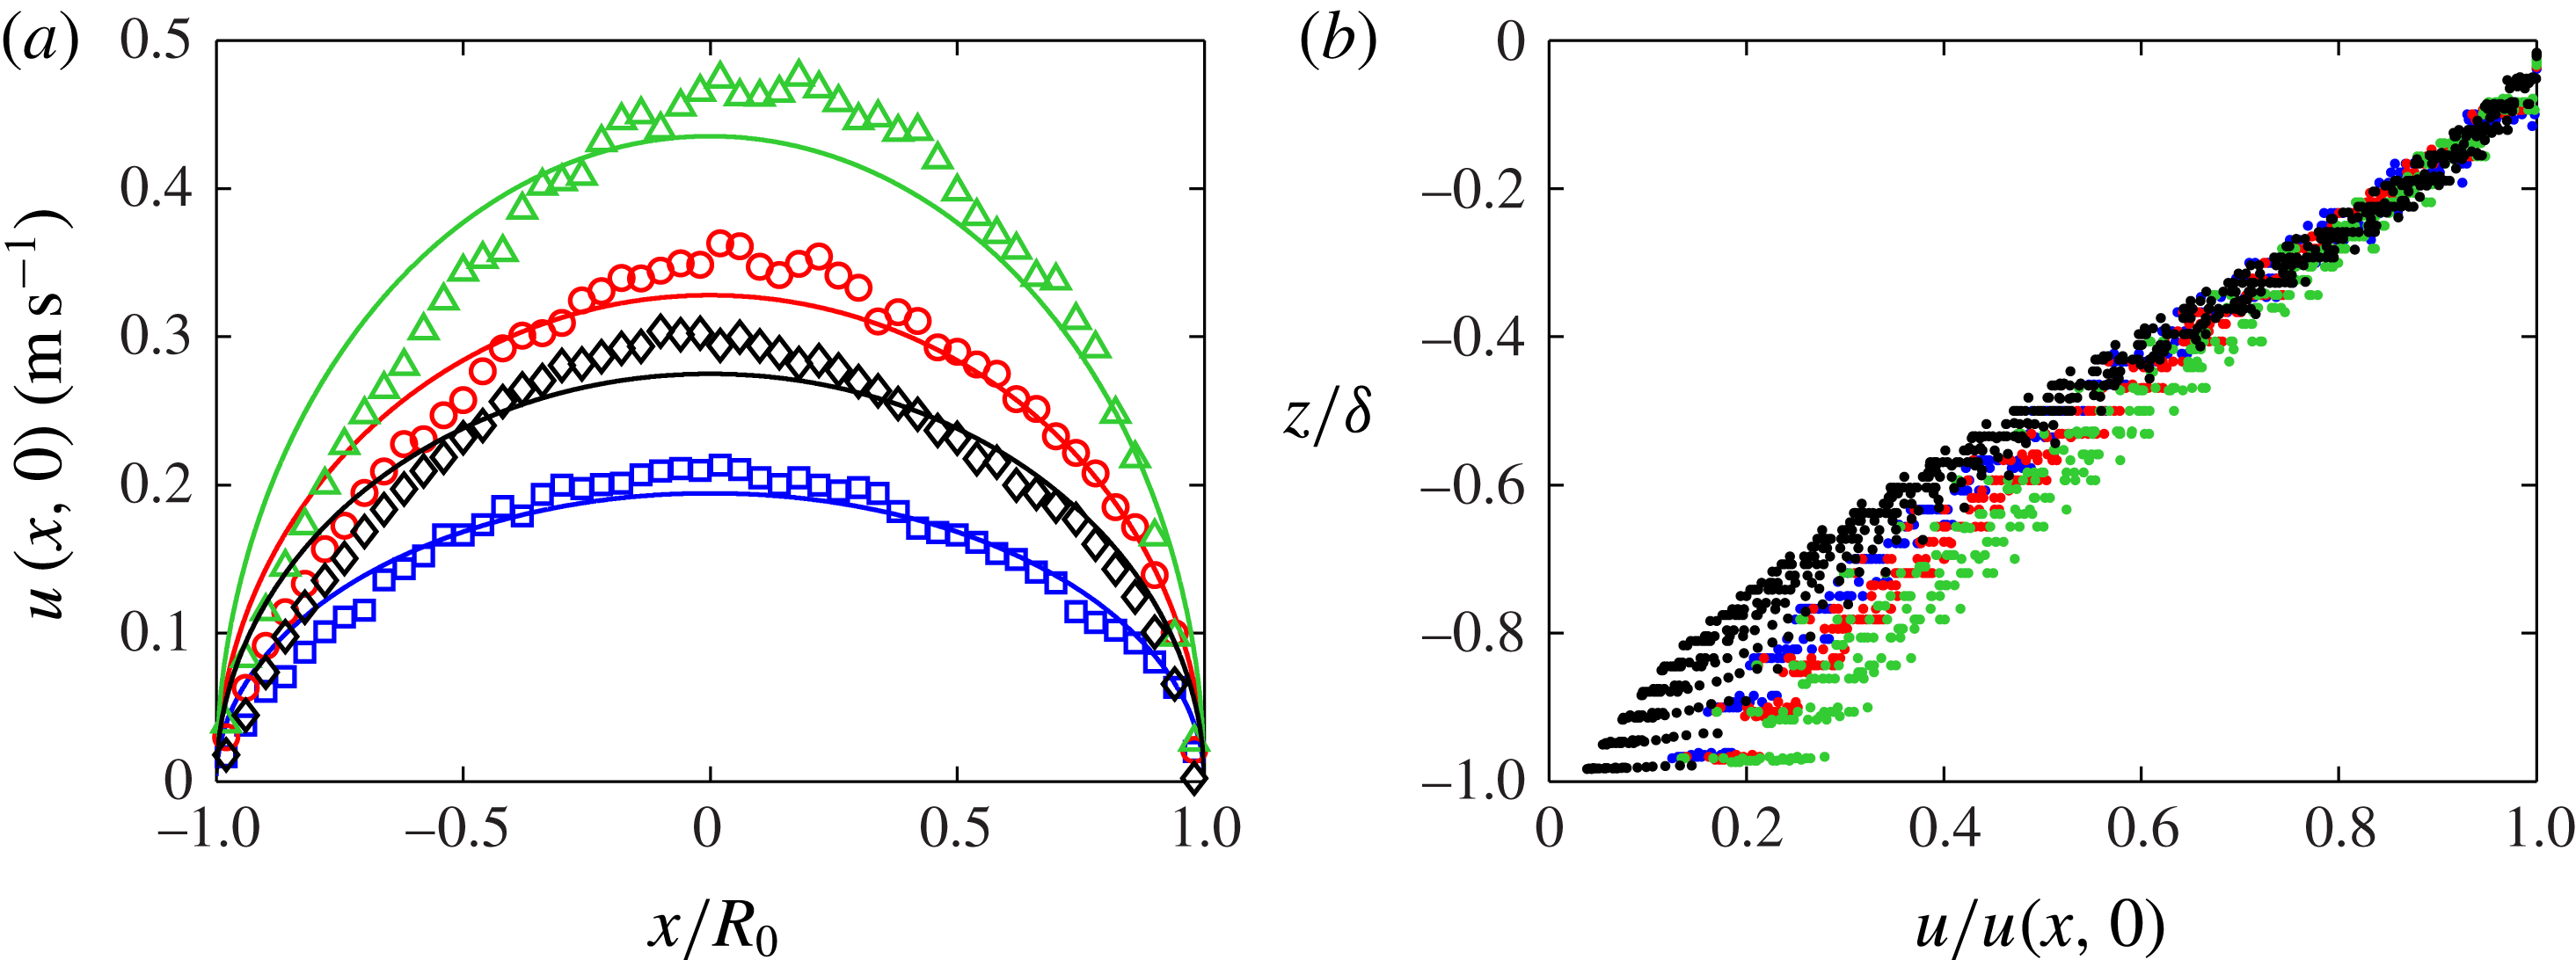
, the surface velocity at the origin and the degree of segregation no longer vary with time. Then the steady-state values of kinematic variables are measured by averaging over one rotation. Figure 2 shows data from DEM simulations of the surface velocity in the streamwise direction and the streamwise velocity profile in the depth direction at steady state. To determine
 ${\it\delta}_{0}$
, a nonlinear least-squares regression was implemented in MATLAB to fit the surface velocity from DEM simulations (figure 2(a)) to (2.3). As shown in figure 2(a), the surface velocity from the DEM simulations matches (2.3) reasonably well. In figure 2(b), the streamwise velocity
 $u$
is plotted as a function of
 $z$
for the same four DEM simulations shown in figure 2(a). The streamwise velocity decreases approximately linearly as
 $z$
decreases, justifying the form of the velocity field in (2.1a
). While the streamwise velocity in the DEM simulations does not decrease to zero at the bottom of the flowing layer as indicated by (2.1a
), it is close enough (between 5 and 20 % of the surface velocity) that the velocity field given by (2.1a
) provides a reasonable approximation to the flow for use in the theoretical model. This discrepancy is probably due to the discontinuity in the streamwise velocity
 $u$
in (2.1a
), as discussed previously.
(a) Surface velocity
 $u(x,0)$
versus streamwise position
 $x$
. Curves are fits of the DEM simulation data to (2.3):
 ${\it\omega}=0.25~\text{rad}~\text{s}^{-1}$
,
 $d_{s}=1~\text{mm}$
,
 $d_{l}=1.5~\text{mm}$
,
 ${\it\delta}_{0}=7.17~\text{mm}$
(dark grey, ▫, blue online);
 ${\it\omega}=0.50~\text{rad}~\text{s}^{-1}$
,
 $d_{s}=1~\text{mm}$
,
 $d_{l}=1.5~\text{mm}$
,
 ${\it\delta}_{0}=8.47~\text{mm}$
(mid-grey, ○, red online);
 ${\it\omega}=0.75~\text{rad}~\text{s}^{-1}$
,
 $d_{s}=1~\text{mm}$
,
 $d_{l}=1.5~\text{mm}$
,
 ${\it\delta}_{0}=9.54~\text{mm}$
(light grey, ▵, green online);
 ${\it\omega}=0.75~\text{rad}~\text{s}^{-1}$
,
 $d_{s}=1~\text{mm}$
,
 $d_{l}=3~\text{mm}$
,
 ${\it\delta}_{0}=14.8~\text{mm}$
(black, ♢). For all datasets,
 $R_{0}=75~\text{mm}$
and the gap between the endwalls is
 $4.33d_{l}$
. (b) Streamwise velocity profile at various streamwise locations for the DEM simulations shown in (a) with corresponding greyscales (colors).

3. Segregation model
To model segregation in tumbler flow, the transport equation model (Fan et al. Reference Fan, Schlick, Umbanhowar, Ottino and Lueptow2014a ) is applied to the flowing layer:
 $$\begin{eqnarray}\frac{\partial c_{i}}{\partial t}+\boldsymbol{{\rm\nabla}}\boldsymbol{\cdot }(\boldsymbol{u}c_{i})+\frac{\partial }{\partial z}(w_{p,i}c_{i})=\boldsymbol{{\rm\nabla}}\boldsymbol{\cdot }(D\boldsymbol{{\rm\nabla}}c_{i}),\quad x\in [-R_{0},R_{0}],\quad z\in [-{\it\delta}(x),0].\end{eqnarray}$$
The second term on the left-hand side represents advective transport due to the mean flow of particles, while the third term represents transport normal to the free surface due to segregation (it is assumed that both species have the same velocity in the streamwise direction). The right-hand side of the equation represents collisional diffusion. In bidisperse mixtures,
 $i$
refers to the small or large particles (i.e.
 $i=s$
or
 $i=l$
), and no subscript is used for variables representing the combined flow. The concentration of species
 $i$
is defined as
 $c_{i}=f_{i}/f$
, where
 $f_{i}$
is the volume fraction of species
 $i$
and
 $f=f_{s}+f_{l}$
. Vector
 $\boldsymbol{u}=u\hat{\boldsymbol{x}}+v\hat{\boldsymbol{y}}+w\hat{\boldsymbol{z}}$
is the mean velocity field of the flow (both species),
 $D$
is the diffusion coefficient and
 $w_{p.i}=w_{i}-w$
is the percolation velocity of species
 $i$
, which accounts for motion relative to the mean flow in the normal direction. Below the flowing layer, particles are assumed to be in solid-body rotation, so no segregation or diffusion occurs ((3.1) with
 $w_{p,i}=0$
and
 $D=0$
).
The percolation velocity of each species in a bidisperse mixture can be approximated as a linear function of the shear rate and the concentration of the other species (Savage & Lun Reference Savage and Lun1988; Gray & Thornton Reference Gray and Thornton2005; Fan et al. Reference Fan, Schlick, Umbanhowar, Ottino and Lueptow2014a ):
 $$\begin{eqnarray}w_{p,s}=-S\dot{{\it\gamma}}(1-c_{s}),\quad w_{p,l}=S\dot{{\it\gamma}}(1-c_{l}).\end{eqnarray}$$
Here
 $\dot{{\it\gamma}}$
is the shear rate, with
 $\dot{{\it\gamma}}=\partial u/\partial z+\partial w/\partial x\approx \partial u/\partial z$
, since
 $u\gg w$
in most of the flowing layer if
 $R_{0}\gg {\it\delta}_{0}$
, and
 $S$
is the percolation length scale, which depends on the particle sizes and the particle size ratio (Fan et al.
Reference Fan, Schlick, Umbanhowar, Ottino and Lueptow2014a
). While it would be possible to measure
 $S$
directly from the tumbler simulations using the methodology described in Fan et al. (Reference Fan, Schlick, Umbanhowar, Ottino and Lueptow2014a
), it would be necessary to do so during the unsteady portion of the flow when segregation is not complete. At steady-state segregation, it is not possible to get a reliable value for the percolation velocity because small and large particles are almost completely separated. Since steady-state segregation occurs quickly (after approximately one rotation), it is difficult to obtain a time-averaged value for the percolation velocity and accurately estimate
 $S$
for the tumbler without running a large number of DEM simulations. In contrast, segregation occurs continuously in steady state in the flowing layer of bounded heaps (as explored in Fan et al. (Reference Fan, Schlick, Umbanhowar, Ottino and Lueptow2014a
) and Schlick et al. (Reference Schlick, Fan, Isner, Umbanhowar, Ottino and Lueptow2015)), making it quite easy to measure the percolation velocity, and thus
 $S$
, in steady state. Since the percolation velocity accounts for local particle segregation under shear, it depends only on the local kinematics. For this reason, we use the relation for
 $S$
from DEM simulations of quasi-2D bounded heap flow (of millimetre-sized spherical glass particles) (Schlick et al.
Reference Schlick, Fan, Isner, Umbanhowar, Ottino and Lueptow2015). This further allows us to explore the general applicability of particle segregation results obtained with one flow system to segregation in another. The relation for
 $S$
(Schlick et al.
Reference Schlick, Fan, Isner, Umbanhowar, Ottino and Lueptow2015) is
 $$\begin{eqnarray}S(d_{s},d_{l})=0.26d_{s}\log \left(\frac{d_{l}}{d_{s}}\right)\!.\end{eqnarray}$$
To non-dimensionalize (3.1), lengths are scaled by
 $R_{0}$
and time is scaled by
 $1/{\it\omega}$
. Dimensionless variables are denoted with a tilde. The dimensionless velocities in the flowing layer (
 $-{\it\epsilon}\sqrt{1-\tilde{x}^{2}}<\tilde{z}<0$
) are
 $$\begin{eqnarray}\left.\begin{array}{@{}l@{}}\tilde{u} (\tilde{x},\tilde{z};{\it\epsilon})=\displaystyle \frac{1-{\it\epsilon}^{2}}{{\it\epsilon}^{2}}\left(\tilde{z}+{\it\epsilon}\sqrt{1-\tilde{x}^{2}}\right)\!,\\ \tilde{w}(\tilde{x},\tilde{z};{\it\epsilon})=\displaystyle \frac{1-{\it\epsilon}^{2}}{{\it\epsilon}}\frac{\tilde{x}\tilde{z}}{\sqrt{1-\tilde{x}^{2}}},\end{array}\right\}\end{eqnarray}$$
where
 ${\it\epsilon}\equiv {\it\delta}_{0}/R_{0}$
is the dimensionless flowing layer depth.
Averaging over the spanwise (
 $y$
) direction, neglecting diffusion in the streamwise (
 $x$
) direction (as we are primarily interested in diffusion acting in opposition to segregation), assuming diffusion is constant in the flowing layer (as in Fan et al. (Reference Fan, Schlick, Umbanhowar, Ottino and Lueptow2014a
)) and changing to dimensionless variables, (3.1) becomes
 $$\begin{eqnarray}\frac{\partial c_{i}}{\partial \tilde{t}}+\tilde{u} \frac{\partial c_{i}}{\partial \tilde{x}}+\tilde{w}\frac{\partial c_{i}}{\partial \tilde{z}}\pm {\it\Lambda}{\it\epsilon}\frac{\partial }{\partial \tilde{z}}\left[c_{i}(1-c_{i})\right]=\frac{{\it\epsilon}^{2}}{\mathit{Pe}}\frac{\partial ^{2}c_{i}}{\partial \tilde{z}^{2}},\end{eqnarray}$$
where the ‘
 $+$
’ sign is taken for large particles and the ‘
 $-$
’ sign is taken for small particles. Here
 ${\it\Lambda}=S(1-{\it\epsilon}^{2})/R_{0}{\it\epsilon}^{3}$
is the ratio of the advection time scale to the segregation time scale,
 ${\it\Lambda}=(1/{\it\omega})/({\it\delta}_{0}/w_{p,l})=(1/{\it\omega})/({\it\delta}_{0}/S\dot{{\it\gamma}})$
, and
 $\mathit{Pe}={\it\omega}R_{0}^{2}{\it\epsilon}^{2}/D$
is the ratio of the diffusion time scale to the advection time scale,
 $\mathit{Pe}=({\it\delta}_{0}^{2}/D)/(1/{\it\omega})$
. The numerical method used to solve this equation (with proper boundary conditions (Gray & Chugunov Reference Gray and Chugunov2006)) is described shortly. Note that
 ${\it\epsilon}$
appears in (3.5) apart from the parameters
 ${\it\Lambda}$
and
 $\mathit{Pe}$
, since, for the same values of
 ${\it\Lambda}$
and
 $\mathit{Pe}$
but different
 ${\it\epsilon}$
, the ratio among the three time scales remains the same, which is discussed later in this section.
The dimensionless parameters
 ${\it\epsilon}$
,
 ${\it\Lambda}$
and
 $\mathit{Pe}$
determine the time evolution of the segregation in circular tumbler flow.
 ${\it\Lambda}$
and
 $\mathit{Pe}$
are functions of both the control parameters (tumbler radius
 $R_{0}$
, rotation rate
 ${\it\omega}$
and small- and large-particle diameters
 $d_{s}$
and
 $d_{l}$
) and the kinematic parameters (percolation length scale
 $S$
, maximum flowing layer depth
 ${\it\delta}_{0}$
and diffusion coefficient
 $D$
), which can be difficult to measure. Previous results have been used to express these kinematic parameters in terms of the control parameters:
 $S$
is a function of
 $d_{s}$
and
 $d_{l}$
only (see (3.3)) (Fan et al.
Reference Fan, Schlick, Umbanhowar, Ottino and Lueptow2014a
; Schlick et al.
Reference Schlick, Fan, Isner, Umbanhowar, Ottino and Lueptow2015),
 $D$
is related to the particle sizes and the shear rate (Fan et al.
Reference Fan, Schlick, Umbanhowar, Ottino and Lueptow2014a
, Reference Fan, Umbanhowar, Ottino and Lueptow2015), and
 ${\it\delta}_{0}$
is a function of the tumbler radius, the particle sizes and the rotation velocity (Pignatel et al.
Reference Pignatel, Asselin, Krieger, Christov, Ottino and Lueptow2012).
The segregation model, given by (3.5), has been previously applied to bounded heap flow in steady state, and good agreement between the model, DEM simulations and experiments was observed (Fan et al. Reference Fan, Schlick, Umbanhowar, Ottino and Lueptow2014a ; Schlick et al. Reference Schlick, Fan, Isner, Umbanhowar, Ottino and Lueptow2015). Tumbler flow, however, is more challenging since there is an initial transient as the initially mixed particles segregate. Moreover, the flowing layer depth for bounded heaps can be assumed to be constant, while the flowing layer depth for tumblers varies with position, further complicating the application of (3.5). Nevertheless, (3.5) can be solved to give particle concentrations at any time during the initial transient through formation of the steady-state segregation pattern.
To solve (3.5) in the flowing layer, boundary conditions are required. At the bottom and top of the flowing layer (
 $z=-{\it\delta}(x),0$
), the segregation flux is equal to the diffusive flux (Gray & Chugunov Reference Gray and Chugunov2006),
 $$\begin{eqnarray}\pm {\it\Lambda}{\it\epsilon}c_{i}(1-c_{i})=\frac{{\it\epsilon}^{2}}{\mathit{Pe}}\frac{\partial c_{i}}{\partial \tilde{\tilde{z}}}.\end{eqnarray}$$
The boundary condition at the bottom of the flowing layer requires that particles do not leave the flowing layer due to diffusion or segregation, but leave due to advection alone, so that the mass of each species is conserved in the entire tumbler. For more details on the validity of this boundary condition, see Fan et al. (Reference Fan, Schlick, Umbanhowar, Ottino and Lueptow2014a ).
Equation (3.5) is solved with an operator splitting scheme (Christov et al. Reference Christov, Ottino and Lueptow2011; Schlick et al. Reference Schlick, Christov, Umbanhowar, Ottino and Lueptow2013), which solves the advection step and the segregation/diffusion step separately. The advection step is solved with a matrix mapping method (Singh et al. Reference Singh, Galaktionov, Meijer and Anderson2009), and the segregation/diffusion step is solved with the implicit Crank–Nicolson method. The numerical method is detailed in our previous work (Fan et al. Reference Fan, Schlick, Umbanhowar, Ottino and Lueptow2014a ).
To justify including
 ${\it\epsilon}$
as a separate parameter in addition to
 ${\it\Lambda}$
and
 $\mathit{Pe}$
in (3.5), consider the segregation/diffusion step in the operator splitting scheme:
 $$\begin{eqnarray}\frac{\partial c_{i}}{\partial \tilde{t}}\pm {\it\Lambda}{\it\epsilon}\frac{\partial }{\partial \tilde{z}}\left[c_{i}(1-c_{i})\right]=\frac{{\it\epsilon}^{2}}{\mathit{Pe}}\frac{\partial ^{2}c_{i}}{\partial \tilde{z}^{2}},\end{eqnarray}$$
where
 $-{\it\epsilon}\sqrt{1-\tilde{x}^{2}}<\tilde{z}<0$
. Let
 $\tilde{z}^{\prime }=\tilde{z}/{\it\epsilon}$
, so that (3.7) is transformed to
 $$\begin{eqnarray}\frac{\partial c_{i}}{\partial \tilde{t}}\pm {\it\Lambda}\frac{\partial }{\partial \tilde{z}^{\prime }}\left[c_{i}(1-c_{i})\right]=\frac{1}{\mathit{Pe}}\frac{\partial ^{2}c_{i}}{\partial \tilde{z}^{\prime 2}},\end{eqnarray}$$
where
 $-\sqrt{1-\tilde{x}^{2}}<\tilde{z}^{\prime }<0$
. Since (3.8) no longer depends on
 ${\it\epsilon}$
, it would be expected that, for
 ${\it\Lambda}$
and
 $\mathit{Pe}$
constant, similar segregation patterns should occur for different
 ${\it\epsilon}$
. Note that it is not expected that the segregation patterns (nor the time to reach steady state) should be identical, since the velocity field and the geometry of the flowing layer depend on
 ${\it\epsilon}$
. The effect of
 ${\it\epsilon}$
on segregation patterns is discussed in detail in § 5.1.
4. Model predictions
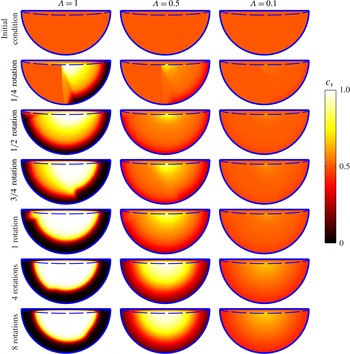
Figure 3 shows the evolution of the small-particle concentration for three different values of
 ${\it\Lambda}$
for an initially mixed (
 $c_{s}=c_{l}=0.5$
everywhere), clockwise-rotating tumbler with
 $\mathit{Pe}=10$
and
 ${\it\epsilon}=0.1$
. In each case, the small particles fall to the bottom of the flowing layer as they move downstream in the flowing layer (left to right in figure 1), and gather in the centre of the bed of particles in the tumbler; large particles rise to the top of the flowing layer as they move downstream, and accumulate near the cylindrical wall of the tumbler.
Theoretical predictions of small-particle concentrations (solution to (3.5)) in the particle-filled portion of the tumbler for three different flow and segregation conditions at various times, for
 $\mathit{Pe}=10$
and
 ${\it\epsilon}=0.1$
. Dashed curves indicate the bottom of the flowing layer.

Segregation is stronger in the first column of figure 3 than in the other two columns, since
 ${\it\Lambda}$
is larger. At
 $1/4$
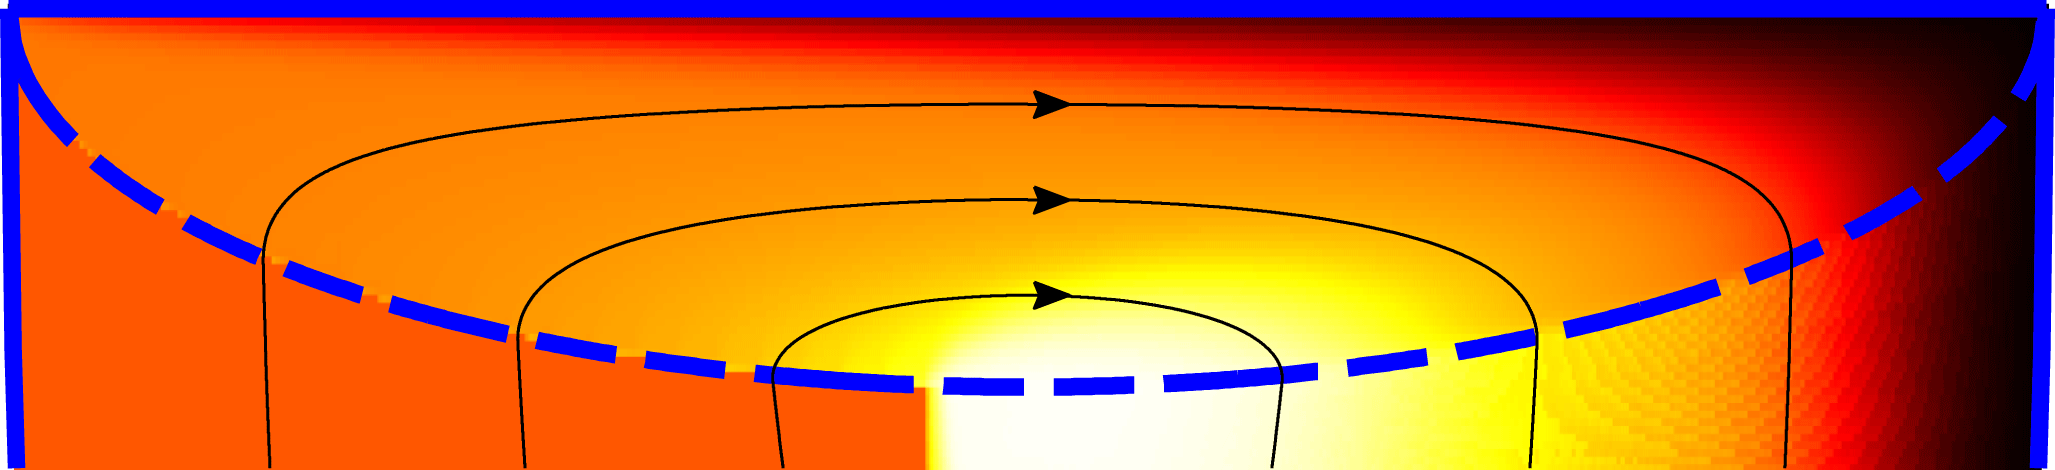
rotation, approximately half the particles have transited the flowing layer, while the other half have not. Particles that have not yet transited the flowing layer remain well mixed, while particles that have gone through the flowing layer have begun to segregate. This is evident in a close-up of the flowing layer for this case (first column of figure 3 after
 $1/4$
rotation) in figure 4. Particles (that have not yet gone through the flowing layer) enter the flowing layer mixed (grey; orange online) on the left, and as they flow down the flowing layer (left to right in figure 4), they segregate.
Close-up of the tumbler flowing layer after
 $1/4$
rotation for the case shown in the first column of figure 3. Dashed curve indicates the bottom of the flowing layer. Streamlines for the mean particle flow are shown as solid black curves. The greyscale (colour) map is the same as in figure 3.

After
 $1/2$
rotation in the first column of figure 3, most of the particles have passed through the flowing layer once and have begun to segregate; after 1 rotation, most of the particles have passed through the flowing layer twice, and the segregation is enhanced compared to
 $1/2$
rotation. The system has reached steady state after approximately 1 rotation, since there is not a large difference in the amount of segregation after 1 rotation compared to after 4 or 8 rotations. At a reduced
 ${\it\Lambda}$
(second column of figure 3), segregation takes longer and is not as strong, and steady state requires approximately 4 rotations to be reached. At the smallest value of
 ${\it\Lambda}$
(final column of figure 3), there is little segregation, except for a small core comprising a slightly higher concentration of small particles, which appears after approximately 4 rotations. The steady-state segregation pattern and the time it takes to achieve steady state is discussed in further detail in § 5.
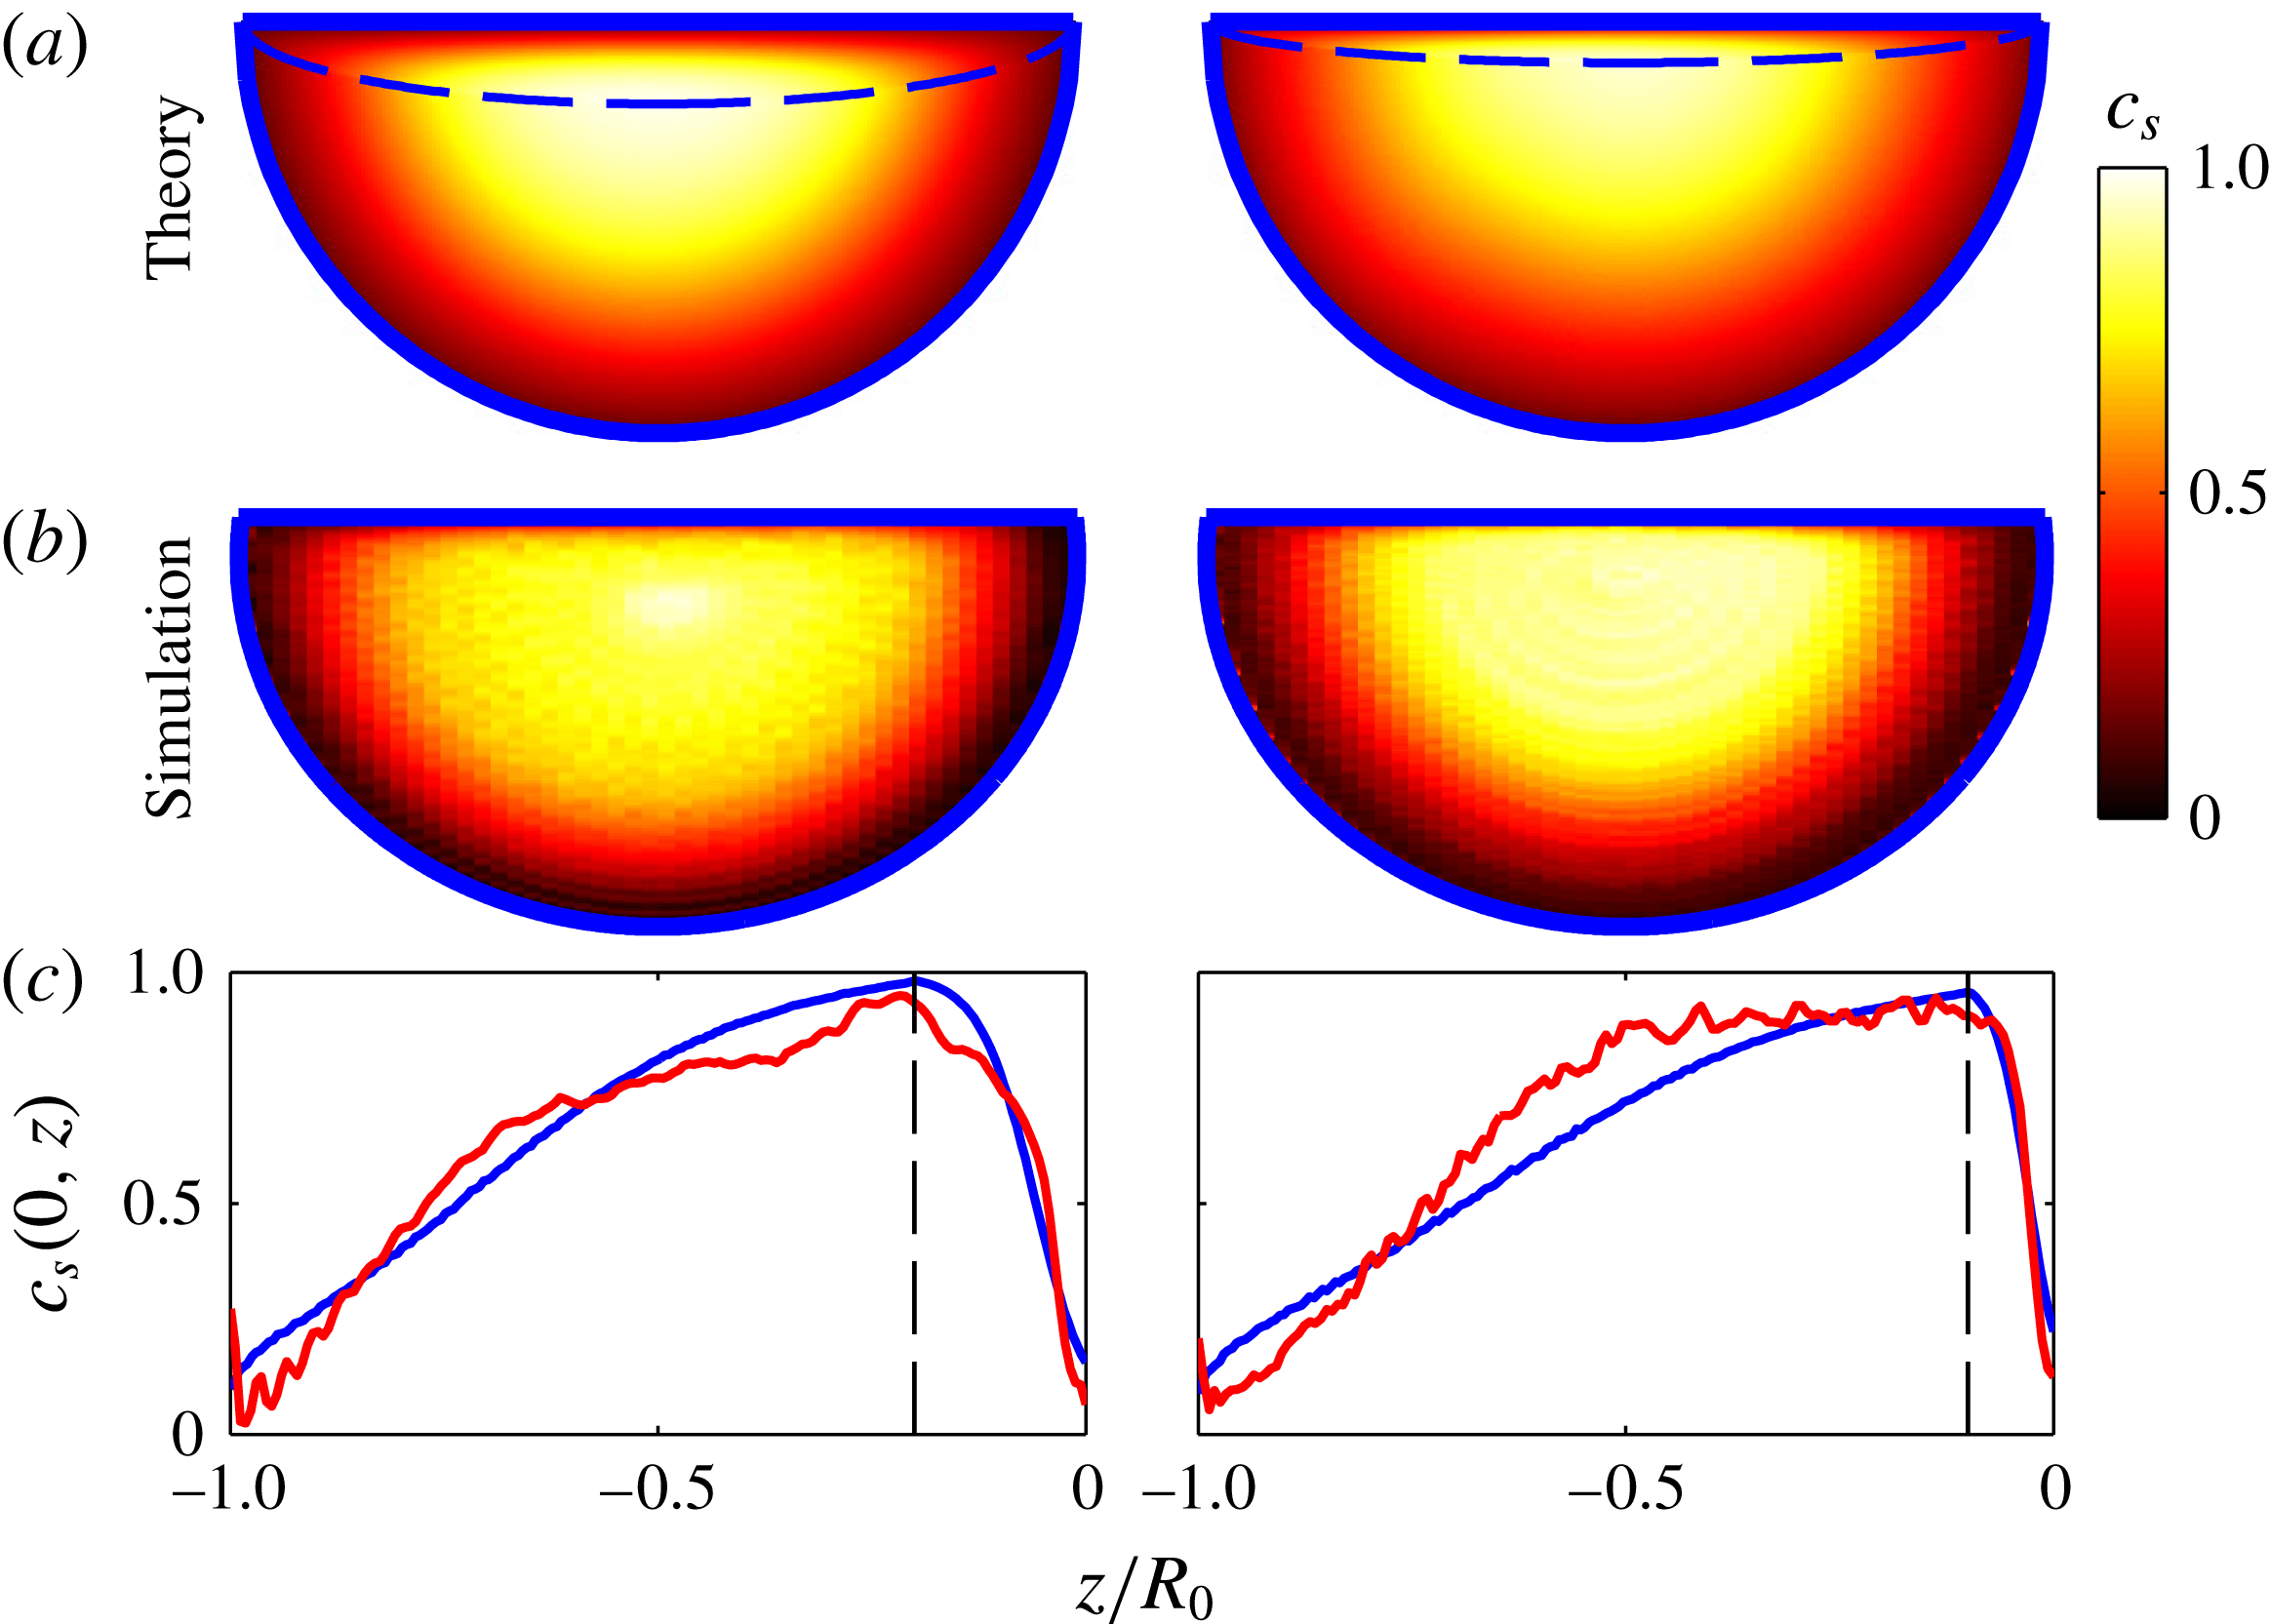
To validate the theoretical model, we compare particle concentrations from theory and DEM simulation for 1 and 3 mm diameter particles and 1 and 1.5 mm diameter particles in a tumbler with radius
 $R_{0}=75~\text{mm}$
and rotation rates of
 ${\it\omega}=0.75~\text{rad}~\text{s}^{-1}$
and
 ${\it\omega}=0.25~\text{rad}~\text{s}^{-1}$
in figure 5. For these two flow conditions, the diffusion coefficient is calculated directly from the DEM simulation using the method described in Fan et al. (Reference Fan, Schlick, Umbanhowar, Ottino and Lueptow2014a
), and
 $S$
is determined from the particle sizes (3.3). For both flow conditions, the steady-state theoretical predictions qualitatively match the steady-state concentrations from simulations, as shown in the first two rows of figure 5. Furthermore, the model predictions quantitatively match the DEM simulations reasonably well, as shown in the last row of figure 5, which depicts the small-particle concentration along a radial slice through the domain at
 $x=0$
.
Steady-state small-particle concentrations in the particle-filled portion of the tumbler for (a) theory and (b) DEM simulation. (c) Small-particle concentration along a radial slice through the domain at
 $x=0$
for theory (smooth black line, blue online) and simulation (wavy dark grey line, red online). The vertical dashed line represents flowing layer boundary at
 $z/R_{0}=-{\it\epsilon}$
. First column:
 $d_{s}=1~\text{mm}$
,
 $d_{l}=3~\text{mm}$
,
 ${\it\omega}=0.75~\text{rad}~\text{s}^{-1}$
,
 $R_{0}=75~\text{mm}$
,
 $S=0.29~\text{mm}$
,
 ${\it\delta}_{0}=14.78~\text{mm}$
,
 $D=16.1~\text{mm}^{2}~\text{s}^{-1}$
;
 ${\it\epsilon}=0.197$
,
 ${\it\Lambda}=0.49$
,
 $\mathit{Pe}=10.17$
. Second column:
 $d_{s}=1~\text{mm}$
,
 $d_{l}=1.5~\text{mm}$
,
 ${\it\omega}=0.25~\text{rad}~\text{s}^{-1}$
,
 $R_{0}=75~\text{mm}$
,
 $S=0.11~\text{mm}$
,
 ${\it\delta}_{0}=7.17~\text{mm}$
,
 $D=5.27~\text{mm}^{2}~\text{s}^{-1}$
;
 ${\it\epsilon}=0.096$
,
 ${\it\Lambda}=1.64$
,
 $\mathit{Pe}=2.46$
.

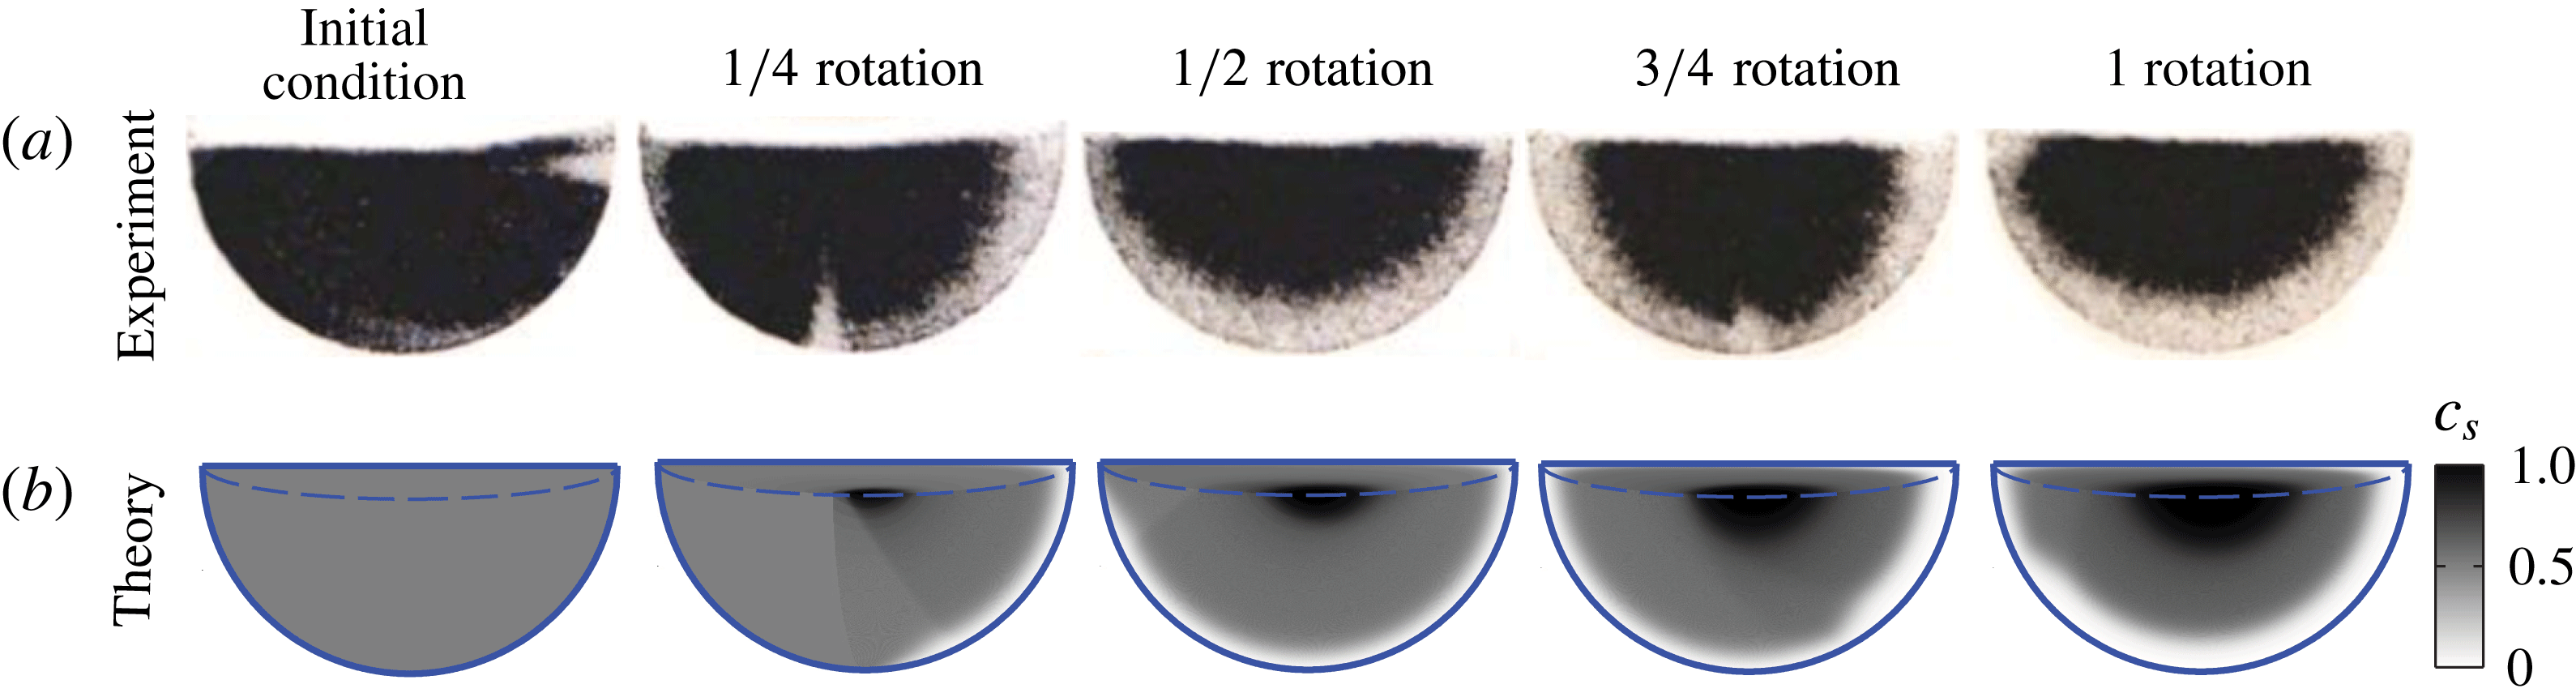
Segregation patterns in the particle-filled portion of the tumbler for (a) experiment and (b) theory:
 $d_{s}=1~\text{mm}$
(black particles),
 $d_{l}=3~\text{mm}$
(clear particles),
 ${\it\omega}=0.4~\text{rad}~\text{s}^{-1}$
,
 $R_{0}=140~\text{mm}$
,
 $S=0.29~\text{mm}$
,
 ${\it\delta}_{0}=21.98~\text{mm}$
,
 $D=2.56~\text{mm}^{2}~\text{s}^{-1}$
;
 ${\it\epsilon}=0.157$
,
 ${\it\Lambda}=0.52$
,
 $\mathit{Pe}=75.49$
. Values of
 ${\it\delta}_{0}$
and
 $D$
are estimated from Pignatel et al. (Reference Pignatel, Asselin, Krieger, Christov, Ottino and Lueptow2012) and Fan et al. (Reference Fan, Umbanhowar, Ottino and Lueptow2015), respectively. The ‘initial condition’ in the experiment is actually obtained in a very short amount of time after the tumbler has begun to rotate, so the concentration discontinuity has already formed. Experimental images courtesy of Steve Meier.

To compare results from the segregation model to experiments without using data from DEM simulations, it is necessary to know the flowing layer depth
 ${\it\delta}_{0}$
, the diffusion coefficient
 $D$
and the percolation length scale
 $S$
. The flowing layer depth
 ${\it\delta}_{0}$
was extracted from videos of the experiment itself and confirmed by a previous empirical relation (Pignatel et al.
Reference Pignatel, Asselin, Krieger, Christov, Ottino and Lueptow2012); the diffusion coefficient
 $D$
was based on the dependence of
 $D$
on the shear rate in bounded heap flow (Fan et al.
Reference Fan, Schlick, Umbanhowar, Ottino and Lueptow2014a
) using the average shear rate according to the velocity field (2.1a
) occurring in the tumbler; and the segregation length scale
 $S$
was based on the relation for steady segregation in bounded heap flow, given in (3.3) (Schlick et al.
Reference Schlick, Fan, Isner, Umbanhowar, Ottino and Lueptow2015). Thus,
 ${\it\Lambda}$
,
 $\mathit{Pe}$
and
 ${\it\epsilon}$
are determined in terms of
 $d_{s}$
,
 $d_{l}$
,
 $R_{0}$
and
 ${\it\omega}$
, and the concentration evolution can be estimated based on the control parameters only. Figure 6 compares theory to experiment for 3 mm clear and 1 mm black spherical glass beads rotated in a tumbler of radius
 $R_{0}=140~\text{mm}$
at
 ${\it\omega}=0.4~\text{rad}~\text{s}^{-1}$
. Note that the experiments were performed with black and clear particles in a tumbler with finite thickness. Because of the clear particles, what appears as black in the experiment is actually a mixture of clear and black particles. Thus, it is difficult to visually differentiate black and clear particles for the clear particle concentration,
 $c_{clear}$
, near 0.5, as is evident in the experimental initial condition, which is nearly all black for
 $c_{clear}=0.5$
throughout the tumbler. Nevertheless, there is qualitative agreement between theory and experiment, as a similar radial segregation pattern is observed in both. In addition, a discontinuity in the small-particle concentration is observed in both experiment and theory for
 $1/4$
and
 $3/4$
rotation, representing the location of the initial segregation of particles when the tumbler begins to rotate. Note that there are no arbitrarily adjustable fitting parameters in the model. In fact, the velocity field,
 $S$
,
 $D$
and
 ${\it\delta}_{0}$
come directly from well-established relations or previous results (for an entirely different flow field in the case of
 $S$
and
 $D$
). The similarity between the experiments and theory demonstrates the power of this segregation modelling approach.
5. A parametric study of
 ${\it\epsilon}$
,
${\it\Lambda}$
and
$\mathit{Pe}$


Since (3.5) predicts segregation patterns in tumbler flow consistent with DEM simulations and experiments, it is now possible to parametrically study the effects of
 ${\it\epsilon}$
,
 ${\it\Lambda}$
and
 $\mathit{Pe}$
. Section 5.1 explores the effect of
 ${\it\epsilon}$
, and § 5.2 explores the effect of
 ${\it\Lambda}$
and
 $\mathit{Pe}$
.
5.1. Effect of
${\it\epsilon}$
on segregation

The effect of the flowing layer thickness,
 ${\it\epsilon}={\it\delta}_{0}/R_{0}$
, on the system is shown in figure 7. For the same values of
 ${\it\Lambda}$
and
 $\mathit{Pe}$
, but different
 ${\it\epsilon}$
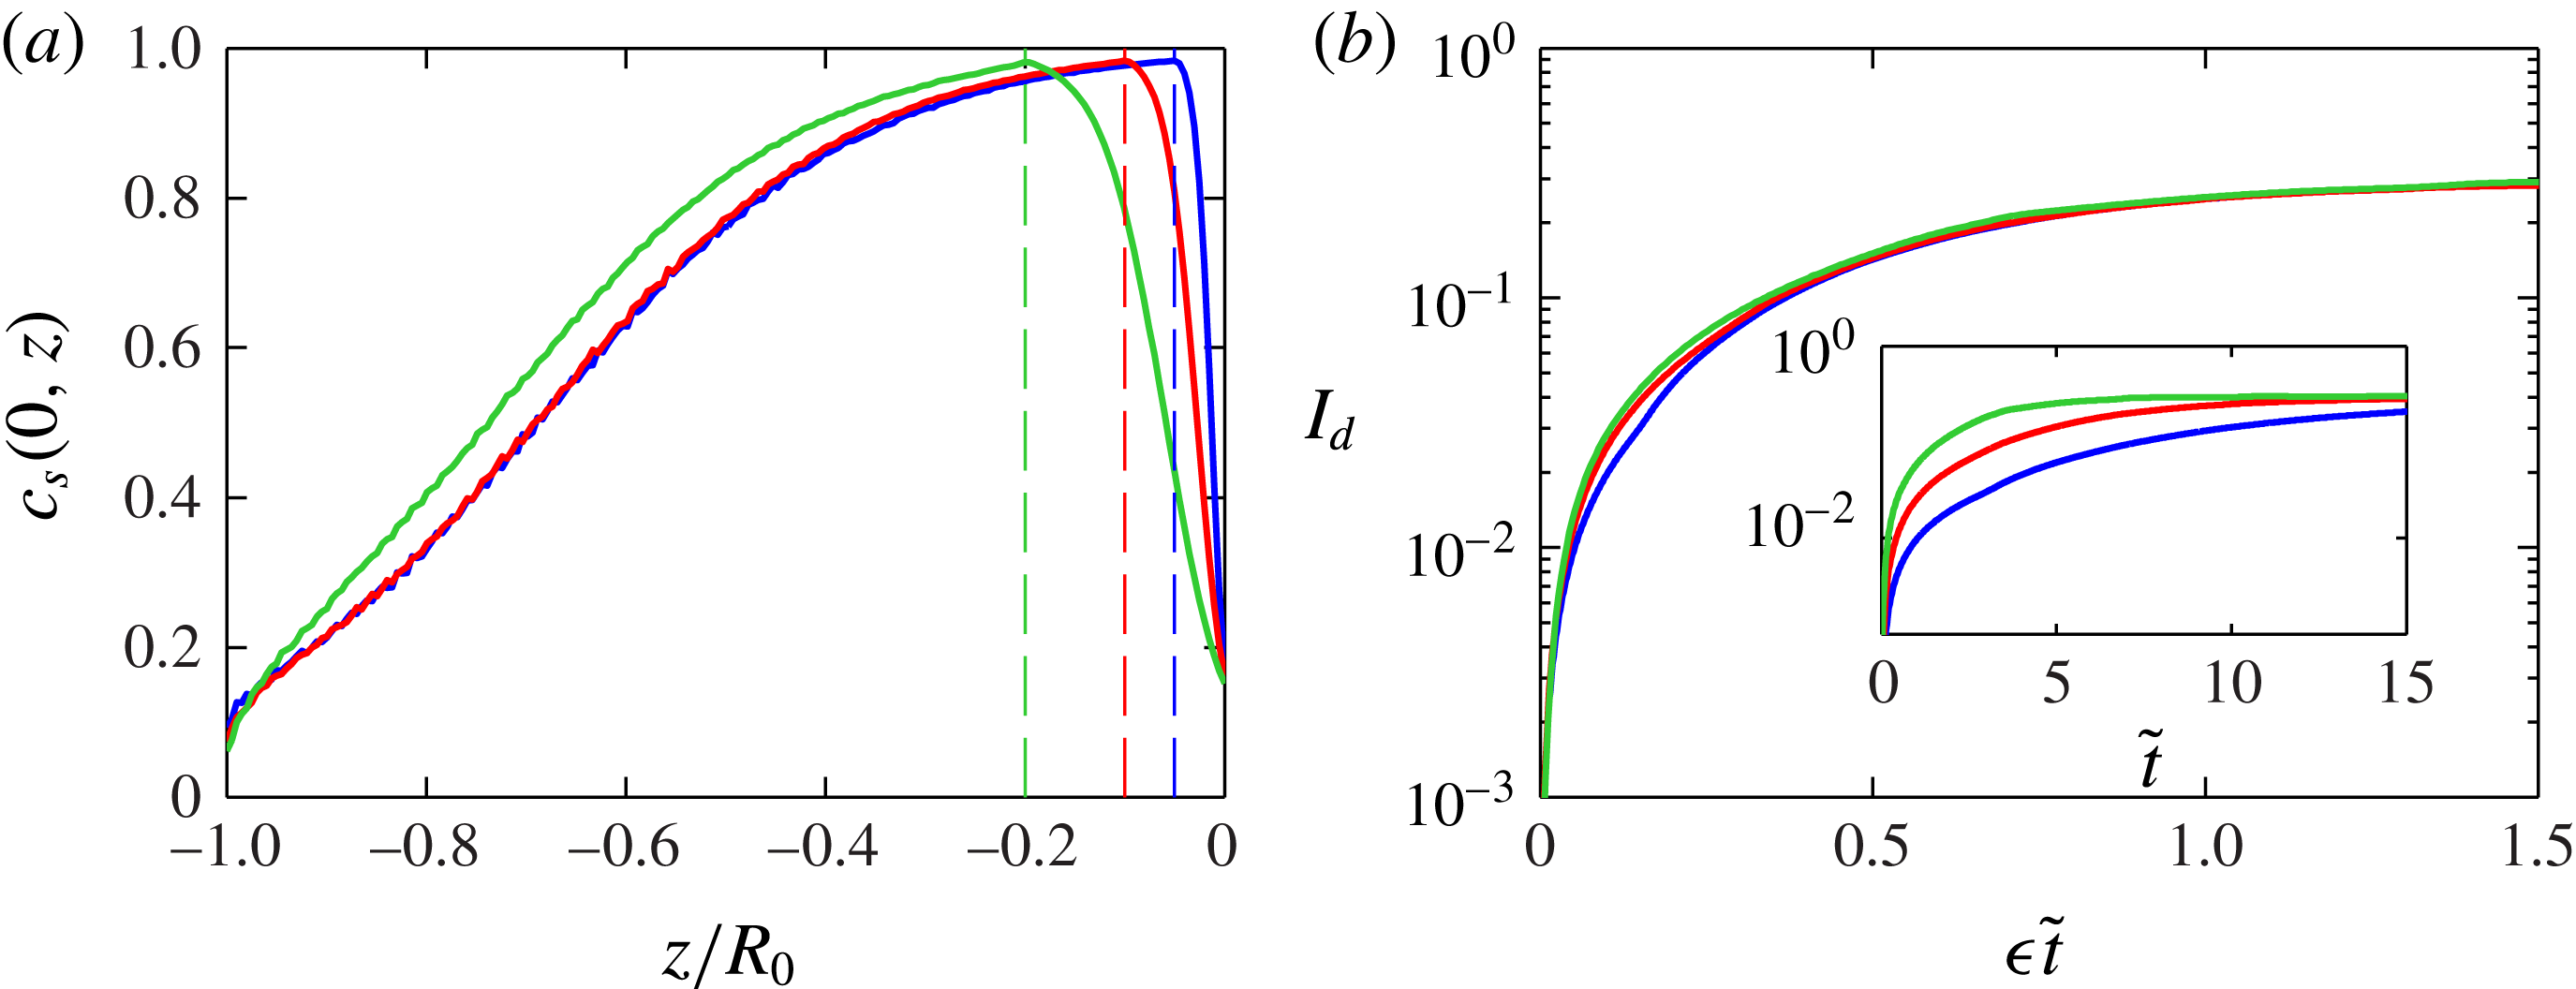
, the steady-state segregation patterns are qualitatively similar, as predicted in § 3, since the ratio between the segregation time scale and the diffusion time scale remains constant. The quantitative difference is shown in figure 8(a), which plots the small-particle concentration at
 $x=0$
for the three cases shown in figure 7. The three curves match reasonably well in the fixed bed,
 $z/R_{0}<-{\it\epsilon}$
. The major difference in the concentration occurs for values of
 $z/R_{0}$
near zero, owing to the difference in flowing layer thickness.
Steady-state small-particle concentration in the particle-filled portion of the tumbler for three different values of
 ${\it\epsilon}$
, for
 ${\it\Lambda}=1$
and
 $\mathit{Pe}=5$
. Dashed curves represent the bottom of the flowing layer.

(a) Steady-state small-particle concentration along a radial slice at
 $x=0$
. Dashed lines represent the bottom of the flowing layer at
 $z/R_{0}=-{\it\epsilon}$
for each case. (b) Plot of
 $I_{d}$
as a function of
 ${\it\epsilon}t$
. Inset shows
 $I_{d}$
as a function of
 $\tilde{t}$
. In each panel,
 ${\it\Lambda}=1$
and
 $\mathit{Pe}=5$
, and
 ${\it\epsilon}=0.05$
(black, blue online),
 ${\it\epsilon}=0.1$
(dark grey, red online) and
 ${\it\epsilon}=0.2$
(light grey, green online).

To further assess the mixing and segregation in tumbler flow, we use the intensity of segregation (Danckwerts Reference Danckwerts1952)
 $$\begin{eqnarray}I_{d}(c)=\frac{1}{\bar{c}(1-\bar{c})}\,\frac{\displaystyle \int _{{\it\Omega}}(c-\bar{c})^{2}\text{d}{\it\Omega}}{\displaystyle \int _{{\it\Omega}}\text{d}{\it\Omega}},\end{eqnarray}$$
where
 ${\it\Omega}$
is the domain (particle-filled portion of the tumbler) and
 $\bar{c}=0.5$
is the average concentration. For a completely mixed state,
 $c=\bar{c}$
everywhere, and
 $I_{d}=0$
; for a completely segregated state,
 $c=0$
or
 $c=1$
everywhere, and
 $I_{d}=1$
. Since
 $c$
is a function of time,
 $I_{d}$
is a function of time as well.
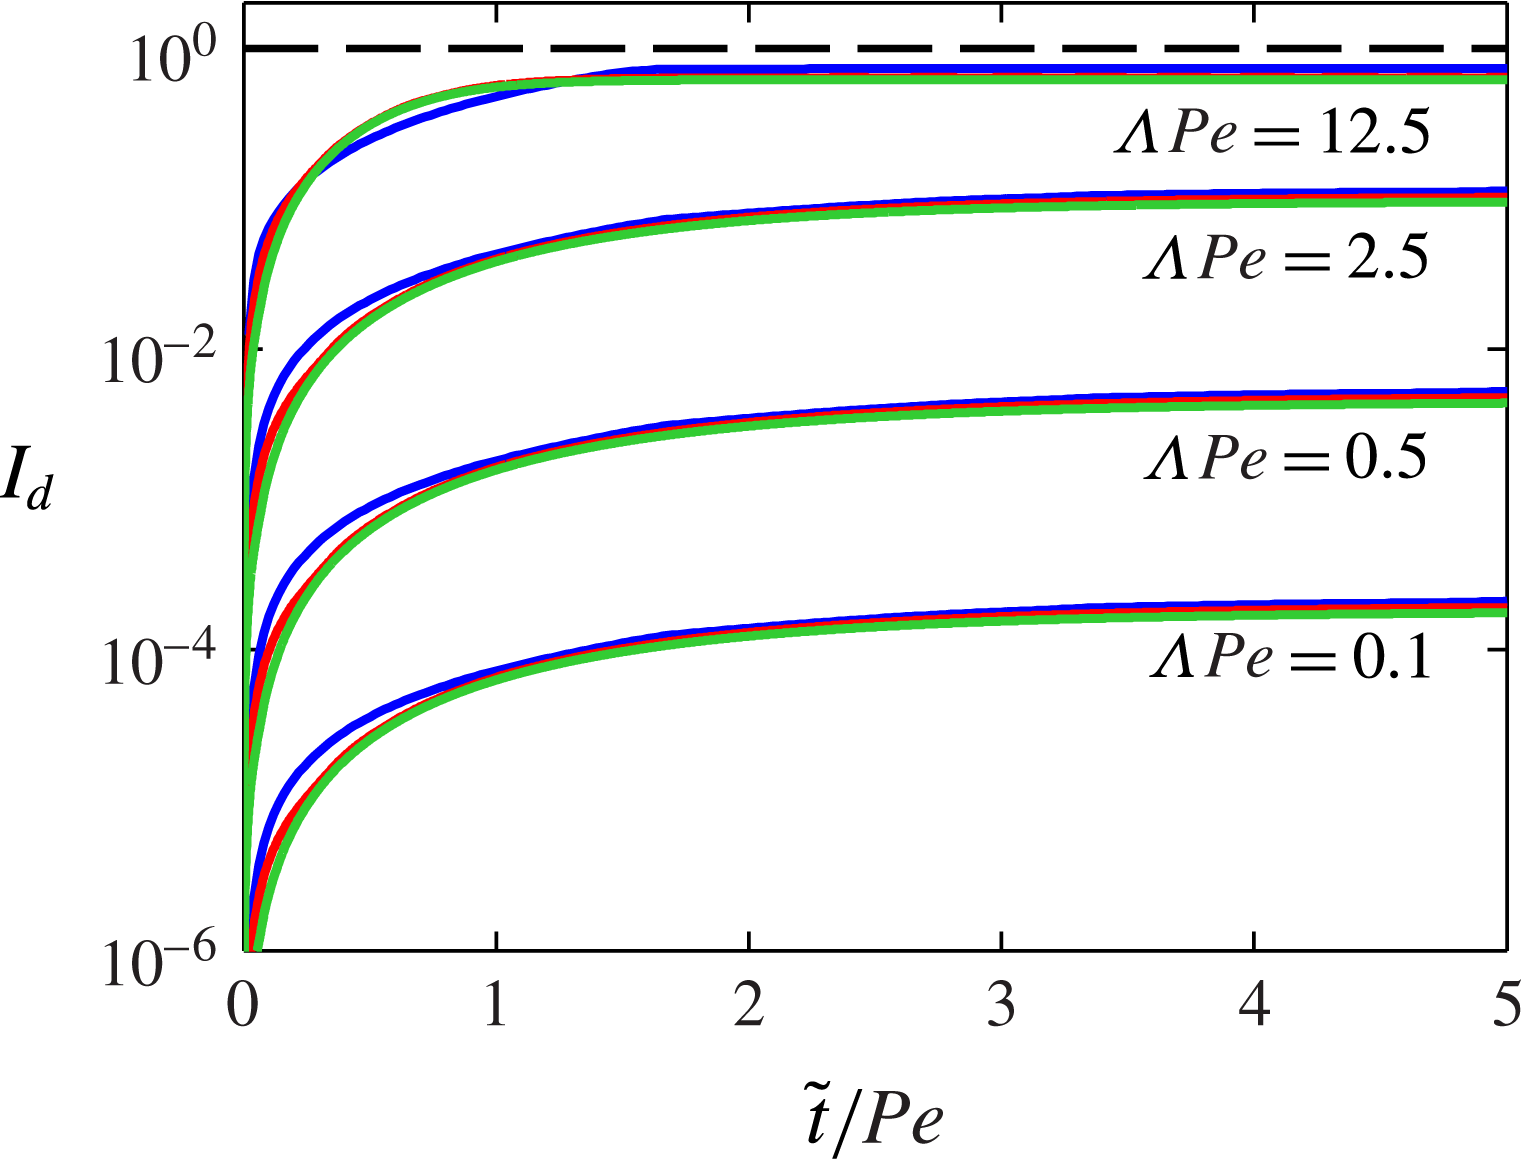
In figure 8(b),
 $I_{d}(t)$
is plotted for the three cases shown in figure 7. Initially,
 $I_{d}=0$
, and
 $I_{d}$
increases as
 $t$
increases and particles segregate more. As
 $t\rightarrow \infty$
,
 $I_{d}$
approaches approximately the same value (
 ${\approx}0.3$
) for all three cases. When time is scaled by
 $1/{\it\epsilon}$
, all three curves collapse well. To understand this scaling, consider the surface velocity,
 $\tilde{u} (x,0)\approx (1/{\it\epsilon})\sqrt{1-\tilde{x}^{2}}$
. As
 ${\it\epsilon}$
decreases, the surface velocity increases, meaning that each particle spends less time in the flowing layer, and thus has less time to diffuse and segregate. In order to reach steady state, the particles must make more passes through the flowing layer. Therefore, since the surface velocity is inversely related to
 ${\it\epsilon}$
, scaling time by
 $1/{\it\epsilon}$
effectively keeps the time each particle spends in the flowing layer the same across different values of
 ${\it\epsilon}$
.
5.2. Effect of
${\it\Lambda}$
and
$\mathit{Pe}$
on segregation


The effect of
 ${\it\Lambda}$
and
 $\mathit{Pe}$
on segregation is revealed by multiplying each term in (3.5) by
 $\mathit{Pe}$
:
 $$\begin{eqnarray}\frac{\partial c_{i}}{\partial (\tilde{t}/\mathit{Pe})}+\mathit{Pe}\,\tilde{\boldsymbol{u}}\boldsymbol{\cdot }\boldsymbol{{\rm\nabla}}c_{i}\pm {\it\Lambda}\,\mathit{Pe}\,{\it\epsilon}\frac{\partial }{\partial \tilde{z}}[c_{i}(1-c_{i})]={\it\epsilon}^{2}\frac{\partial ^{2}c_{i}}{\partial \tilde{z}^{2}}.\end{eqnarray}$$
In this equation, time is rescaled by
 $\mathit{Pe}$
(
 $\tilde{t}\rightarrow \tilde{t}/\mathit{Pe}$
and
 $\tilde{\boldsymbol{u}}\rightarrow \mathit{Pe}\,\tilde{\boldsymbol{u}}$
). When
 ${\it\epsilon}\ll 1$
, the velocity field in the flowing layer is
 $\tilde{\boldsymbol{u}}\approx (1/{\it\epsilon}^{2})(\tilde{z}+{\it\epsilon}\sqrt{1-\tilde{x}^{2}})\hat{\boldsymbol{x}}$
. At steady state, the concentration is primarily a function of
 $z$
in the flowing layer, and only weakly depends on
 $x$
. Therefore, since
 $\partial c/\partial x\approx 0$
and
 $w\approx 0$
,
 $\boldsymbol{u}\boldsymbol{\cdot }\boldsymbol{{\rm\nabla}}c\approx 0$
. Thus, in steady state,
 $$\begin{eqnarray}\pm {\it\Lambda}\,\mathit{Pe}\,\frac{\partial }{\partial \tilde{z}}[c_{i}(1-c_{i})]\approx {\it\epsilon}\frac{\partial ^{2}c_{i}}{\partial \tilde{z}^{2}}\end{eqnarray}$$
in the entire flowing layer, and the product
 ${\it\Lambda}\mathit{Pe}=S{\it\omega}R_{0}(1-{\it\epsilon}^{2})/{\it\epsilon}D$
determines the steady-state concentrations for
 ${\it\epsilon}\ll 1$
. Physically,
 ${\it\Lambda}\mathit{Pe}$
represents the ratio of the diffusion time scale to the segregation time scale. If
 ${\it\Lambda}\mathit{Pe}$
is small, the granular mixture in the tumbler is well mixed in steady state because diffusion dominates in the flowing layer; if
 ${\it\Lambda}\mathit{Pe}$
is large, segregation dominates in the flowing layer, and the granular mixture in the tumbler is segregated in steady state.
As shown in § 5.1, the steady-state concentration depends weakly on
 ${\it\epsilon}$
provided
 ${\it\Lambda}$
and
 $\mathit{Pe}$
remain constant. Thus, for any
 ${\it\epsilon}$
,
 ${\it\Lambda}\mathit{Pe}$
determines the steady-state concentration. Therefore, we set
 ${\it\epsilon}=0.1$
and examine only the effects of varying
 ${\it\Lambda}$
and
 $\mathit{Pe}$
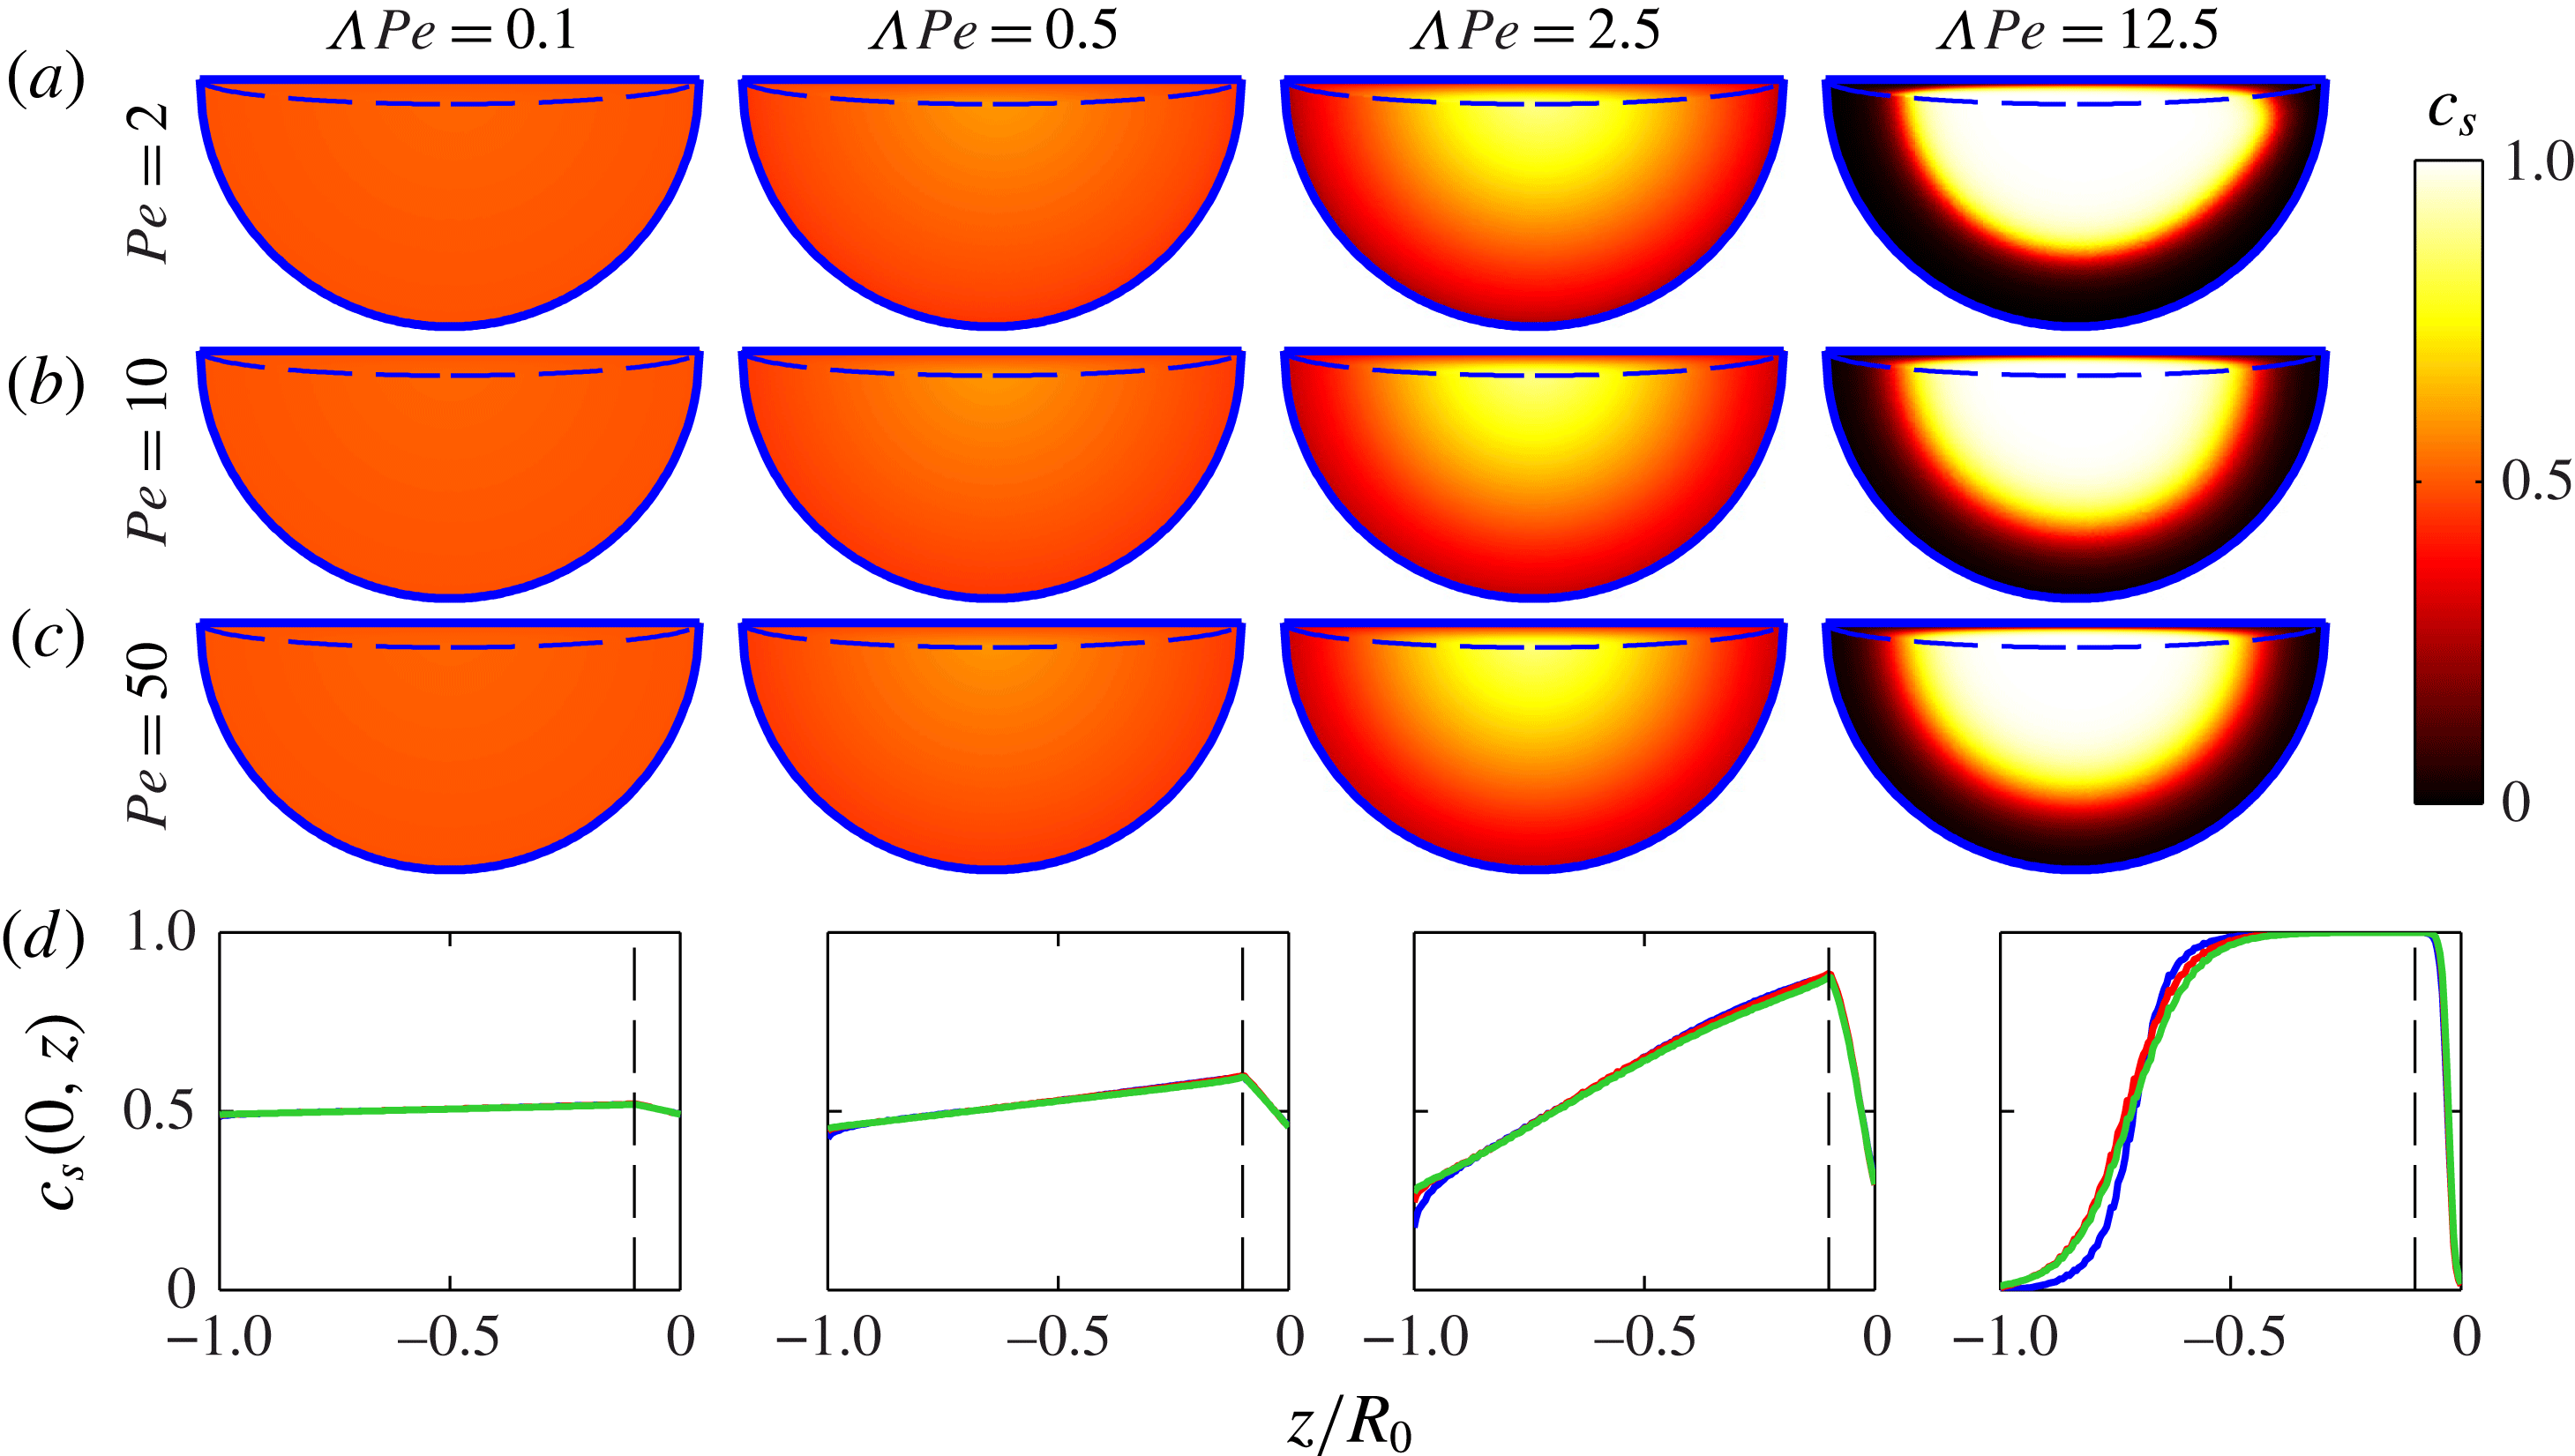
in the rest of this section. Figure 9 shows steady-state concentration for different values of
 ${\it\Lambda}$
and
 $\mathit{Pe}$
. For
 ${\it\Lambda}\mathit{Pe}$
constant (columns), the steady-state concentrations are nearly identical for different values of
 $\mathit{Pe}$
, as expected from (5.3). Furthermore, the concentrations of small particles through a radial slice (at
 $x=0$
) in the domain are shown in the bottom row of figure 9. For
 ${\it\Lambda}\mathit{Pe}$
constant, particle concentrations in steady state are quantitatively similar.
(a–c) Steady-state small-particle concentration in the particle-filled portion of the tumbler for different
 ${\it\Lambda}$
and
 $\mathit{Pe}$
. (d) Steady-state small-particle concentration along the radial slice
 $x=0$
for
 ${\it\epsilon}=0.1$
and for constant
 ${\it\Lambda}\mathit{Pe}$
with
 $\mathit{Pe}=2$
(black, blue online),
 $\mathit{Pe}=10$
(dark grey, red online) and
 $\mathit{Pe}=50$
(light grey, green online). Dashed lines indicate the flowing layer boundary (
 $z/R_{0}=-{\it\epsilon}$
).

To emphasize the equivalence of segregation with equal
 ${\it\Lambda}\mathit{Pe}$
, figure 10 shows
 $I_{d}$
as a function of time for different values of
 ${\it\Lambda}$
and
 $\mathit{Pe}$
. Motivated by (5.2), time is rescaled by
 $\mathit{Pe}$
, similar to figure 8(b), where time is rescaled by
 $1/{\it\epsilon}$
. At steady state, the largest
 ${\it\Lambda}\mathit{Pe}$
gives the strongest segregation, and
 $I_{d}$
is the largest in this case. In figure 10, this rescaling causes data with constant
 ${\it\Lambda}\mathit{Pe}$
to collapse. Thus, the value of
 ${\it\Lambda}\mathit{Pe}$
determines the steady-state concentration configuration (and the ultimate value for
 $I_{d}$
), and
 $\mathit{Pe}$
(or, alternatively,
 ${\it\Lambda}$
) determines the time to achieve steady state when
 ${\it\Lambda}\mathit{Pe}$
is constant.
Mixing (as measured by
 $I_{d}$
) versus time (rescaled by
 $\mathit{Pe}$
) for the cases in figure 9 with
 ${\it\epsilon}=0.1$
.
 $\mathit{Pe}=2$
(black, blue online),
 $\mathit{Pe}=10$
(dark grey, red online) and
 $\mathit{Pe}=50$
(light grey, green online).

To examine the effect of
 ${\it\Lambda}\mathit{Pe}$
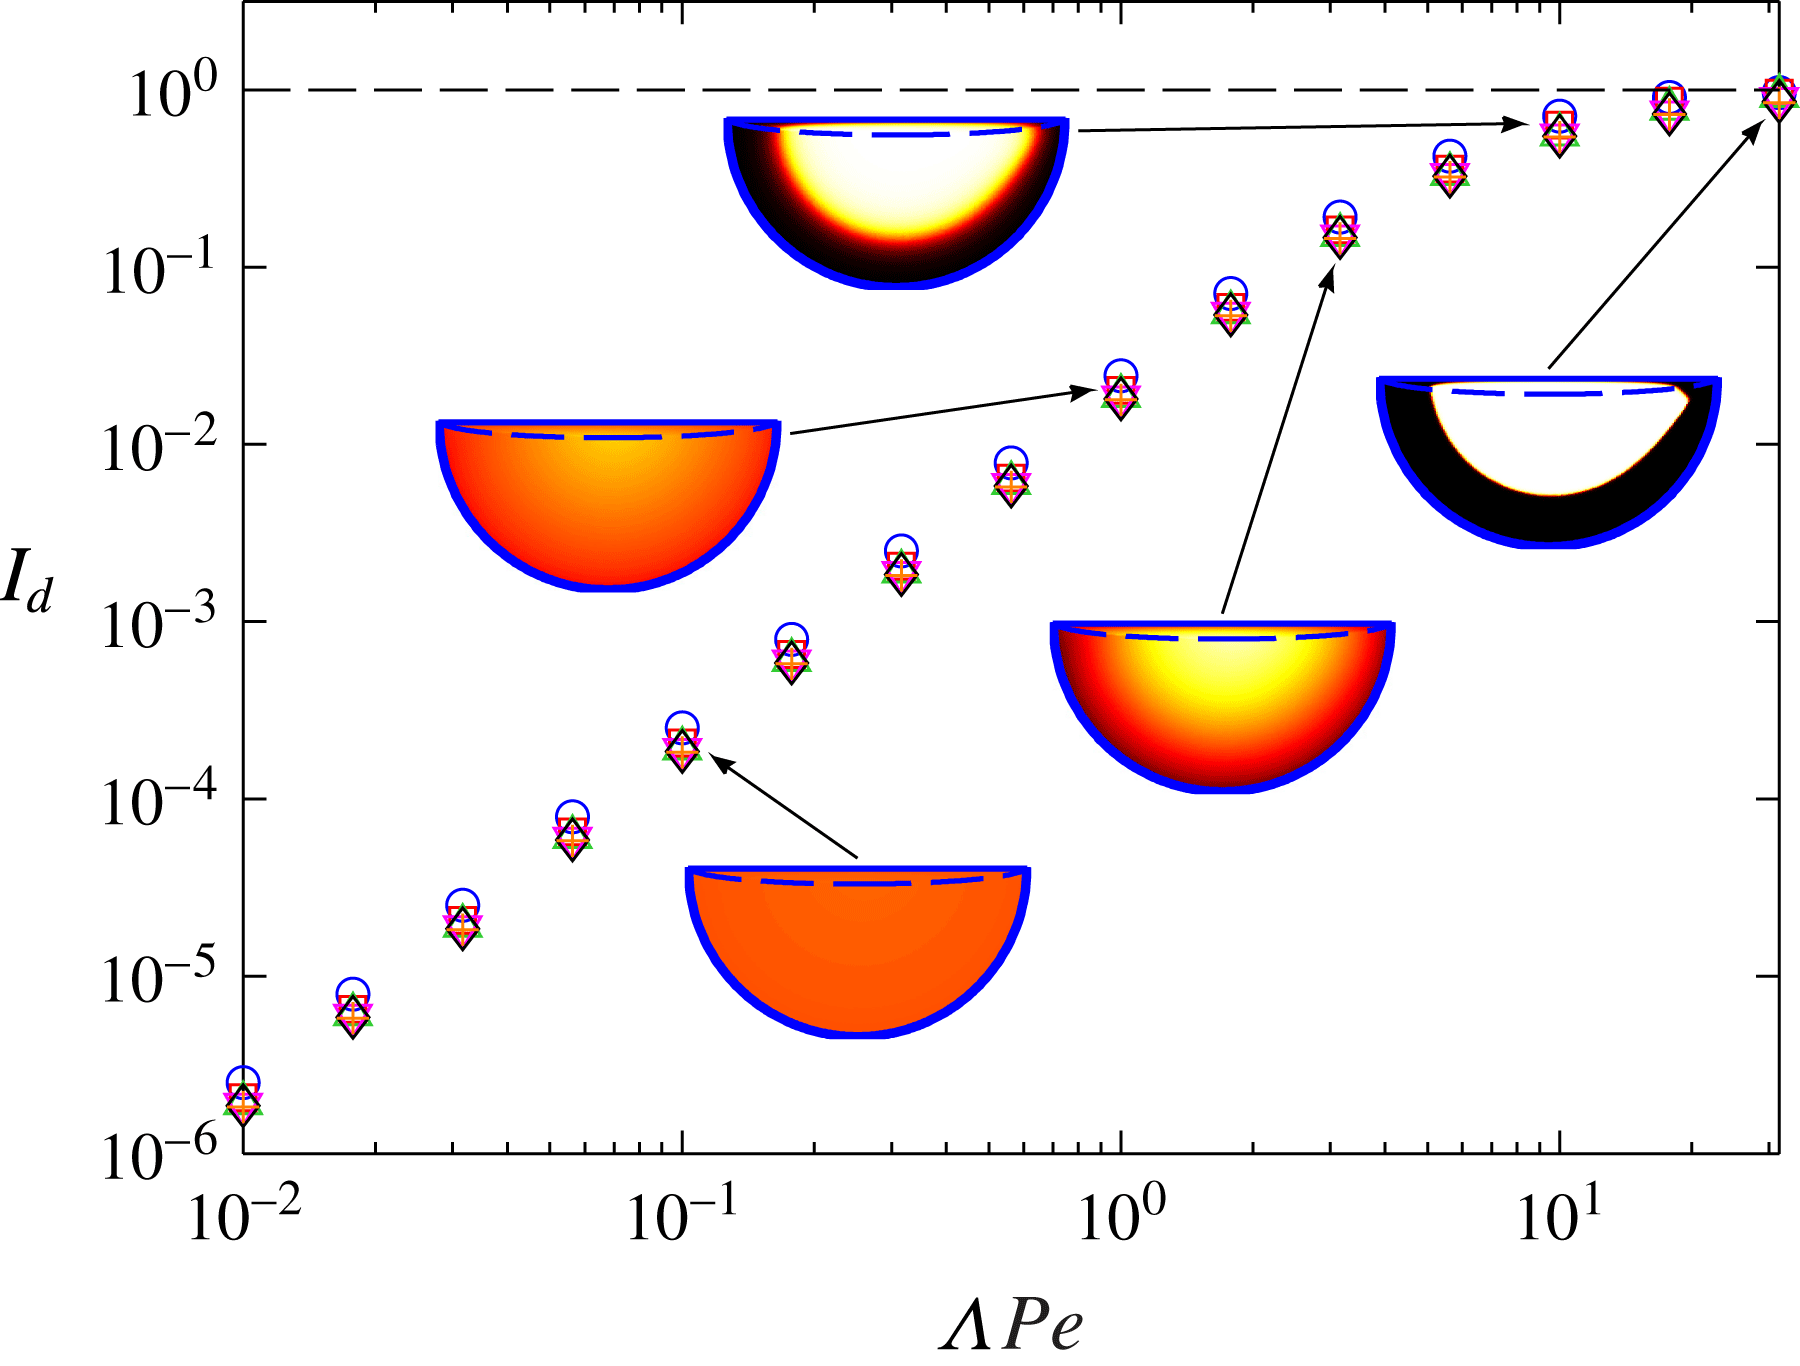
on the segregation in tumbler flow further, figure 11 plots the steady-state value of
 $I_{d}$
as a function of
 ${\it\Lambda}\mathit{Pe}$
. For each value of
 ${\it\Lambda}\mathit{Pe}$
, six different
 ${\it\Lambda}$
and
 $\mathit{Pe}$
combinations are considered. For
 ${\it\Lambda}\mathit{Pe}$
constant, all of the different combinations of
 ${\it\Lambda}$
and
 $\mathit{Pe}$
give approximately the same value for
 $I_{d}$
, as expected from figures 9 and 10. As
 ${\it\Lambda}\mathit{Pe}$
increases,
 $I_{d}$
increases as a power law for
 ${\it\Lambda}\mathit{Pe}<O(1)$
:
 $I_{d}\sim ({\it\Lambda}\,\mathit{Pe})^{2}$
. This scaling of
 $I_{d}$
for small values of
 ${\it\Lambda}\mathit{Pe}$
is investigated through an asymptotic analysis in appendix A. As
 ${\it\Lambda}\mathit{Pe}$
continues to increase,
 $I_{d}$
asymptotically approaches
 $I_{d}=1$
, which represents perfect segregation (
 $c_{s}=0$
or
 $c_{s}=1$
everywhere).
Steady-state value of
 $I_{d}$
versus
 ${\it\Lambda}\mathit{Pe}$
for
 ${\it\epsilon}=0.1$
and various combinations of
 ${\it\Lambda}$
and
 $\mathit{Pe}$
. Representative steady-state small-particle concentration contours are shown for five values of
 ${\it\Lambda}\mathit{Pe}$
.
 $\mathit{Pe}=1$
(○),
 $\mathit{Pe}=2$
(▫),
 $\mathit{Pe}=5$
(▵),
 $\mathit{Pe}=10$
(▿),
 $\mathit{Pe}=20$
(♢),
 $\mathit{Pe}=50$
(
 $+$
).

The steady-state concentration in tumbler flow depends only on the relative strength of segregation and diffusion, determined by the parameter
 ${\it\Lambda}\mathit{Pe}$
, which represents the ratio of the diffusion time scale to the segregation time scale. For comparison, the steady-state concentration for bounded heap flow depends on the effects of advection, as well as diffusion and segregation, as shown in Fan et al. (Reference Fan, Schlick, Umbanhowar, Ottino and Lueptow2014a
). If advection effects are strong in bounded heaps, the inlet condition is preserved, as particles traverse the entire length of the flowing layer quickly with little time to diffuse or segregate. In the tumbler, if advection is strong, particles do not have time to segregate or diffuse much during any single pass through the flowing layer. However, as particles pass through the flowing layer many times, steady state is ultimately reached as a result of an equilibrium between the effects of segregation and diffusion alone. Therefore, the steady-state segregation pattern depends on only the product
 ${\it\Lambda}\mathit{Pe}$
, in contrast to bounded heaps, where it depends on both
 ${\it\Lambda}$
and
 $\mathit{Pe}$
. While
 ${\it\Lambda}\mathit{Pe}$
controls the steady-state concentration, the time to steady state depends on
 ${\it\epsilon}$
and
 $\mathit{Pe}$
, as shown in figures 8(b) and 10.
6. Modulated flow
Fiedor & Ottino (Reference Fiedor and Ottino2005) experimentally studied segregation patterns for modulated flow in a tumbler by varying
 ${\it\omega}$
sinusoidally with time. In their study, both lobe segregation patterns and radial segregation patterns were obtained, depending on the period of the modulation of
 ${\it\omega}$
. If the period of the tumbler rotation (i.e. time to complete one rotation) divided by the period of the modulation is even, then lobe segregation patterns occur, and if the period of the tumbler divided by the period of the modulation is odd, then radial segregation patterns occur. To further demonstrate the capability of our approach to unsteady flow and to better understand the underlying mechanisms, we apply our model to modulated tumbler flow.
Implementing modulated flow by varying the rotation speed directly in the theory is quite difficult, because the dimensionless parameters
 ${\it\Lambda}$
,
 $\mathit{Pe}$
and
 ${\it\epsilon}$
, and thus the velocity field
 $\tilde{\boldsymbol{u}}$
, all vary continuously with time. However, Fiedor & Ottino (Reference Fiedor and Ottino2005) postulated that lobe patterns occur due to the changing flowing layer depth. To test this hypothesis, we consider a step function for varying
 ${\it\epsilon}$
, while leaving
 ${\it\Lambda}$
and
 $\mathit{Pe}$
constant:
 $$\begin{eqnarray}{\it\epsilon}(t)=\left\{\begin{array}{@{}ll@{}}0.1\quad & \text{if }\text{mod}\,(t,T_{{\it\omega}})<T_{{\it\omega}}/2,\\ 0.05\quad & \text{if }\text{mod}\,(t,T_{{\it\omega}})\geqslant T_{{\it\omega}}/2.\end{array}\right.\end{eqnarray}$$
Here
 $T_{{\it\omega}}=2{\rm\pi}/f_{E}$
is an integer multiple of the tumbler rotation period, and
 $f_{E}$
is the forcing frequency of the modulation. In an experiment or DEM simulation, it would be quite difficult to vary
 ${\it\epsilon}$
while
 ${\it\Lambda}$
and
 $\mathit{Pe}$
remain constant, as all are functions of the rotation speed, the tumbler radius and the particle diameters in non-trivial ways. However, in this section, we only seek to test the hypothesis that lobe patterns in a flow with modulated rotation speed occur due to the varying flowing layer depth, and that the other factors that come about in modulated flow (such as varying of
 ${\it\Lambda}$
and
 $\mathit{Pe}$
or the acceleration of particles in the flowing layer due to the change in rotation speed) play a minimal role in the final segregation pattern. Moreover, applying the segregation model to modulated flow further demonstrates the power that this approach has for unsteady flows.
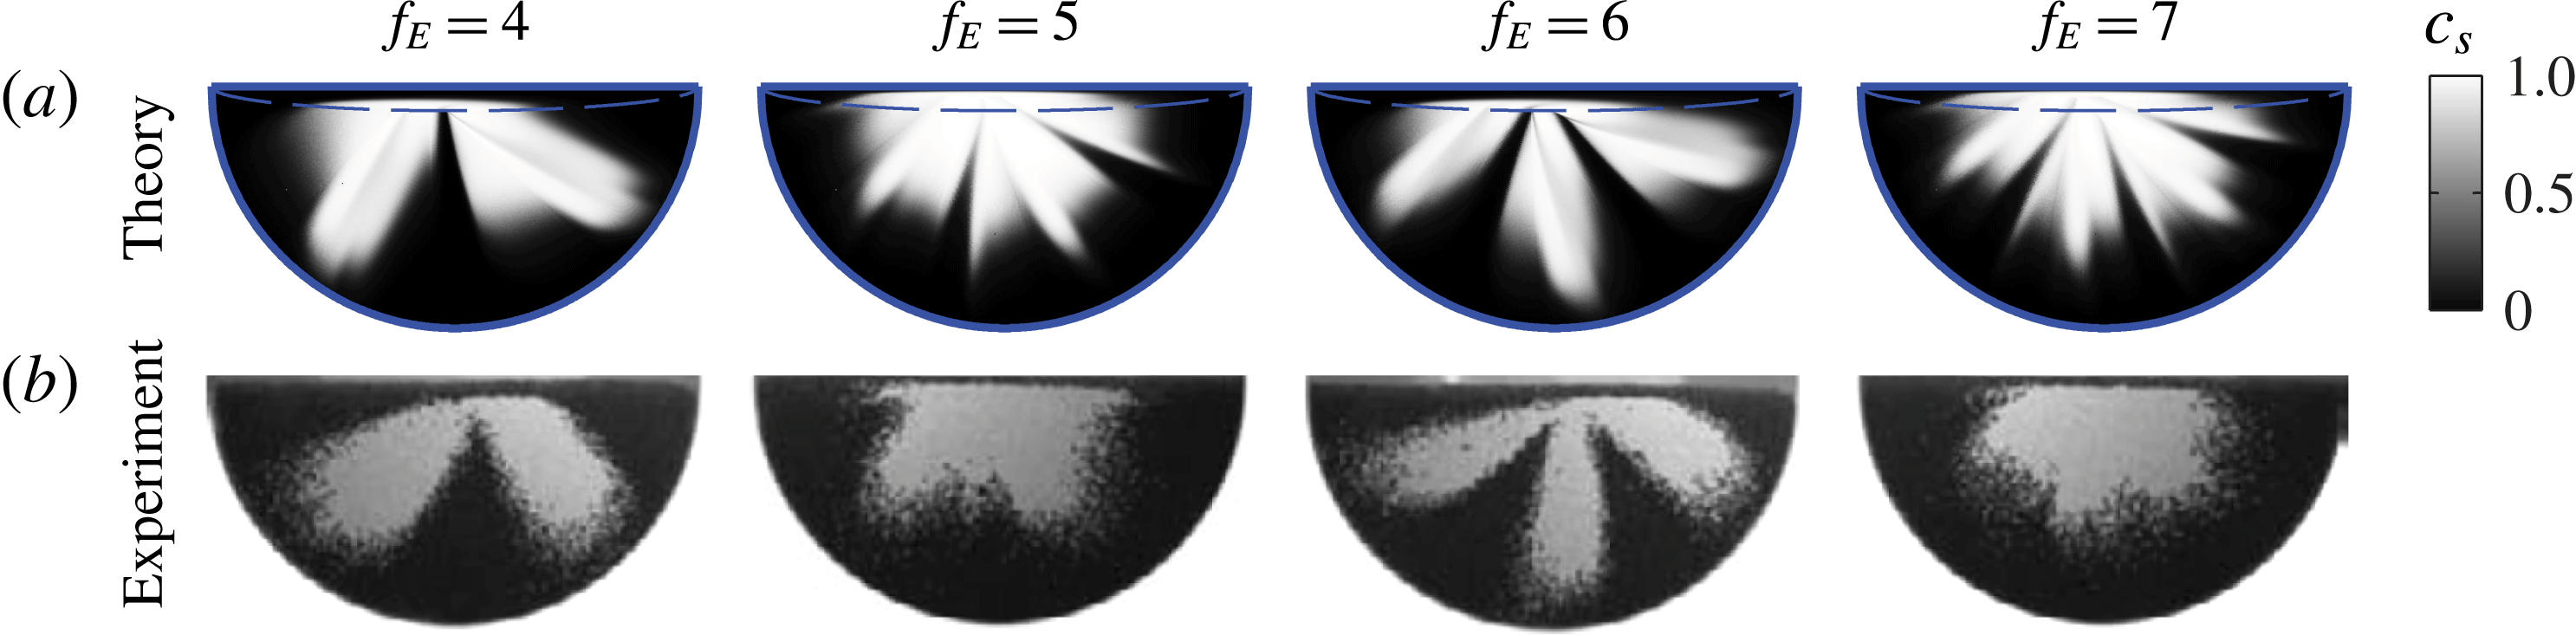
Figure 12 shows small-particle concentration for different values of
 $f_{E}$
for (a) theory and (b) experiment (Fiedor & Ottino Reference Fiedor and Ottino2005). For both experiment and theory, the images are obtained after a few rotations, and these patterns do not change substantially as the tumbler continues to rotate. Values of
 ${\it\Lambda}$
and
 $\mathit{Pe}$
were chosen such that segregation is strong, and are not meant to exactly match the experimental conditions. The segregation patterns observed in both the theory and experiment are qualitatively similar, with lobe patterns occurring for
 $f_{E}$
even and radial patterns occurring for
 $f_{E}$
odd. While there is more complex structure associated with the theory compared to the experiment (probably due to the step change in
 ${\it\epsilon}$
rather than the smoothly varying
 ${\it\epsilon}$
in the experiments), the qualitative agreement between the two is remarkable given the simplicity of the underlying assumptions. Thus, this confirms the hypothesis of Fiedor & Ottino (Reference Fiedor and Ottino2005) that the lobe patterns are caused by variation in the flowing layer depth.
Small particle concentration in the particle-filled portion of the tumbler for modulated flow for theory (a) and experiment (Fiedor & Ottino Reference Fiedor and Ottino2005) (b). Modulated flow is realized by varying
 ${\it\epsilon}$
according to (6.1) for various
 $f_{E}$
. In both theory and experiment, the volume ratio of large particles to small particles is 2:1 (in contrast to 1:1 in the rest of the paper).
 ${\it\Lambda}=2$
,
 $\mathit{Pe}=10$
. Experimental images are from Fiedor & Ottino (Reference Fiedor and Ottino2005), © 2005 Cambridge University Press, reprinted with permission.

For
 $f_{E}$
even in figure 12, the lobe segregation patterns that occur have
 $f_{E}/2$
lobes; for
 $f_{E}$
odd, radial segregation patterns without distinct lobes occur. For any
 $f_{E}$
, when there is an abrupt switch from
 ${\it\epsilon}=0.1$
to
 ${\it\epsilon}=0.05$
, the small particles at the bottom of the flowing layer when
 ${\it\epsilon}=0.1$
are immediately switched to solid-body rotation, creating a region in the solid body of mostly small particles. The flowing layer, at this point, is mostly large particles, and thus a region of large particles immediately follows the small particles in solid-body rotation. When
 $f_{E}$
is even, particles enter the flowing layer at approximately the same time in each cycle, and this effect is reinforced. Thus, the lobe pattern is stabilized. For
 $f_{E}$
odd, particles enter the flowing layer half a period removed from the previous cycle, and the effect is diminished. Consequently, only radial segregation patterns occur, though there are still slight incursions of large particles into the small-particle regions, consistent with the experiments.
7. Conclusion
Using the continuum transport equation model of Fan et al. (Reference Fan, Schlick, Umbanhowar, Ottino and Lueptow2014a
), we have developed a theoretical approach for predicting granular segregation patterns in bidisperse tumbler flow. In contrast to bounded heap flow, the system studied by Fan et al. (Reference Fan, Schlick, Umbanhowar, Ottino and Lueptow2014a
), tumbler flow offers new challenges, such as a varying flowing layer depth and transient segregation. Theoretical predictions are consistent with results from experiments and DEM simulations. The model utilizes three dimensionless parameters: a parameter related to the segregation,
 ${\it\Lambda}$
; a Péclet number,
 $\mathit{Pe}$
, related to collisional diffusion; and the dimensionless flowing layer depth,
 ${\it\epsilon}$
. Steady-state particle concentrations are determined primarily by the product
 ${\it\Lambda}\mathit{Pe}$
and are insensitive to
 ${\it\epsilon}$
. However, for
 ${\it\Lambda}\mathit{Pe}$
constant, the time to steady state depends on
 ${\it\epsilon}$
and
 $\mathit{Pe}$
. Using this model, modulation of the rotational speed of the tumbler can be simulated by varying the parameter
 ${\it\epsilon}$
. Both lobe and radial segregation patterns are obtained depending on the frequency of the modulation, similar to experiments (Fiedor & Ottino Reference Fiedor and Ottino2005).
Much work remains for modelling tumbler flows. First, it would be useful in many industrial applications to relate segregation patterns to the control parameters of the system (such as the rotation speed, the tumbler radius and the particle sizes) instead of the dimensionless parameters (
 ${\it\Lambda}$
,
 $\mathit{Pe}$
and
 ${\it\epsilon}$
). Additionally, while only 50 % full circular tumblers were considered here, this approach can be generalized to non-half-full circular tumblers, as well as tumblers with non-circular cross-sections.
Acknowledgements
This research was funded by NSF Grant CMMI-1000469 and The Dow Chemical Company. We thank K. Jacob for a careful reading of and helpful comments on the manuscript.
Appendix A. Asymptotic analysis of
$I_{d}$
in tumbler flow for
${\it\Lambda}\mathit{Pe}$
small


In figure 11, it was shown that
 $I_{d}\sim ({\it\Lambda}\mathit{Pe})^{2}$
for
 ${\it\Lambda}\mathit{Pe}<O(1)$
. Here, this relationship is verified using an asymptotic analysis.
It was shown that, in the flowing layer for
 ${\it\epsilon}\ll 1$
,
 $$\begin{eqnarray}\pm {\it\Lambda}\mathit{Pe}\,\frac{\partial }{\partial \tilde{z}}[c_{i}(1-c_{i})]\approx {\it\epsilon}\frac{\partial ^{2}c_{i}}{\partial \tilde{z}^{2}},\end{eqnarray}$$
where the ‘
 $+$
’ sign is used for large particles and the ‘
 $-$
’ sign is used for small particles. In order to simplify the complex dynamics of tumbler flow, consider this simple one-dimensional problem at
 $\tilde{x}=0$
and
 $-{\it\epsilon}<\tilde{z}<0$
. Defining
 $\tilde{z}^{\prime }=\tilde{z}/{\it\epsilon}$
(so
 $-1<\tilde{z}^{\prime }<0$
) and applying no-flux boundary conditions at
 $\tilde{z}^{\prime }=-1$
and
 $\tilde{z}^{\prime }=0$
, (A 1) becomes
 $$\begin{eqnarray}\pm {\it\Lambda}\mathit{Pe}\,c_{i}(1-c_{i})=\frac{\partial c_{i}}{\partial \tilde{z}^{\prime }}.\end{eqnarray}$$
Also, let
 $$\begin{eqnarray}\int _{-1}^{0}c_{i}(\tilde{z}^{\prime })\,\text{d}\tilde{z}^{\prime }=\frac{1}{2},\end{eqnarray}$$
so that the average small- and large-particle concentrations are equal in the domain.
For
 ${\it\Lambda}\mathit{Pe}=0$
,
 $c_{s}=c_{l}=0.5$
for
 $-1\leqslant \tilde{z}^{\prime }\leqslant 0$
. For
 ${\it\Lambda}\mathit{Pe}\ll 1$
, expand
 $c_{i}$
about 0.5:
 $$\begin{eqnarray}c_{i}(\tilde{z}^{\prime })\sim 0.5+({\it\Lambda}\mathit{Pe}){\it\xi}_{i}(\tilde{z}^{\prime })+\cdots \,.\end{eqnarray}$$
Substituting this expression into (A 2) yields
 $$\begin{eqnarray}\pm {\it\Lambda}\mathit{Pe}[0.25-({\it\Lambda}\mathit{Pe})^{2}{\it\xi}_{i}^{2}]+\cdots =({\it\Lambda}\mathit{Pe})\frac{\partial {\it\xi}_{i}}{\partial \tilde{z}^{\prime }}+\cdots \,.\end{eqnarray}$$
The
 $O({\it\Lambda}\mathit{Pe})$
equation is
 $$\begin{eqnarray}\pm 0.25=\frac{\partial {\it\xi}_{i}}{\partial \tilde{z}^{\prime }}.\end{eqnarray}$$
Solving this gives
 ${\it\xi}_{i}=\pm 0.25\tilde{z}^{\prime }+A_{i}$
, where
 $A_{i}$
is a constant. From (A 3),
 $A_{i}=\pm 1/8$
, giving
 $$\begin{eqnarray}\left.\begin{array}{@{}l@{}}c_{l}(\tilde{z}^{\prime })=0.5+({\it\Lambda}\mathit{Pe})({\textstyle \frac{1}{8}}+{\textstyle \frac{1}{4}}\tilde{z}^{\prime })+O(({\it\Lambda}\mathit{Pe})^{2}),\\ c_{s}(\tilde{z}^{\prime })=0.5-({\it\Lambda}\mathit{Pe})({\textstyle \frac{1}{8}}+{\textstyle \frac{1}{4}}\tilde{z}^{\prime })+O(({\it\Lambda}\mathit{Pe})^{2}).\end{array}\right\}\end{eqnarray}$$
In this simplified problem,
 $I_{d}$
can be defined as
 $$\begin{eqnarray}I_{d}(c)=\frac{1}{\bar{c}(1-\bar{c})}\int _{-1}^{0}(c-\bar{c})^{2}\text{d}\tilde{z}^{\prime },\end{eqnarray}$$
where
 $\bar{c}=0.5$
. Substituting (A 7) into this expression yields
 $$\begin{eqnarray}I_{d}(c_{i})\sim ({\it\Lambda}\mathit{Pe})^{2},\end{eqnarray}$$
which is the same scaling that was found in figure 11.