Introduction
Over the past 30 years of research shows that the nanocrystalline (NC) materials usually have high strength and hardness. Without changing the material chemical composition, the strength and hardness of NC materials can be several times or even dozens of times as that to the same component of coarse grain (CG) materials [Reference Lu1, Reference Fang, Li, Tao and Lu2, Reference Wu, Jiang, Chen, Yuan and Zhu3, Reference Wu, Jiang, Chen, Zhang, Yuan and Zhu4, Reference Chen, Liu, Wang, Lu and Wang5, Reference Wei, Li, Zhu, Liu, Lei, Wang, Wu, Mi, Liu, Wang and Gao6]. However, with the significant increment of strength and hardness, the plasticity and toughness of NC materials drop substantially, and work hardening ability disappears. The structural instability and the performance deterioration restrict the performance and applications of NC materials.
With the process of new nanotechnologies, building nanostructures into architecture can effectively overcome the drawback of NC materials at the same time giving full play to the advantages of their performance. There are several examples for the architectured NC materials, such as the gradient nanograined structure [Reference Lu1, Reference Fang, Li, Tao and Lu2, Reference Wu, Jiang, Chen, Yuan and Zhu3, Reference Wu, Jiang, Chen, Zhang, Yuan and Zhu4, Reference Chen, Liu, Wang, Lu and Wang5, Reference Wei, Li, Zhu, Liu, Lei, Wang, Wu, Mi, Liu, Wang and Gao6], heterogenous lamella structure [Reference Wu, Yang, Yuan, Wu, Wei, Huang and Zhu7, Reference Han, Lee, Witkin, Nutt and Lavernia8, Reference Sawangrat, Kato, Orlov and Ameyama9, Reference Ma, Huang, Moering, Ruppert, Höppel, Göken, Narayan and Zhu10], bimodal structure [Reference Han, Lee, Witkin, Nutt and Lavernia8, Reference Zhao, Topping, Bingert, Thornton, Dangelewicz, Li, Liu, Zhu, Zhou and Lavernia11, Reference Wang, Chen, Zhou and Ma12, Reference Han, Huang, Zhu and Lavernia13], and nanodomained structure [Reference Wu, Yuan, Yang, Jiang, Zhang, Chen, Wei and Ma14]. These materials have a common feature that a remarkable difference in the strength between different domains, while the sizes and shape of the domains may vary significantly. The gradient nanostructure refers to the structure of the unit size, such as grain size or the layer thickness on the space gradient change from the nanoscale continuously increase to macroscale. The essence of gradient nanostructure is that the density of grain boundary (or other interfaces) changes by gradient in space, so it corresponds to the gradient change of many physical or chemical properties in space. Lu et al. claimed that in gradient nanocrystals, the plastic deformation takes place in a chain-like manner, i.e., the core of the CG first plastically deforms, and then the plastic deformation gradually passes from the CG region to the surface NC region. In that way, the strain hardening of the core and the stress-induced growth of the surface nanocrystals can be obtained, so the chain-plastic deformation can effectively inhibit premature necking [Reference Fang, Li, Tao and Lu2]. Different from the gradient structures, the heterogenous lamella structure is characterized with alternating lamellae of soft micro/macrograins and hard nano/ultrafine grains, and can be fabricated by accumulative roll bonding process and subsequent annealing [Reference Ma, Huang, Moering, Ruppert, Höppel, Göken, Narayan and Zhu10]. The heterogeneities of grain size, hardness, and texture across the interfaces can simultaneously improve the strength and ductility of the whole structures. The bimodal structure can be obtained by a combination of cryogenic rolling and a subsequent recrystallization process, and contains a bimodal distribution of grain size with micrograins randomly embedded into nano/ultrafine grains. The bimodal structured materials possess a high strain hardening rate, like the CG materials. The additional work hardening ability of heterogenous lamella structure and bimodal structure results from the accumulation of dislocations due to the large number of geometrically necessary dislocation (GND) formed across the boundary between micrograins and nano/ultrafine grains [Reference Wu, Yang, Yuan, Wu, Wei, Huang and Zhu7].
Motivated by the bimodal structures, Wu et al. [Reference Wu, Yuan, Yang, Jiang, Zhang, Chen, Wei and Ma14] processed a new class of nanostructured materials, nanodomained materials, via a pulsed electroplating protocol. These nanodomained materials are characterized by randomly dispersed nanograins (NGs) embedded in the CGs. Even with 2.5% embedded NGs, the yield strength of the nanodomained materials is comparable to the pure NC materials, while the high strain hardening rate and good ductility are realized simultaneously. During the deformation of nanodomained materials, the NGs act like precipitates, which can block the dislocation motion; in the meanwhile, boundaries around the NGs can absorb and emit dislocations. That can balance the dislocation storage and multiplication rates and result in the exceptional strain hardening capacity to maintain the large uniform deformation. However, several critical questions are still unanswered for the development of ductile high strength nanodomained materials: (i) how do the volume fraction and grain sizes of NGs control the strain hardening behavior of the whole structure, (ii) how do the orientations of the CGs affect the dislocation accumulation in the nanodomained structure, (iii) What is the mechanism by which nanodomained materials retain their ductility and how can we enhance this effect.
Through the development of computer resources, various modeling tools are available for exploring the mechanical behavior of materials to provide the guideline for materials design. Molecular dynamics simulations are able to reveal single or a few defects activities during deformation but is limited by the time-scale and length-scale [Reference Huang, Wang, Li, Zhang and Zhou15, Reference Huang, Wang and Zhou16]. Classic crystal plasticity finite element (CPFE) modeling can predict the mechanical behavior of microscale materials as the dislocation motion and interactions in phases dominate the deformation processes [Reference Roters, Eisenlohr, Hantcherli, Tjahjanto, Bieler and Raabe17]. However, most CPFE models either use phenomenological constitutive formulations to describe dislocation-induced property evolution, such as strain hardening or treat dislocations in a homogenized and statistical manner. They are in lack of GBs physics, such as dislocation nucleation, motion, and reactions with GBs.
In this study, we combine a novel discrete crystal plasticity finite element (discrete-CPFE) model with dislocation density-based CPFE model to study the effects of grain size, volume fraction of nanogrians on the strength, and deformation in nanodomained materials. We also explore the influence of CG orientations on the dislocation accumulation and strain distribution within the nanodomained structure.
Results and discussion
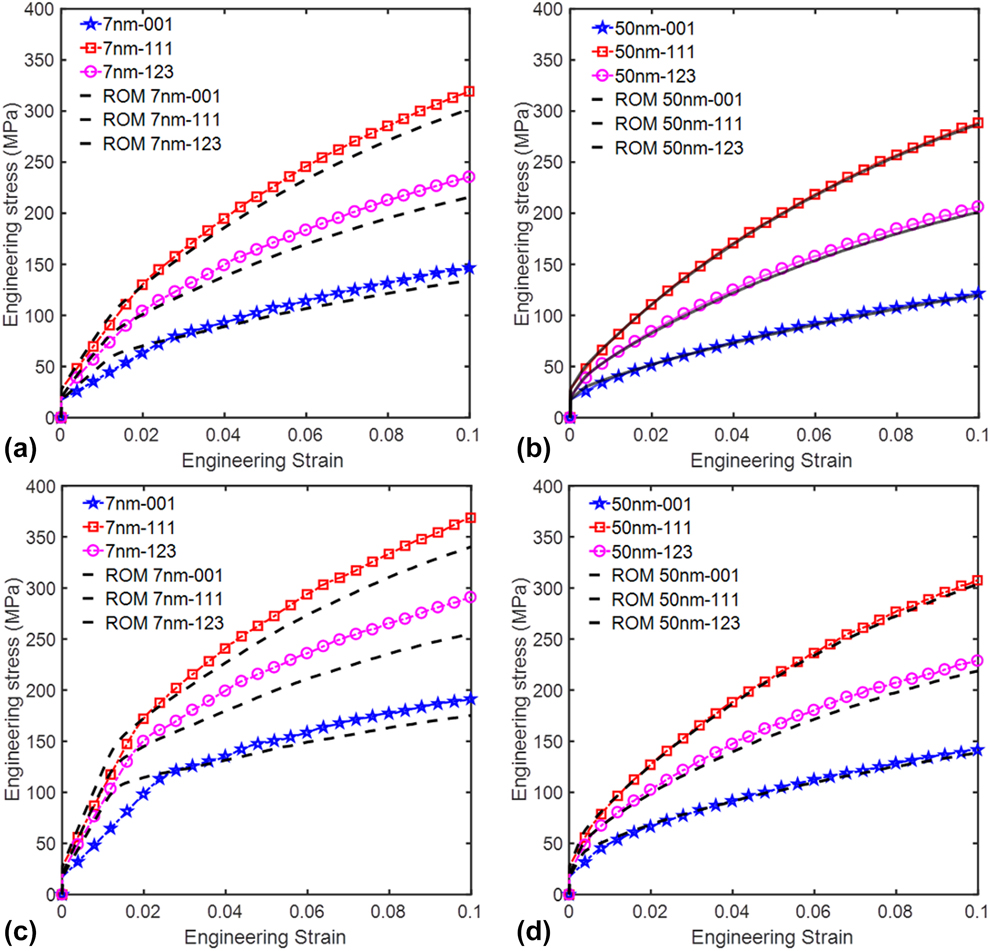
Figure 1 shows the calculated stress–strain curves of the nanodomained samples for different cases. For two different volume fractions (1.0 and 2.5%), the samples with [111] orientated CGs always exhibit the highest strengths, as the average Schmid factor of 12 slip systems in the [111] orientated grains is 0.136 and smaller than 0.272 for the [001] orientated and 0.185 for [123] orientated grains. Normally, lower Schmid factors result in smaller resolved shear stress (RSS) for the corresponding slip systems, which cannot activate the slip events or can only generate low shear strain rates. Thus, higher applied stresses are needed to activate more slip events or bump up the shear strain rates to satisfy the external imposed strain. This is why the samples with [111] and [001] CGs show the highest and lowest strengths, respectively.
Comparison of CPFE calculated stress–strain curves with ROM curves: (a) 1% of 7 nm NGs, (b) 1% of 50 nm NGs, (c) 2.5% of 7 nm NGs, (d) 2.5% of 50 nm NGs.

In addition, it is clear that the smaller size of NGs or larger volume fraction of NGs can make the nanodomained samples stronger, as the sample with 7 nm NGs possesses higher strength than the sample with 50 nm NGs at the same volume fraction, and the samples with 2.5% NGs exhibit enhanced strengths compared to the samples with 1.0% NGs. In order to check whether the strength of the nanodomained samples follows the rule of mixtures (ROM), in Fig. 1, we also compare the CPFE predicted stress–strain curves with the results predicted by ROM, 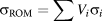 ${\sigma _{{\rm{ROM}}}} = \sum {{V_i}{\sigma _i}}$, where V i is the volume fraction and σi is the strength of each single phase [Reference Meyers and Chawla18]. ROM always predicts the upper limit of the strength of composites, especially for the composites only under elastic deformation, as the ROM was derived based on the isostrain condition that assumes each phase within the composite sustains the same amount of strain. From Fig. 1, we can see that the CPFE predicted stress–strain curves are below the ROM curves at the beginning of the deformation with the total strain smaller than 0.02, although the overall flow stresses of nanodomained samples are equal or higher than the strengths predicted by ROM for different volume fractions and NG sizes. For the small strain region, both the CGs and NGs were under elastic deformation or plastically deformed a small amount. As the NGs in the nanodomained samples were not perfectly aligned with the CG under isostrain condition but randomly distributed within the CG, it is not surprising to see the ROM predicted strengths are higher than the strengths of nanodomained samples. As the difference on the strength between the 50 nm NGs and CGs is smaller than that between 7 nm NGs and CGs, the stress–strain curves for nanodomained Ni with 50 nm NGs are close to the ROM curves at the beginning of the deformation. When the nanodomained samples were deformed to large strains, their strengths have caught up with or surpassed the ROM strengths as shown in Fig. 1.
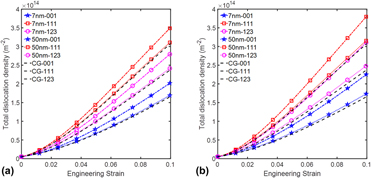
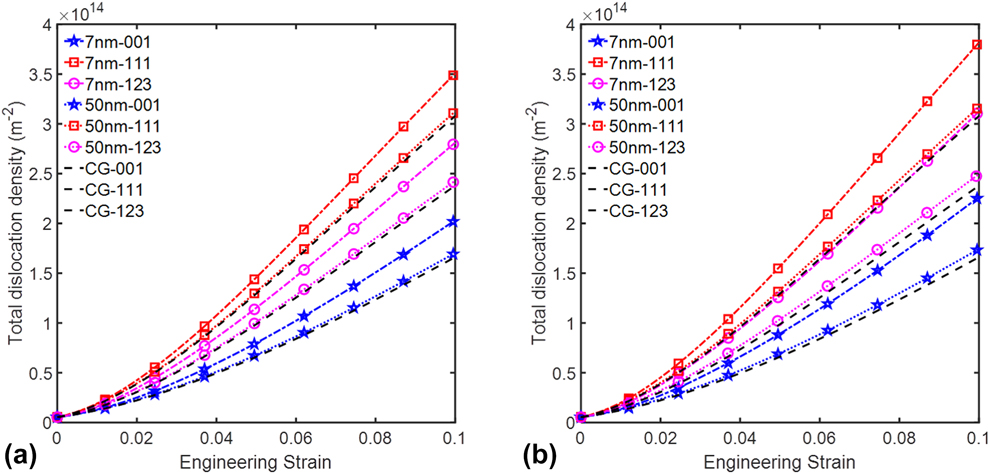
In the CG metals, the strain hardening behavior, i.e., the flow stress increases with the strain during the plastic deformation and is controlled by the dislocation motion, multiplication, and interactions. Higher dislocation density is more effective on restricting the dislocation motion that results in less plastic strain and higher flow stress under the same amount of deformation. Thus, we plot the dislocation density over the strain for different cases in Fig. 2. It is clear that the dislocation densities in all nanodomained samples are much higher than those for the corresponding pure CG samples. Furthermore, the samples with [111] and [001] orientated CGs carry the highest and lowest dislocation densities, while the dislocation densities in samples with [123] CGs are between those two cases. In addition, the dislocation densities in samples with 7 nm NGs are higher than those in the samples with 50 nm NGs. Raising the volume fraction of NGs from 1 to 2.5% induced larger difference on the dislocation density 7 nm sample than that on 50 nm samples.
Evolution of the total dislocation density: (a) 1% NGs, (b) 2.5% NGs.
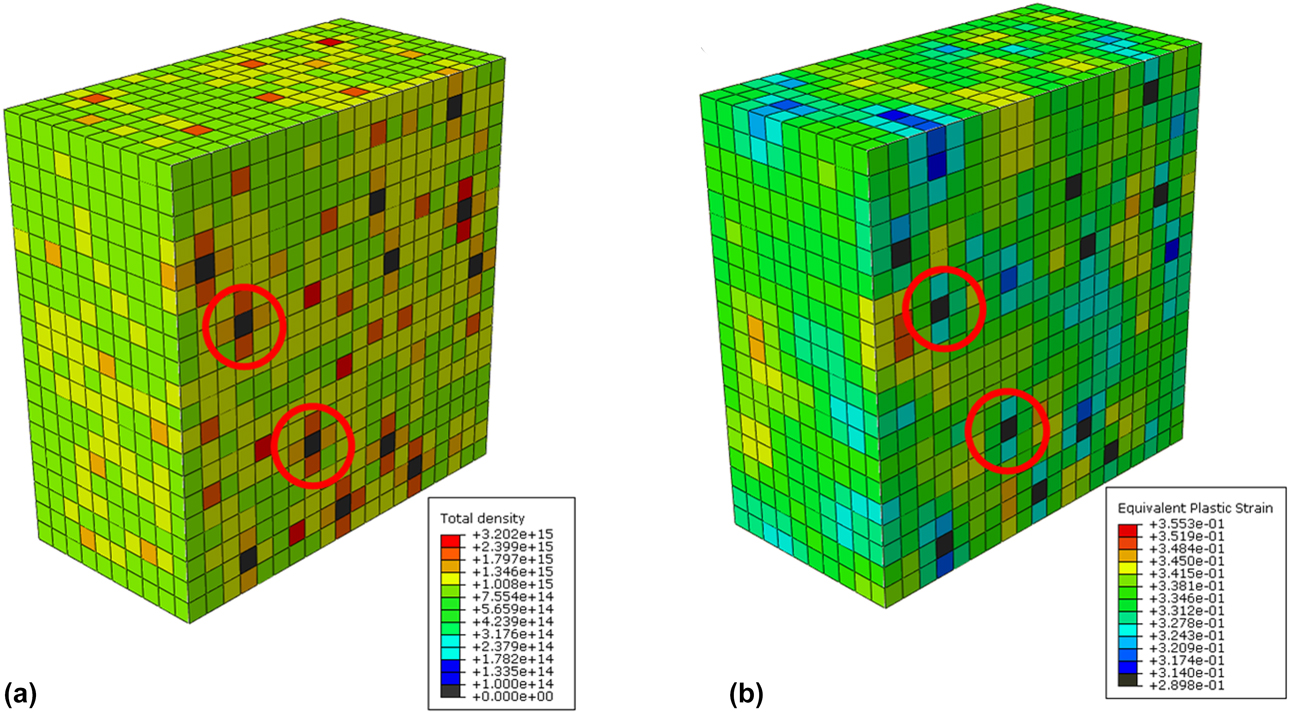
To reveal the role of the dislocation density on the plastic deformation in nanodomained samples, we output the distribution of the dislocation density and equivalent plastic strain distributions in Fig. 3. Based on our model, we assume that there is no dislocation accumulation within the NGs, which is consistent with most experiment results from the heavily deformed NC metals [Reference Rupert, Gianola, Gan and Hemker19] and also supported by atomistic simulation results [Reference Huang, Beyerlein and Zhou20, Reference Brandl, Tiwari, Derlet and Van Swygenhoven21]. In Fig. 3, the CG elements surrounding NGs always possess high dislocation densities. The NGs embedded in the CG serves a dual role during the plastic deformation. As the strength of NGs is very high compared to the corresponding CGs, they can strength the whole nanodomained sample as hard particles. Second, the NGs can effectively block the pathway for dislocation motion that results in high accumulative dislocations inside the CGs. In addition, large mismatch of strengths between the NGs and CGs can also induce high GND density from the plastic strain gradients during the plastic flow. In Fig. 3, we also plot the distribution of the equivalent plastic strain in the nanodomained sample with 2.5% 7 nm NGs. We can see that the distribution of equivalent plastic strain in the nanodomained sample is highly heterogenous. The elements surrounding NGs exhibit less equivalent plastic strain than those far from the NGs, which resulted from the restricted dislocation motion within those elements.
Distribution of (a) the total dislocation density and (b) the equivalent plastic strain within the sample with 2.5% 7 nm NGs at 10% strain. (Black elements represent NGs embedded in the CG.)

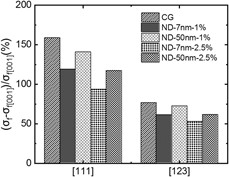
In polycrystalline metals, the anisotropy on some important properties, such as yield strength and ductility, often results from their preferred crystallographic orientation. The anisotropy of strength in single crystalline materials is usually caused by the Schmid factors that are determined by the angles between the loading direction and slip systems. Beside the Schmid factor effect, the dislocation structures and densities can also play an important role on the anisotropy of strength [Reference Huang and Zhou22, Reference Zhou, Beyerlein and LeSar23, Reference Zhou, Biner and LeSar24]. Since NGs bring on the change of total dislocation density in the CGs during plastic deformation, it raises an important question: how does the embedded NGs affect the anisotropy of strength. Thus, we compared the difference on the flow stress at 0.1 strain between the samples with [001] CG and [111], [123] CGs in Fig. 4. We can see that the difference on the flow stress between samples with [111] CG and [001] CG is always larger than the difference between [123] CG and [001] CG, as the average Schmid factors for [111] and [001] CGs are the highest and lowest among those three cases. In addition, our results indicate the embedded NGs can relieve the anisotropy of strength in the nanodomained samples, as the nanodomained samples display smaller differences between different orientations than those in CG samples. Furthermore, smaller NGs and high volume fraction of NGs are more effective on reducing the anisotropy of strength. That is because smaller NGs and high volume fraction of NGs can raise the dislocation density inside the CGs as shown in Fig. 2. That can efficiently stop or slow down the dislocation motion and make the value of critical resolved shear stress (CRSS) for different slip systems close to each other, and consequently alleviate the anisotropy of strength.
Comparison of the anisotropy of the strength at 0.1 strain for different cases.

Conclusions
In this work, we studied the effects of grain size, volume fraction of nanogrians on the strength, and deformation in nanodomained materials by using a combination of discrete-CPFE model and dislocation density-based CPFE model. Our analyses reveal that the overall flow stresses of nanodomained samples are equal or higher than the strengths predicted by ROM. In addition, smaller NGs or higher volume fraction of NGs can make the nanodomained samples stronger, as they can be more effective to promote the dislocation accumulations inside the CGs and eventually raise the CRSS for each slip system during the plastic flow. Areas surrounding NGs possess higher dislocation densities and less plastic strain, as the dislocation motion was restricted. Furthermore, NGs grain embedded in the CGs can reduce the anisotropy of strength of the nanodomained samples. These findings shed light on the role of NGs in the plastic deformation of nanodomained metals and can benefit the design and processing of ultrahigh strength ductile heterogenous nanostructured metals.
Methodology
A rate-dependent elasto-viscoplastic constitutive model accounting for elastic and plastic deformation of crystals and the underlying kinematic relations developed by Marin et al. [Reference Marin and Dawson25] is modified to accommodate the discrete CPFE model used in this work. The Lp is the plastic velocity gradient is calculated by
 $${{\bf{L}}^{\rm{p}}} = \sum\limits_{\alpha = 1}^N {{{\dot{\gamma }}^\alpha }{{\bi{s}}^\alpha } \otimes {{\bi{m}}^\alpha }} \quad ,$$
where N is the total number of slip systems in a single crystal,  ${\dot{\gamma }^\alpha }$ is the shear strain rate of slip system α, sα, and mα are the slip direction and slip plane normal of slip system α, respectively, and sα ⊗ mα defines the Schmid tensor.
The corresponding shear strain rate in slip system α is calculated with a power-law equation
 $${\dot{\gamma }^\alpha } = {\dot{\gamma }_0}{\left[ {{{\left| {{\tau ^\alpha }} \right|} \over {\tau _{{\rm{CRSS}}}^\alpha }}} \right]^{{1 \over m}}}{\rm{sign}}\left( {{\tau ^\alpha }} \right)\quad ,$$
where  ${\dot{\gamma }_0}$ is a reference shear strain rate, τα and
 $\tau _{{\rm{CRSS}}}^\alpha$ are the RSS and CRSS in slip system α, respectively, and m is the strain rate sensitivity exponent.
In this study, we use two different models to evaluate the CRSS in NGs and CGs as their deformation mechanisms are different from each other. In NGs, we adopt a novel grain boundary discrete slip model to calculate the CRSS [Reference Yuan, Beyerlein and Zhou26, Reference Yuan, Beyerlein and Zhou27], since the conventional crystal plasticity model cannot capture the deformation physics in NGs. In the grain boundary discrete slip model, the plastic strain within NGs is assumed to be induced by the slip of dislocations nucleated from the GBs. The CRSS is controlled by the length of GB dislocations and equals to the stress required for activating the GB dislocation and subsequently gliding across the grain. Since the GB structure varies with the GB types and local misorientations, the length of the GB dislocation is not uniform but follows a normal distribution as shown in Fig. 5(a). The upper and lower limits of the length of GB dislocations are the dislocation core size and the grain size, respectively. The dislocation source distribution can be converted into the CRSS distribution via Foreman’s formula [Reference Foreman28],
 $$\tau _{{\rm{CRSS}}}^\alpha = {{\mu b} \over {2\pi L}}\log \left( {{L \over {{r_0}}}} \right)\quad ,$$
where µ is the shear modulus of the metal, b is the magnitude of Burgers vector, L is the dislocation source length, and r 0 is the dislocation core size, which is set as 2b. The CRSS distribution follows the generalized extreme value distribution [Fig. 5(b)] that will be used in our work to calculate the shear strain rate in each slip system.
Probability density distributions of (a) dislocation source lengths and (b) τCRSS for different grain size; (c) predicted stress–strain curves for polycrystalline Ni of grain size 20 nm [Reference Zhu, Zhou, Jiang and Zhang35], 50 nm [Reference Ebrahimi, Bourne, Kelly and Matthews36], 300 nm [Reference Ebrahimi, Bourne, Kelly and Matthews36], and 27 μm [Reference Ma and Zhu37] compared with experimental results.

For the CG part, we employ a dislocation density based model to evaluate the CRSS during the plastic deformation, as the dislocation motion and reactions dominate the plastic deformation in CGs. The CRSS is calculated based on the following formula:
 $$\tau _{{\rm{CRSS}}}^\alpha = \chi Gb\sqrt {\rho _{{\rm{SSD}}}^\alpha + \rho _{{\rm{GND}}}^\alpha } + \tau _{{\rm{sub}}}^\alpha + {\tau _{{\rm{GB}}}}\quad ,$$
where χ is the dislocation interaction factor and  $\rho _{{\rm{SSD}}}^\alpha$ and
 $\rho _{{\rm{GND}}}^\alpha$ are the statistically stored dislocation (SSD) and GND density in slip system α, respectively.
 $\tau _{{\rm{sub}}}^\alpha$ is the resistance for the dislocation motion contributed from dislocation substructures [Reference Madec, Devincre and Kubin29]. τGB is the dislocation motion resistance arising from grain boundaries [Reference Li and Soh30].
The SSD density evolves with strain and varies with dislocation trapping and annihilation rates [Reference Mecking and Kocks31] and is governed by
 $${{\partial \rho _{{\rm{SSD}}}^\alpha } \over {\partial \gamma }} = {{\partial \rho _{{\rm{gen,SSD}}}^\alpha } \over {\partial \gamma }} - {{\partial \rho _{{\rm{rec,SSD}}}^\alpha } \over {\partial \gamma }} = {k_1}\sqrt {\rho _{{\rm{SSD}}}^\alpha } - {k_2}\left( {\dot{\varepsilon },T} \right)\rho _{{\rm{SSD}}}^\alpha \quad ,$$
where  $\rho _{{\rm{gen,SSD}}}^\alpha$ is the trapped SSD density and
 $\rho _{{\rm{rec,SSD}}}^\alpha$ is the recovered part in slip system α, respectively. The parameter k 1 is a coefficient for statistical trapping of mobile dislocations and k 2 is a coefficient for annihilation of trapped dislocations. The latter is a function of temperature and strain rate and related to k 1 via
 $${{{k_2}} \over {{k_1}}} = {{\chi b} \over g}\left( {1 - {{kT} \over {{\tau _{\rm{D}}}{b^3}}}\ln \left( {{{\dot{\varepsilon }} \over {\dot{r}}}} \right)} \right)\quad ,$$
where k is the Boltzmann constant, g is an effective activation enthalpy, T is the temperature, τD is a drag stress,  $\dot{\varepsilon }$ is the applied strain rate, and
 $\dot{r}$ is a characteristic rate that is related to the number of attempts to overcome barriers to slip.
The evolution of the GND density is calculated by the formula derived by Ma et al. [Reference Ma, Roters and Raabe32],
 $$\dot{\rho }_{{\rm{GNDs}}}^\alpha = {1 \over b}\left\| {{\nabla _x} \times \left( {{{\dot{\gamma }}^\alpha }{\bf{F}}_{\rm{P}}^{\rm{T}}{{\bf{n}}^\alpha }} \right)} \right\|\quad ,$$
where the nabla operator ∇x is defined as the derivative with respect to the reference coordinate, and FP is the irreversible plastic strain. During the calculation,  $\dot{\rho }_{{\rm{GND}}}^\alpha$ is decomposed into three groups: one group of screw dislocations with tangent vector parallel to the slip direction, dα the other two groups of edge dislocations with tangent vectors parallel to nα and tα, respectively, and can be obtained by
 $$\dot{\rho }_{{\rm{GNDs}}}^\alpha = {1 / b}\left[ {{\nabla _x} \times \left( {{{\dot{\gamma }}^\alpha }{\bf{F}}_{\rm{P}}^{\rm{T}}{{\bf{n}}^\alpha }} \right)} \right] \cdot {{\bf{d}}^\alpha }\quad ,$$
 $$\dot{\rho }_{{\rm{GNDet}}}^\alpha = {1 / b}\left[ {{\nabla _x} \times \left( {{{\dot{\gamma }}^\alpha }{\bf{F}}_{\rm{P}}^{\rm{T}}{{\bf{n}}^\alpha }} \right)} \right] \cdot {{\bf{t}}^\alpha }\quad ,$$
 $$\dot{\rho }_{{\rm{GNDen}}}^\alpha = {1 / b}\left[ {{\nabla _x} \times \left( {{{\dot{\gamma }}^\alpha }{\bf{F}}_{\rm{P}}^{\rm{T}}{{\bf{n}}^\alpha }} \right)} \right] \cdot {{\bf{n}}^\alpha }\quad .$$
Finally, the change of GND density,  $\dot{\rho }_{{\rm{GND}}}^\alpha$ is calculated by
 $${\left( {\dot{\rho }_{{\rm{GND}}}^\alpha } \right)^2} = {\left( {\dot{\rho }_{{\rm{GNDs}}}^\alpha } \right)^2} + {\left( {\dot{\rho }_{{\rm{GNDet}}}^\alpha } \right)^2} + {\left( {\dot{\rho }_{{\rm{GNDen}}}^\alpha } \right)^2}\quad .$$
The second term in the CRSS Eq. (4) is the contribution from substructure dislocation densities and can be expressed according to the extended Taylor laws [Reference Madec, Devincre and Kubin29],
 $$\tau _{{\rm{sub}}}^\alpha = {k_{{\rm{sub}}}}\mu b\sqrt {\rho _{{\rm{sub}}}^\alpha } \log \left( {{1 \over {b\sqrt {\rho _{{\rm{sub}}}^\alpha } }}} \right)\quad ,$$
where k sub is a mathematical constant for recovering the Taylor law when substructure dislocation densities are at relatively low level.
And the evolution of substructure density is dependent on the recovery rate [Reference Jahedi, Ardeljan, Beyerlein, Paydar and Knezevic33],
 $$\Delta \rho _{{\rm{sub}}}^\alpha = qb\sqrt {\rho _{{\rm{sub}}}^\alpha } {k_2}\rho _{{\rm{for}}}^\alpha \sum\limits_\alpha {\left| {\Delta {\gamma ^\alpha }} \right|} \quad ,$$
where q is a temperature-dependent rate coefficient [Reference Jahedi, Ardeljan, Beyerlein, Paydar and Knezevic33],
 $$q = {q_0}\ln \left( {1 + {T \over {{q_1}}}} \right)\quad .$$
The preceding constitutive formulations are written as a user-defined material (UMAT) subroutine and implemented in finite element software package Abaqus CAE. To validate our model, we performed our calculations for NC Ni and CG Ni separately. The parameters and initial values of densities for different types of dislocations used in our calculations are listed in Table I. The predicted stress–strain curves compared with the experiment curves from different research groups are shown in Fig. 5(c). The experiment data for NC Ni [Reference Zhu, Zhou, Jiang and Zhang35, Reference Ebrahimi, Bourne, Kelly and Matthews36] and CG Ni [Reference Ma and Zhu37] are used to validate our discrete-CPFE model and the dislocation density-based model, respectively.
Parameters in the dislocation density based model for CG Ni.

It is worth to mention that the values for χ, k 1, g, and τD are simply to acquire the best fit with the experiment stress–strain curves for CG Ni, while the values for other parameters are obtained from the Ref. Reference Jahedi, Ardeljan, Beyerlein, Paydar and Knezevic33. From Fig. 5(c), we can see our predicted results match well with the experiment curves, such as the yield strength, flow strength, and strain hardening behavior. In addition, our model also accurately predicts the grain size effect on the strength of NC Ni. Here, we want to point out that the tiny mismatch between the predicted and experimental curves, especially for 20 nm NGs, is mainly induced by the difference on the grain size in experimental samples and our model. In our model, we assume all grains possess the same grain size equal to the average grain size measured from experimental studies, while the grain size of each grain in experimental samples may be different from the average grain size and vary with each other.
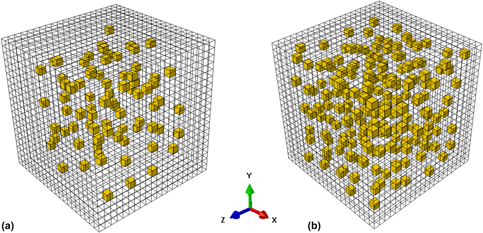
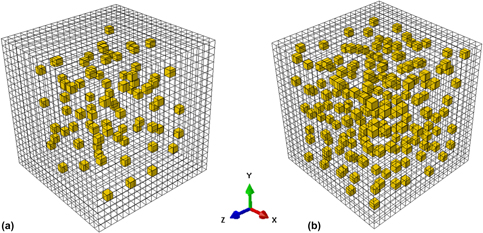
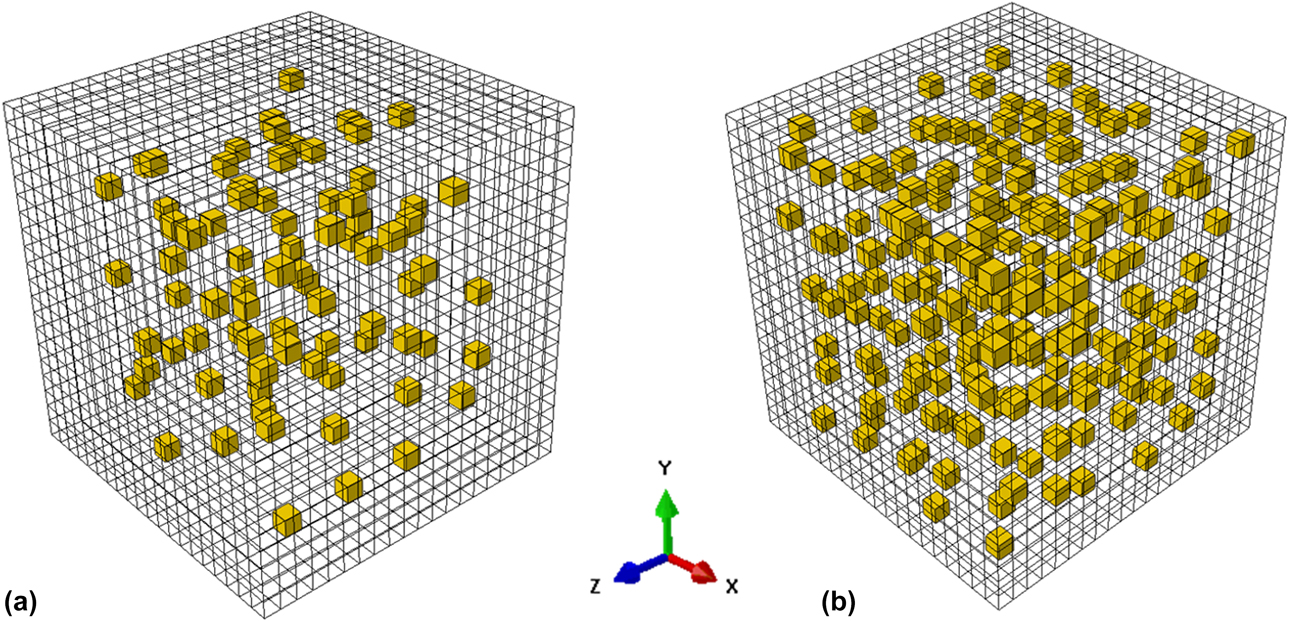
In order to identify the role of NGs on the deformation of the nanodomained structure, we create the finite element mesh with 8000 (20 × 20 × 20) elements to mimic one CG as shown in Fig. 6, in which NGs are randomly embedded. Since the volume fraction of the 7 nm NGs in the experimental studies is about 2.5% [Reference Wu, Yuan, Yang, Jiang, Zhang, Chen, Wei and Ma14], we use two different volume fractions 1 and 2.5% in this study to reveal the influence the volume fraction of the NGs on the strength of nanodomained Ni. In addition, the NGs size will be changed from 7 to 50 nm to understand how the NG size affect the deformation in nanodomained Ni. Furthermore, three different orientations ([001], [111], and [123]) are used in this work for the CG. [001] and [111] orientations are two typical multiple-slip orientations which have multiple-slip systems possessing the maximum Schmid factor as the same time, while [123] orientation is single-slip orientation with only one-slip system holding the maximum Schmid factor. For NGs, we randomly assign a crystallographic orientation to each grain in this work. The position of each NG in the mesh is fixed and the orientation of each NG does not change from one case to another. Thus, the influence of the spatial variation of the NGs on the calculated results will be excluded.
3D model of nanodomained (ND) structure comprising embedded nanograins (NGs) (orange) and a single CG (transparent). (a) 1% NGs; (b) 2.5% NGs.
To model the strengthening effect of NGs in bulk CGs, periodic boundary conditions have been applied in all three directions and the uniaxial tension is applied along the X direction at a constant strain rate of  $\dot{\varepsilon } = 1 \times {10^{ - 4}}\;{{\rm{s}}^{ - 1}}$. Based on the periodic boundary condition provided by Choi et al. [Reference Choi, Kim, Woo, Han and Kwak38], the displacements of two equivalent nodes (a) and (b) on opposite sides of the mesh are coupled with the deformation gradient,
 ${\bar{F}_{ij}}$,
 $$u_i^{\rm{a}} - u_i^{\rm{b}} = {\bar{F}_{ij}}\left( {x_{j0}^{\rm{a}} - x_{j0}^{\rm{b}}} \right) - \left( {x_{i0}^{\rm{a}} - x_{i0}^{\rm{b}}} \right)\quad ,$$
where  $x_{i0}^{\rm{a}}$ and
 $x_{i0}^{\rm{b}}$ represent the coordinates of the paired nodes in the predeformed configuration. This boundary condition can minimize the constraint effect and make the quantitative comparison of results from cases with different volume fractions and grains sizes more accurate.
Acknowledgments
This work was supported by NSF CAREER Award (CMMI-1652662). C.Z. also acknowledges support by the Extreme Science and Engineering Discovery Environment (XSEDE), award number DMR170093.