I. INTRODUCTION
Nanoindentation-induced phase transformation behaviors in single-crystal silicon (c-Si) have been commonly observed in previous publications.Reference Pharr, Oliver and Clarke1–Reference Zarudi and Zhang10 Corresponding to different phase transformation mechanisms, three types of phenomena, pop-ins in the loading process, pop-outs, and elbows in the unloading process, could appear in load–displacement curves. Pop-ins and pop-outs lead to discontinuities of load–displacement curves, whereas elbows change the slope of the unloading curve suddenly.
By combining Raman microspectroscopy,Reference Domnich, Gogotsi and Dub2,Reference Juliano, Gogotsi and Domnich3,Reference Jang, Lance, Wen, Tsui and Pharr6,Reference Bradby, Williams, Wong-Leung, Swain and Munroe8,Reference Pizani, Jasinevicius and Zanatta11,Reference Gerbig, Stranick and Cook12 cross-sectional transmission electron microscopy (XTEM),Reference Zarudi, Zou and Zhang5,Reference Yan, Takahashi, Gai, Harada, Tamaki and Kuriyagawa7,Reference Bradby, Williams, Wong-Leung, Swain and Munroe8,Reference Zarudi and Zhang10,Reference Ruffell, Bradby, Williams and Munroe13,Reference Bradby, Williams, Wong-Leung, Swain and Munroe14 and in situ electrical characterization,Reference Ruffell, Bradby, Williams and Munroe13,Reference Ruffell, Bradby, Williams and Warren15 the phase transformation mechanisms of these three types of phenomena have been widely investigated. It has been commonly accepted that in the loading process, the diamond cubic Si-I phase transforms into a metallic Si-II phase at a pressure of ∼11 GPa. In the unloading process, pop-outs and elbows occur depending on the unloading conditions such as the indentation load and unloading rate. Usually, a large indentation load and a low unloading rate will promote the appearance of pop-outs, whereas a small indentation load and a high unloading rate will lead to elbows. When the Si-II phase formed during the loading process transforms into a mixture of high-pressure Si-XII/Si-III phases during the unloading process, a pop-out appears. When the Si-II phase transforms into an amorphous phase (a-Si), an elbow appears, and the dominated end phase underneath the residual indent will be predominantly a-Si.
However, the nanoindentation-induced phase transformation in c-Si is a very complex issue, and some phase transformation paths have not been clarified. Recently, in situ transmission electron microscopy (TEM) nanoindentation has been used to dynamically observe phase transformations of an extremely thin silicon sample under an indenterReference Wall and Dahmen16; however, the mechanical responses of a thin sample may be different from that of bulk silicon. A few researchers have also used cyclic nanoindentation to study phase transformations in c-Si.Reference Pizani, Jasinevicius and Zanatta11,Reference Fujisawa, Williams and Swain17–Reference Fujisawa, Ruffell, Bradby, Williams, Haberl and Warren19 These researchers observed that before a pop-out appears, the load–displacement curve exhibits hysteresis, and after the pop-out, the indentation response becomes nearly elastic, and the hysteresis disappears.Reference Fujisawa, Williams and Swain17,Reference Fujisawa, Ruffell, Bradby, Williams, Haberl and Warren19 Research results obtained by combining XTEM and in situ electrical characterization suggest that Si-XII/Si-III phases have been partially formed during initial cycles before the pop-out event.Reference Fujisawa, Ruffell, Bradby, Williams, Haberl and Warren19
In this article, we report a secondary pop-out behavior observed in the cyclic nanoindentation of c-Si using a Berkovich indenter, which has been rarely reported in previous studies. A similar secondary pop-out behavior was presented by Zarudi et al. using a spherical indenterReference Zarudi, Zhang and Swain18; however, related phase transformation mechanisms were not discussed. In this article, we focus on the two pop-out events in cyclic nanoindentation of c-Si as well as their phase transformation paths and mechanisms, which will enhance understanding of pressure-induced phase transformations in c-Si.
II. EXPERIMENTAL
A c-Si (111) sample was used in this study. Nanoindentation tests were performed using an ENT-1100 nanoindentation instrument (Elionix Inc., Japan) equipped with a Berkovich type diamond indenter. For a single indentation cycle, a maximum indentation load of 50 mN and a loading/unloading rate of 5 mN/s were used. For ten indentation cycles, the maximum indentation loads of 10, 30, 50, and 100 mN and loading/unloading rates of 0.5, 1, 5, and 25 mN/s were selected. All the indentation cycles were performed in the load control mode, and the holding time at the maximum indentation load for each cycle was 1 s. After the nanoindentation tests, the end phases of the residual indents were characterized using a NRS-3000 Raman microspectrometer (JASCO Corporation, Tokyo, Japan), which has a 532 nm wave length laser beam focused to a ∼1 μm spot size.
III. RESULTS AND DISCUSSION
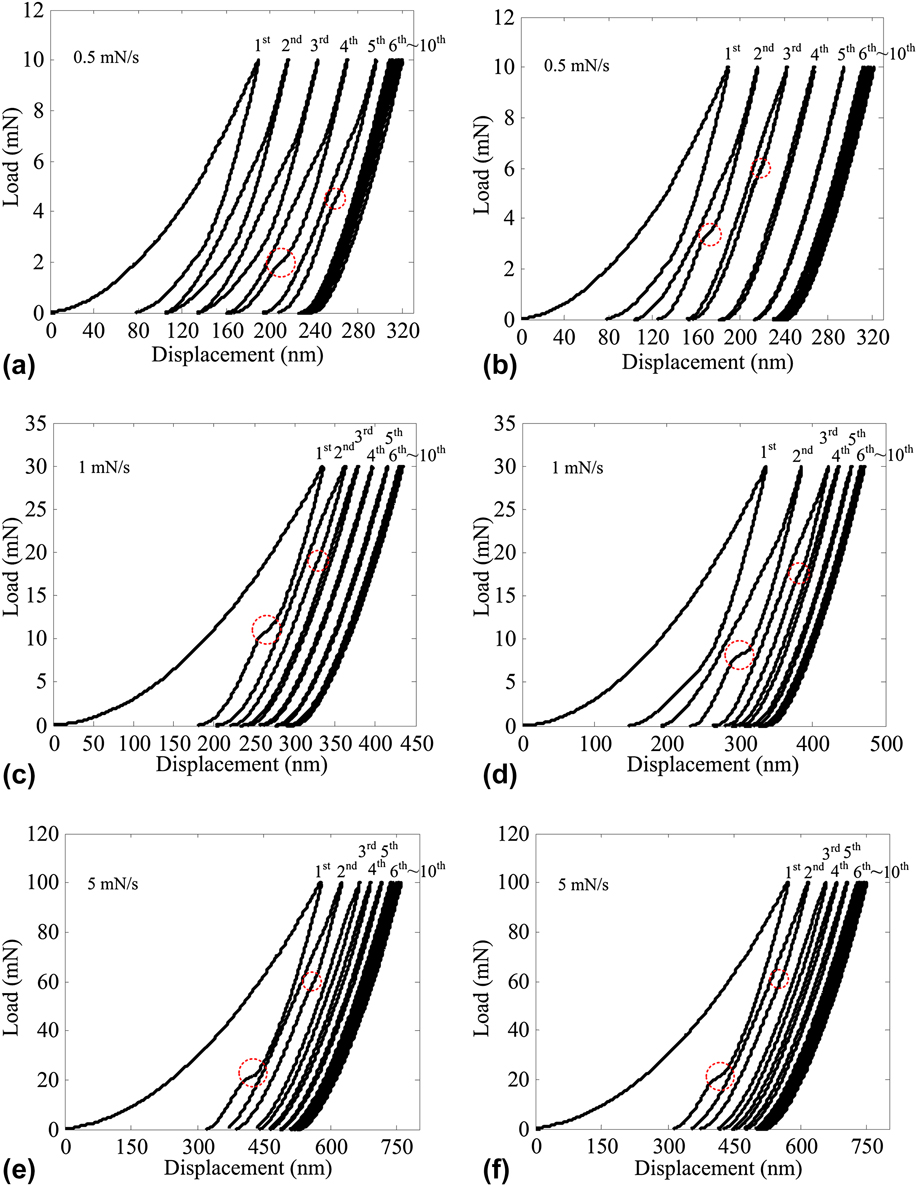
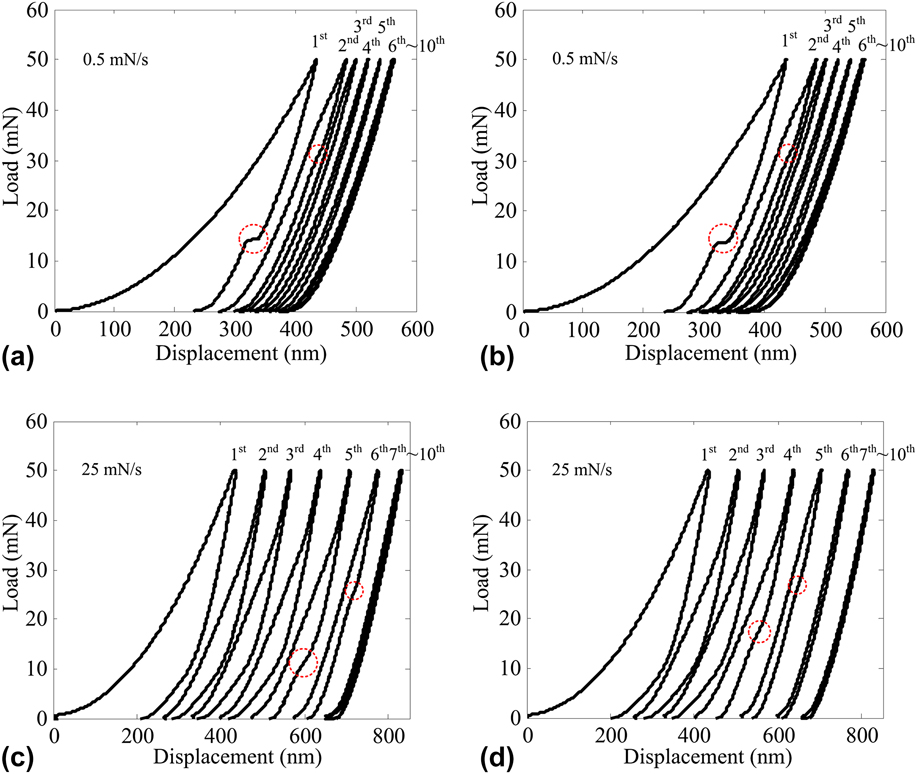
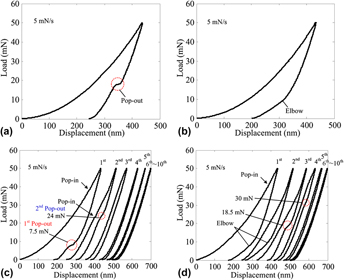
Figure 1 presents representative nanoindentation results of c-Si under a maximum indentation load of 50 mN and a loading/unloading rate of 5 mN/s. To clearly show the individual cycles, the reloading/unloading curves of the ten indentation cycles were artificially shifted to the right. In Fig. 1(a), a typical pop-out appears in the unloading curve, and the elbow is obviously observed in Fig. 1(b), which indicates that the loading/unloading rate of 5 mN/s is an intermediate value and that both the pop-out and the elbow can occur under this loading/unloading rate. The load–displacement curves in Figs. 1(c) and 1(d) further verify this conclusion. In Figs. 1(c) and 1(d), pop-ins also randomly appear in the loading curves. Furthermore, an interesting phenomenon is observed that two pop-out events appear in the unloading curves of two adjacent cycles within the first four cycles in Figs. 1(c) and 1(d). To verify the generality of this phenomenon, load–displacement curves of c-Si under various indentation loads and various loading/unloading rates are presented in Figs. 2 and 3, respectively. The results in these two figures indicate that two very similar pop-out events generally appear even under a small maximum indentation load of 10 mN, a low loading/unloading rate of 0.5 mN/s, or a high loading/unloading rate of 25 mN/s. In addition, it should be noted that the two pop-out events always occur in two adjacent cycles, such as the first and second cycles in Figs. 1(c), 2(c), 2(e), 2(f), 3(a), and 3(b) and the third and fourth cycles in Fig. 1(d), after which the load–displacement hysteresis decreases rapidly and the indentation response then becomes elastic, such as in the 5th–10th cycles in Figs. 1(c) and 1(d). Additionally, the critical load for the secondary pop-out is obviously larger than that for the first pop-out. This type of two pop-out phenomena has rarely been reported and has not been previously discussed, most likely because in previous studies, a very small maximum indentation load (∼10 mN) was usually used when an elbow was dominant.Reference Fujisawa, Williams and Swain17,Reference Fujisawa, Ruffell, Bradby, Williams, Haberl and Warren19
Load–displacement curves of c-Si under a maximum indentation load of 50 mN and a loading/unloading rate of 5 mN/s: (a) a single indentation cycle with a pop-out in the unloading curve; (b) a single indentation cycle with an elbow in the unloading curve; (c) and (d) ten indentation cycles.

Load–displacement curves of c-Si under various maximum indentation loads: (a) and (b) 10 mN; (c) and (d) 30 mN; and (e) and (f) 100 mN.

Load–displacement curves of c-Si under the same maximum indentation load of 50 mN but different loading/unloading rates: (a) and (b) 0.5 mN/s and (c) and (d) 25 mN/s.

We also observed that in Figs. 2(e) and 2(f) (additional experimental results are not shown here), for a maximum indentation load of 100 mN, the two pop-out events appeared in the first two indentation cycles. However, the situation is different for the maximum indentation loads of 10, 30, and 50 mN; in Figs. 1(d), 2(a), 2(b) and 2(d), an elbow appears in the first cycle, and the two pop-out events are delayed. Although the secondary pop-out may be invisible in Figs. 2(c), 2(e), 2(f) and 3(d), its existence can be detected by analyzing the displacement difference.Reference Huang, Zhao, Zhang, Yang and Ma20 A similar phenomenon was reported in Ref. Reference Fujisawa, Ruffell, Bradby, Williams, Haberl and Warren19 (a maximum indentation load of 10 mN), where a pop-out event was observed after five elbows; however, the secondary pop-out event was not detected. The reason may be that the displacement change during the secondary pop-out event was so small at a small maximum indentation load that the instrument could not distinguish it. In addition, we observe that when the elbow appears in the first cycle, as shown in Fig. 1(d), the critical loads for the two pop-out events are obviously larger than that in Fig. 1(c), where no elbow occurs prior to the pop-out event.
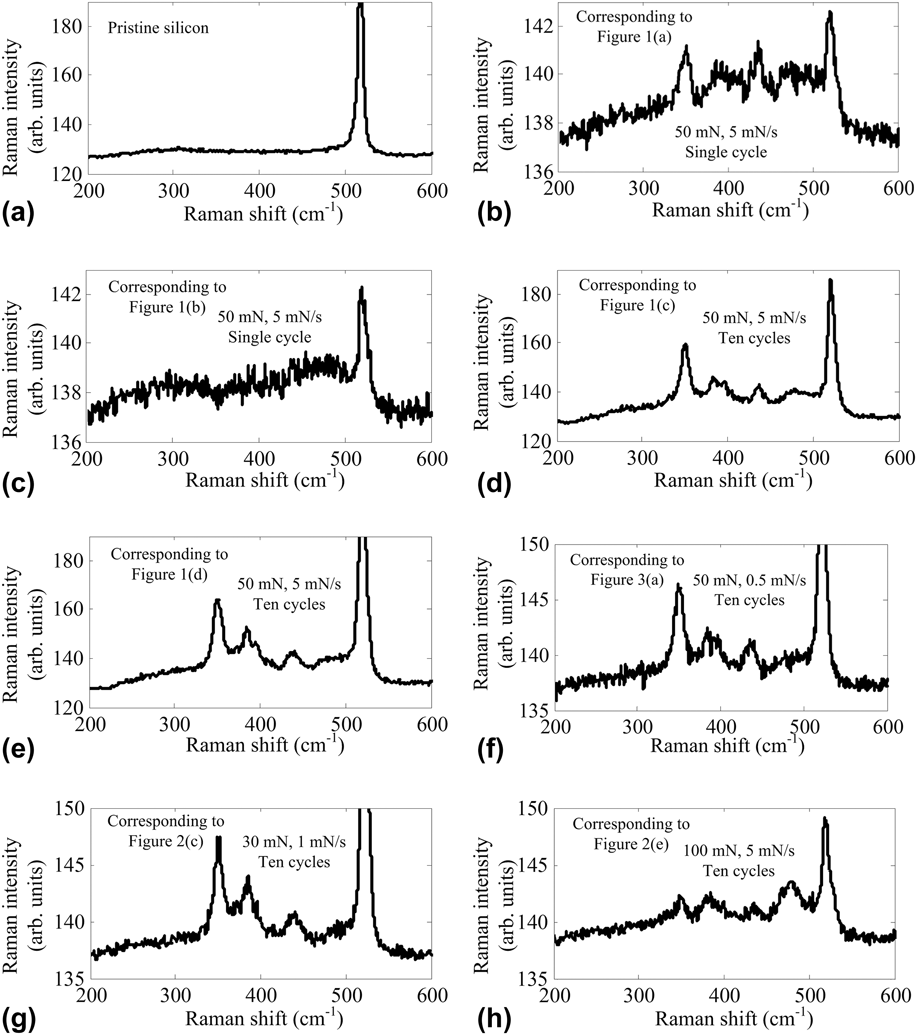
Raman spectra curves of some residual indents as well as the pristine silicon are presented in Fig. 4. The correspondence between these Raman spectra curves and the load–displacement curves in Figs. 1–3 is highlighted in Fig. 4. Compared with the pristine silicon, the peaks at ∼350, 382, and 435 cm−1 are clearly observed in Figs. 4(b), 4(d)–4(h), which demonstrates that a mixture of Si-XII/Si-III phases appear.Reference Pizani, Jasinevicius and Zanatta11 This result indicates that although the number of indentation cycles, loading/unloading rates, and maximum indentation loads are different, the residual indents result in Raman spectra curves with similar peaks, indicating that the dominated end phases of these residual indents are the same, namely, a mixture of Si-XII/Si-III phases, after the pop-out event. In contrast, when the elbow appears in Fig. 1(b), only the broadband at ∼470 cm−1 is induced in the Raman spectra curve, as shown in Fig. 4(c) compared with the pristine silicon, demonstrating that the a-Si phase appears. In Figs. 4(b), 4(d), and 4(h), a peak at ∼485 cm−1 appears, which could be attributed to the Si-XIII phase, possibly resulting from thermal annealing by the Raman laser or potentially a-Si because of a relatively broader shoulder.Reference Jang, Lance, Wen, Tsui and Pharr6 Compared with the other figures in Fig. 4, the peak at ∼485 cm−1 in Fig. 4(h) has a broader shoulder, which could be correlated with the occurrence of cracking upon loading with a maximum indentation load of 100 mN, resulting in a sudden pressure release and thus in the formation of a-Si.
Raman spectra curves: (a) corresponds to the pristine silicon, (b) corresponds to Fig. 1(a), (c) corresponds to Fig. 1(b), (d) corresponds to Fig. 1(c), (e) corresponds to Fig. 1(d), (f) corresponds to Fig. 3(a), (g) corresponds to Fig. 2(c), and (h) corresponds to Fig. 2(e). The experimental conditions are indicated in the figures.

It is well accepted that the pop-out event involves transformation of the Si-II phase into the Si-XII/Si-III phases during the unloading process and that the high-pressure Si-XII/Si-III phases are relatively stable and do not retransform back into the Si-II phase up to the maximum indentation load.Reference Ruffell, Bradby, Williams and Munroe13,Reference Fujisawa, Williams and Swain17,Reference Fujisawa, Ruffell, Bradby, Williams, Haberl and Warren19 A few authors have suggested that the Si-XII/Si-III phases may retransform back into the Si-II phase under a higher critical pressure. For example, Fujisawa et al. observed that a pop-out appeared for a maximum indentation load of 8 mN, and a secondary pop-out event occurred at a greater load on the same indent.Reference Fujisawa, Williams and Swain17 In Ref. Reference Jian, Chen and Juang21, a similar phenomenon was reported that the reversible phase transformations between Si-XII/Si-III and Si-II may occur in the subsequent reloading/unloading cycles with increased indentation loads, which leads to pop-out events in subsequent indentation cycles. However, in this study, the secondary pop-out event occurs at the same maximum indentation load. This fact strongly indicates that the secondary pop-out phenomenon cannot be explained by the reversible phase transformation between Si-XII/Si-III and Si-II.
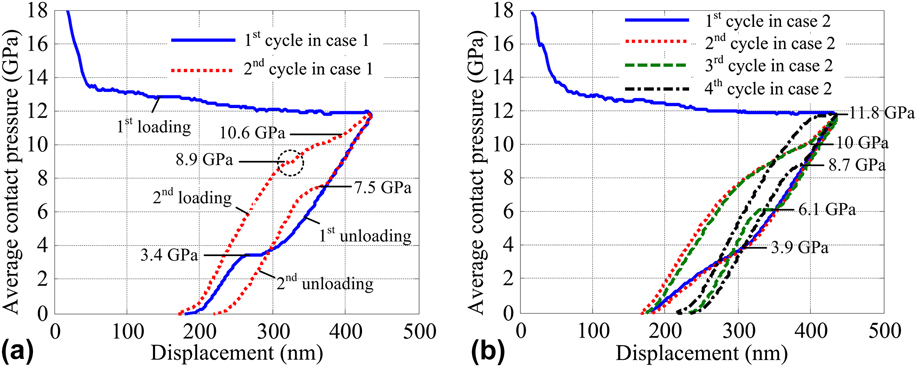
As the phase transformation of c-Si is dependent on the pressure beneath the indenter, in this study, the average contact pressure (ACP) during loading and unloading in Fig. 1(c) (first and second cycles) and Fig. 1(d) (first–fourth cycles) was calculated using the method proposed by Novikov et al.Reference Novikov, Dub, Milman, Gridneva and Chugunova22 This method assumes that the elastic deflection of the sample surface is directly proportional to the square root of the indentation load, and it has been widely used to analyze indentation-induced phase transformations in semiconductors.Reference Juliano, Gogotsi and Domnich3,Reference Jian, Chen and Juang21
The calculation results are presented in Fig. 5. For convenience, Figs. 1(c) and 1(d) are called case 1 and case 2 in the following description, respectively. In case 1, the first and second pop-out events occur at ACPs of ∼3.4 and ∼7.5 GPa, respectively. In case 2, the elbow in the first and second unloading processes occurs at nearly the same ACP (∼3.9 GPa), and the first and second pop-out events occur at ACPs of ∼6.1 and ∼8.7 GPa, respectively, which is obviously larger than those for case 1. According to the slope variation, the second loading curve in case 1 can be roughly divided into two portions, and the turning point is at the ACP of ∼10.6 GPa. Before 10.6 GPa, the slope gradually decreases, and after 10.6 GPa, the slope increases. Similar trends are also observed in the second and third loading curves in case 2 with a slightly different ACP (∼10 GPa). The turning point of the loading curve is an indication that the phase transformation into the Si-II phase has been completed. At the ACP of ∼8.9 GPa, a pop-in event appears in case 1, which further verifies that the Si-II phase has been formed before the turning point.
ACP versus indentation displacement curves of cyclic nanoindentations: (a) first and second cycles in case 1 and (b) first to fourth cycles in case 2.

Based on the ACP analysis, the mechanism of the secondary pop-out events might be suggested from the viewpoint of an incomplete phase transformation in nanoindentation, which has been discussed by Ruffell et al. through crystal nucleation and growth.Reference Ruffell, Bradby, Williams and Munroe13 Figures 6(a) and 6(b) show the phase transformation paths of c-Si during cyclic nanoindentation in case 1 and case 2, respectively. In these figures, the volume fractions of the phases are quantitatively denoted by the heights of the corresponding rectangles.
The possible phase transformation paths of c-Si from the Si-I phase into a mixture of Si-XII/Si-III phases for (a) case 1 and (b) case 2 based on the crystal nucleation and growth mechanism. ↑ and ↓ denote loading and unloading processes, respectively. The heights of the rectangles quantitatively denote the volume fractions of the corresponding phases.

In case 1, in the first loading process, most of the Si-I phase underneath the indenter transforms into the Si-II phase when the ACP reaches ∼12 GPa; however, some untransformed Si-I phases remain below the indenter with consideration of the stress gradient under the indenter but have the potential to be transformed in the subsequent cycles. During the early stage of the first unloading process, small seed volumes of Si-XII/Si-III phases form by random nucleation and grow with the ACP release.Reference Ruffell, Bradby, Williams and Munroe13 At a critical ACP of ∼3.4 GPa, the Si-XII/Si-III phases rapidly grow to occupy a substantial volume fraction of the indent volume followed by volume expansion; meanwhile, the first pop-out event occurs. The residual phase in the indent volume after the first pop-out event is a mixture of Si-XII/Si-III, a-Si, and Si-I phases.Reference Gerbig, Stranick and Cook12
In the second loading process, the residual a-Si can easily transform into Si-II. It is known that the Si-XII/Si-III phases are harder than Si-I and a-Si phases, which will increase the pressure on the surrounding untransformed Si-I phase, resulting in some untransformed Si-I phase transforming into the Si-II phase. The relative intensities of the peaks at ∼350 cm−1 (main Si-XII peak) and 435 cm−1 (main Si-III peak) differ from ∼1:1 in Fig. 4(b) to ∼2:1 in Figs. 4(d)–4(g). This finding may suggest a different relative ratio of the Si-XII phase to the Si-III phase after one pop-out compared with that after ten indentation cycles, which indicates that the Si-III phase may retransform into the Si-XII phase on the subsequent reloading processes. In addition, previous diamond anvil cell studies have demonstrated that the Si-III phase transforms into the Si-XII phase at a pressure above ∼2.5 GPa,Reference Crain, Ackland, Maclean, Piltz, Hatton and Pawley23 suggesting that the Si-XII/Si-III phases gradually transform into a nearly completed Si-XII phase during the reloading process. In the second unloading process, the Si-XII phases formed in the first unloading process work as seeds and can rapidly grow, which is different from that in the first unloading process formed by randomly nucleating and growing. This difference may be the reason why the secondary pop-out event occurs at a higher ACP (∼7.5 GPa) at a much earlier stage of the unloading process. After the secondary pop-out event, the dominated end phases are the Si-XII/Si-III phases, and nearly no a-Si and Si-I phases remain in the indent volume; therefore, no additional pop-out events are observed in the subsequent indentation cycles.
Similar phase transformation paths for case 2 are shown in Fig. 6(b). The reason why the two pop-out events occur at higher ACPs (6.1 and 8.7 GPa) in case 2 than those in case 1 (3.4 and 7.5 GPa) is that small volumes of Si-XII/Si-III phases have formed in the first and second cycles in case 2 even though the elbow appears,Reference Fujisawa, Ruffell, Bradby, Williams, Haberl and Warren19 which can work as seeds for the subsequent phase transformations from Si-II phase to Si-XII/Si-III phase and accelerate the phase transformations. Thus, it can be concluded that the residual phases formed in previous indentation cycles strongly affect the critical ACP at which the pop-out event occurs. Previous elbows will promote the pop-out events to occur at higher critical ACPs at a much earlier stage of the unloading process. In addition, the ACP analysis results suggest that a higher volume fraction of Si-XII/Si-III phases leads to a higher critical ACP at which the phase transformation into the Si-II phase is completed in loading (10 GPa for the second and third cycles in case 2, 10.6 GPa for the second cycle in case 1, and 11.8 GPa for the fourth cycle in case 2).
IV. CONCLUSION
In summary, a secondary pop-out event that closely follows the first pop-out event was observed during cyclic nanoindentation of c-Si. The experimental results indicate that double pop-out events generally exist even under a small maximum indentation load of 10 mN, a low loading/unloading rate of 0.5 mN/s, and a high loading/unloading rate of 25 mN/s. However, their occurrence strongly depends on the first indentation. Raman spectroscopy results indicate that in the residual indents after the secondary pop-out event, the dominated end phase is a mixture of Si-XII/Si-III, without any new phase formed. Based on ACP analysis, phase transformation paths and mechanisms for the secondary pop-out event were suggested from the viewpoint of crystal nucleation and growth. The results indicate that phase transformations from the Si-I phase into Si-XII/Si-III phases are completed by two pop-out events, and the Si-XII/Si-III phases formed in previous indentation cycles affect the subsequent loading/unloading cycles. For loading, the increase in the volume fraction of Si-XII/Si-III phases leads to a higher critical ACP at which the phase transformation to the Si-II phase is completed. For unloading, small volumes of Si-XII/Si-III phases formed during the previous indentation cycles with elbows and predominantly an a-Si end phase promote the subsequent double pop-out events to occur at much earlier stages of unloading.
However, it should be noted that our understanding of the double pop-out events in this article is based on the results obtained from Raman spectroscopy as well as other previous publications because of the limitation of our experimental conditions. In the future, TEM and in situ electrical characterization will be performed to further study the mechanisms of the double pop-out events.
ACKNOWLEDGMENTS
H.H. as an International Research Fellow of the Japan Society for the Promotion of Science (JSPS) acknowledges financial support from JSPS (Grant No. 26·04048). Also we thank the reviewers for the professional review and valuable comments and suggestions.