1 Introduction
Most languages contrast consonants in word-medial position (e.g. Ham Reference Ham2001 on Lebanese Arabic, Hansen Reference Hansen, Agwele, Warren and Park2004 on Persian, Aoyama & Reid Reference Aoyama and Reid2006 on Guinaang Bontok), while only a handful of them do so in word-initial position (e.g. Ridouane Reference Ridouane2007 on Tashlhiyt Berber). Kelantan Malay (KM), spoken in Northeastern Malaysia is unusual amongst the world's language in having a phonemic contrast between singleton and geminate consonants solely in word-initial position (e.g. /kabo/ ‘blurry’ vs. /kkabo/ ‘beetle’; see our experimental data shown in Table 2 in Section 2.1). As such, like closely related Pattani Malay (e.g. Abramson Reference Abramson and Gamkrelidze1987), KM presents an interesting case study for the experimental investigation of word-initial consonant gemination.
Besides durational acoustic correlates (e.g. closure and VOT duration) discussed in the phonetic literature with regard to consonant gemination in word-medial position (e.g. Local & Simpson Reference Local, Simpson and Ohala1999 on Malayalam) and in much less-investigated word-initial position (e.g. Muller Reference Muller2001 on Cypriot Greek), many researchers (e.g. Ridouane Reference Ridouane2007) have also attempted to understand the potential relationship consonant gemination may have with additional, possibly language-specific, non-durational acoustic parameters and examine how these ‘co-variants’ potentially mark further the singleton/geminate contrast. More specifically, some studies (e.g. Abramson Reference Abramson, Warotamasikkhadit and Panakul1998) have investigated whether and how non-temporal cues help disambiguate the word-initial consonant contrast in certain contexts, such as in the case of voiceless stop geminates in utterance-initial position. As noted in Abramson's (e.g. 1998) work for Pattani Malay (henceforth PM), a closely related Malay variety with which KM shares many phonological features,Footnote 1 acoustic closure duration information is unavailable in this specific utterance condition and therefore perceptually indiscernible. In this context, Abramson (Reference Abramson and Gamkrelidze1987, Reference Abramson, Warotamasikkhadit and Panakul1998) suggests post-consonantal vowel amplitude and f0 operate as important secondary cues to the PM word-initial contrast (the next three subsections will explain this point in detail). Abramson (Reference Abramson, Solé, Recasens and Romero2003: 390) further speculates that PM might be undergoing a transition to ‘a system of accentual prominence’ on the first syllable containing word-initial geminates, which could also be linked to the singleton/geminate consonant contrast in KM. This speculation, however, has yet to be experimentally confirmed in both PM and KM.
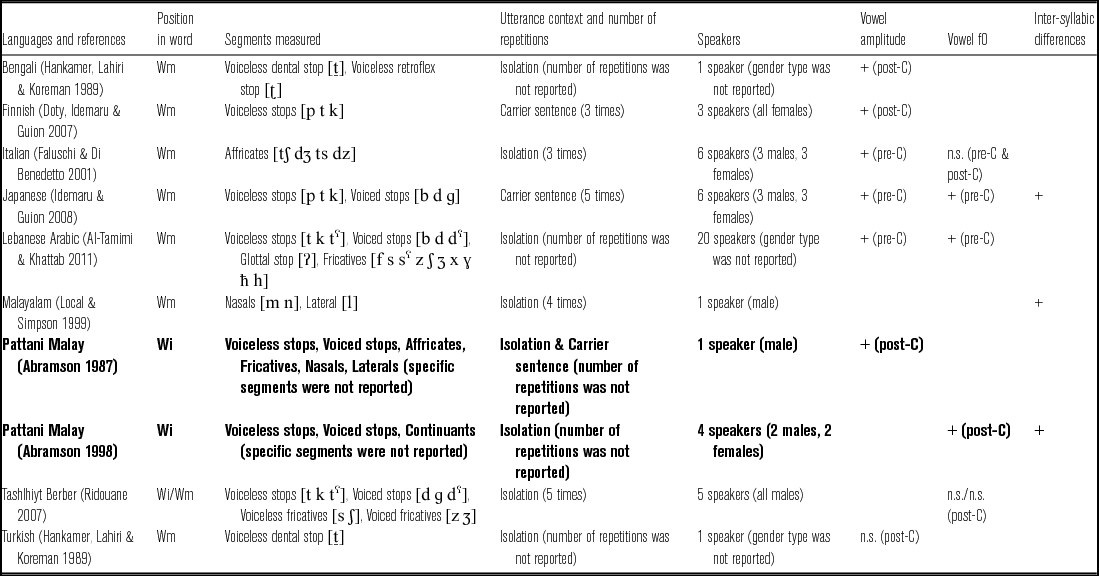
In the present study, we focus on post-consonantal vowel amplitude and f0 that may potentially serve as important secondary or concomitant cues to the word-initial singleton/geminate contrast in KM alongside closure duration that has been established as a robust and consistent acoustic correlate in this variety (see Hamzah, Fletcher & Hajek Reference Hamzah, Fletcher and Hajek2016).Footnote 2 More specifically, we are interested in examining the extent to which the following acoustic parameters can further mark word-initial consonant gemination in KM: (i) vowel amplitude measured at the start of the vowel after the target consonant; (ii) vowel f0 measured at the start of the vowel after the target consonant; and (iii) inter-syllabic differences in relative amplitude and relative f0 measured at the start of the vowel across syllables of disyllabic words. We are of course aware of other potential acoustic parameters besides vowel amplitude and f0, such as VOT duration (e.g. Arvaniti & Tserdanelis Reference Arvaniti, Tserdanelis, Yuan, Huang and Tang2000) or burst amplitude (e.g. Doty, Idemaru & Guion Reference Doty, Idemaru, Guion, van Hamme and van Son2007) of the target consonant. However, in this study, we aim to assess the reliability of vowel amplitude and f0 given these specific parameters have been examined in some previous studies for languages with geminate consonants (particularly PM), as summarised in Table 1.
A review of non-durational correlates associated with the singleton/geminate contrast in nine languages with word-initial and/or word-medial consonant contrasts.

‘Wi’ = word-initial position; ‘Wm’ = word-medial position; ‘+’ = the parameter reported to vary significantly as a function of the consonant contrast (at least p < .05); ‘n.s.’ = the parameter reported to be an unreliable cue to the contrast; ‘pre-C’ = the results for pre-consonantal vowels; ‘post-C’ = the results for post-consonantal vowels. Unmarked cells indicate that the parameter was not investigated. The results for PM are highlighted in bold.
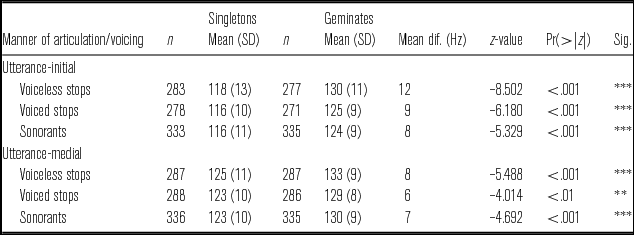
In Table 1, we specifically focus on the three non-durational acoustic correlates investigated in the present study (see the final three columns in Table 1), as also mentioned earlier. Nine languages with word-initial and/or word-medial geminates are reviewed, including PM (highlighted in bold). It can be seen that, overall, there is inconsistency with regard to the contribution of these parameters toward marking the consonant contrast, suggesting the language-specificity and secondary importance of these acoustic correlates. It should also be noted that this discrepancy may be accounted for by methodological and data set differences across the listed studies, i.e. there are differences in terms of segment identity, utterance context, number of repetitions and speakers (see columns 3–5 in Table 1). Each parameter under investigation here is now addressed in turn in the next three subsections.
1.1 Vowel amplitude
Krull & Traunmüller (Reference Krull, Traunmüller, Eriksson and Lindh2002) claim that segments preceding and/or following the consonant that carries the quantity distinction contribute to the perception of consonant gemination. That is to say, word-initial consonant contrasts, as in word-medial position, may be defined by systematic differences in various phonetic parameters surrounding the target segment, such as the characteristics of the following vowel.Footnote 3 This is shown in PM for which Abramson (Reference Abramson and Gamkrelidze1987: 69) measured the average RMS amplitude of the initial syllable of disyllabic words beginning with word-initial singletons and geminates (i.e. #C(C)V) for plosives (voiceless stops, voiced stops and affricates) and continuants (fricatives, nasals and laterals). Though limited to only one male native speaker of PM, Abramson found the overall mean RMS amplitude values to be greater in the geminate environment (49.5 dB) than in the singleton environment (46.5 dB), a difference of 3 dB (p < .001) and just at the suggested just-noticeable-difference (JND) value of 3 dB for the perception of intensity (Toole & Olive Reference Toole and Olive1988). The greater vowel amplitude associated with preceding geminate consonants in this finding can be taken to mean that it may be an enhancing strategy to maintain the word-initial consonant contrast, particularly in the case of utterance-initial voiceless stops in PM.
Systematic differences in amplitude surrounding the target consonant are also observed in other languages with word-medial geminates, as shown in Table 1 (specifically Bengali, Finnish, Italian, Japanese and Lebanese Arabic). Post-consonantally, Hankamer, Lahiri & Koreman (Reference Hankamer, Lahiri and Koreman1989: 288) report for Bengali that the RMS value of the syllable following geminates is significantly higher (p < .005) than that following singletons (absolute RMS values were not reported for this language). In the same study, however, Turkish does not show any reliable changes in amplitude. In Finnish, like Bengali, Doty et al. (Reference Doty, Idemaru, Guion, van Hamme and van Son2007: 2739) found a significantly higher RMS value (p < .005) in the syllable after geminates (mean RMS value = 65.84 dB) than that after singletons (mean RMS value = 64.76 dB), although the amplitude difference is very small.Footnote 4 Pre-consonantally, in Italian, Faluschi & Di Benedetto (Reference Faluschi and Di Benedetto2001: 9) claim that there is the tendency to give more emphasis to the pre-geminate vowel compared to the pre-singleton vowel, although the amplitude difference between the two vowels is also very small in this language (mean difference = 1.6 dB). Similarly, in Japanese (Idemaru & Guion Reference Idemaru and Guion2008: 179) and Lebanese Arabic (Al-Tamimi & Khattab Reference Al-Tamimi, Khattab, Lee and Zee2011), the effect of vowel amplitude is found to be significant (both p < .01), with vowels before geminates usually showing higher intensity as compared to those before singletons.Footnote 5
1.2 Vowel f0
In addition to greater intensity, it has been established that f0 variation in neighbouring vowels can also signal the singleton/geminate distinction (see e.g. Ridouane Reference Ridouane2007, Idemaru & Guion Reference Idemaru and Guion2008). This has been experimentally tested in PM (Abramson Reference Abramson, Warotamasikkhadit and Panakul1998: 8) in which f0 values are averaged in the initial syllable of disyllabic words beginning with word-initial singletons and geminates, following a similar procedure mentioned in the previous section for vowel amplitude. Unfortunately, Abramson does not provide the exact mean f0 values associated with the singleton/geminate contrast in this variety. Nevertheless, the general observation is that there is always higher f0 in the first syllable of disyllabic words beginning with geminates, confirming Abramson's (Reference Abramson and Gamkrelidze1987) assertion that the word-initial consonant contrast in PM is accompanied by a suite of acoustic cues including f0.
In other languages with word-medial geminate consonants, as can be observed in Table 1 (the seventh column), f0 appears to be enhanced in one way or another around geminates in at least two languages reviewed (i.e. Japanese and Lebanese Arabic). In Japanese (Idemaru & Guion Reference Idemaru and Guion2008: 180), there is a significant increase of f0 in vowels BEFORE geminates, with a greater effect before voiced stop geminates (mean f0 = 32 Hz) than before voiceless stop geminates (mean f0 = 29 Hz). Idemaru & Guion (Reference Idemaru and Guion2008) hypothesise that the enhancement of vowel f0 before voiced stop geminates in Japanese may be part of a strategy to compensate for the weakening of voicing in the following closure phase (see also Kawahara Reference Kawahara, Flack and Kawahara2005). In Lebanese Arabic, Al-Tamimi & Khattab (Reference Al-Tamimi, Khattab, Lee and Zee2011) report significant f0 results for vowels BEFORE the target consonant, with higher f0 values in the geminate environment than in the singleton environment (the exact f0 values were nevertheless unreported).
Likewise, this trend also generally holds true for Tashlhiyt Berber voiced stop geminates (Ridouane Reference Ridouane2007: 132–134); the mean f0 values in vowels FOLLOWING the target consonant (i.e. voiced stops) are 144 Hz for singletons and 154 Hz for geminates (a difference of 10 Hz).Footnote 6 Although this difference is not significant (p = .0827), Ridouane nevertheless considers the f0 enhancement as an important concomitant cue for some speakers who use it as part of the ‘enhancing correlates’ (Ridouane Reference Ridouane2007: 119) to compensate for the devoicing of voiced stops in the geminate environment, i.e. for some Tashlhiyt Berber speakers, there is a tight relationship between geminate devoicing and f0 differences so much so that the f0 values for vowels following devoiced geminates are significantly higher than those for vowels following their singleton voiced counterparts. In other words, in Tashlhiyt Berber (Ridouane Reference Ridouane2007) as well as in Japanese (Idemaru & Guion Reference Idemaru and Guion2008), f0 differences are manipulated in such a way that the potential loss of voicing in the preceding/following target consonant appears to be compensated, which in turn ensures that the singleton/geminate contrast is maintained in these languages. In Italian, however, Faluschi & Di Benedetto (Reference Faluschi and Di Benedetto2001) did not find statistically meaningful differences in terms of f0 between surrounding vowels in the singleton and geminate environments, except for slight changes in f0 when it is measured in the vowel offset before the target consonant (i.e. vowel offset f0 is about 14 Hz higher in the geminate context).
1.3 Inter-syllabic differences
Under the hypothesis that inter-syllabic differences may also cue the word-initial consonant contrast in PM, Abramson (Reference Abramson, Warotamasikkhadit and Panakul1998) asserts that, in addition to the amplitude and f0 differences in post-consonantal vowels, as generally reviewed earlier, the distinction between utterance-initial voiceless stop singletons and geminates can also be marked via the relative amplitude and relative f0 relationship across syllable boundaries in disyllabic words (the preferred phonotactic structure in KM and PM). Abramson (Reference Abramson, Warotamasikkhadit and Panakul1998: 12–13) reports for his PM voiceless stop data that the overall mean amplitude ratios across two syllables of disyllabic tokens are 0.47 for words beginning with voiceless stop singletons and 2.97 for those beginning with voiceless stop geminates. The value below 1 for words with singletons indicates lower amplitude in the first than in the second syllable, while the value above 1 for words with geminates suggests higher amplitude in the first syllable relative to the second one. As for relative f0, the overall mean f0 ratios are 0.10 for words beginning with voiceless stop singletons and 1.10 for those beginning with voiceless stop geminates. The value above 1 associated with the mean f0 ratio for words beginning with geminates indicates much higher f0 in the initial syllable beginning with geminates in comparison to that beginning with singletons.Footnote 7 On the basis of these findings, Abramson concludes that these two parameters (i.e. relative amplitude and relative f0) may characterise and enhance the PM word-initial consonant contrast, with relative f0 being more reliable as compared to relative amplitude. Abramson (Reference Abramson, Fant, Fujisaki, Cao and Xu2004: 20) also claims that, as a result of this cross-syllabic pattern, PM speakers may have shifted the word-initial consonant contrast to a larger prosodic system of relative salience, i.e. the amplitude and f0 ratios across syllables of disyllabic words are higher in words beginning with geminates than in those beginning with singletons.
In the broader literature on consonant gemination, the relative contribution across syllables has also been suggested as a possible enhancing criterion in some languages with word-medial geminates (i.e. in the VC(C)V environment), as shown in Table 1 (specifically Japanese and Malayalam). In Japanese, the relative values between syllables are interpreted in terms of a pitch contour shape; Idemaru & Guion (Reference Idemaru and Guion2008) state that f0 is higher in vowels preceding geminates than in those following geminates, suggesting that a pitch contour falls from the first syllable to the second one in the geminate context. Likewise, the intensity of the pre-geminate syllable relative to that of the post-geminate syllable is also reported to be greater in this language. In a follow-up experiment by Kubozono et al. (Reference Kubozono, Takeyasu, Giriko, Hirayama, Lee and Zee2011), falling pitch is considered as an important auxiliary cue for Japanese geminate consonants. In Malayalam, the relationship between syllables surrounding the word-medial consonant contrast is described in terms of vowel quality; Local & Simpson (Reference Local, Simpson and Ohala1999: 598) report that there is a ‘final-i effect’ for words in the singleton environment (e.g. karli) such that the vowel in the initial syllable is relatively fronter (i.e. higher f2 value) than if there is a non-close front vowel in the second syllable (e.g. karlam). If the word contains a geminate consonant (e.g. karlli, karllam), the vowel in the preceding syllable is relatively fronter irrespective of the effect of the vowel in the final syllable.
1.4 Aim of this study
As previously reviewed, there are often systematic differences in the observed non-durational parameters with respect to a consonant contrast across languages. That consonant contrast is also manifested via vowel amplitude, vowel f0 and inter-syllabic differences in some, if not all, languages supports the already stated view that, in the right context, multiple acoustic parameters can help define the singleton/geminate contrast. This would particularly be the case for the word-initial consonant contrast in which the perceptibility level is claimed to be more marked (e.g. Kawahara Reference Kawahara, Bateman, O'Keefe, Reilly and Werle2007), such as in KM and PM. The aim of this study is therefore to investigate the potential roles of non-durational acoustic properties in marking the KM word-initial singleton/geminate contrast, the primary research question being whether there are systematic differences between singletons and geminates in terms of (i) vowel onset amplitude, (ii) vowel onset f0 and (iii) inter-syllabic differences (i.e. relative amplitude and relative f0) in disyllabic words beginning with singletons and geminates in KM. We specifically examine the ONSET of the following vowel since previous studies (e.g. House & Fairbanks Reference House and Fairbanks1953, Ohde Reference Ohde1984) have shown that the influence of the preceding consonant tends to take place in the early part of the following vowel. In this regard, we expect that vowel onset amplitude and f0 will contribute to the distinction between singletons and geminates in KM alongside the already established robust acoustic parameter of closure duration (Hamzah, Fletcher & Hajek Reference Hamzah, Fletcher and Hajek2016; Hamzah, Hajek & Fletcher Reference Hamzah, Hajek, Fletcher, Carignan and Tyler2016), as also observed in the closely related language PM.
Moreover, we also investigate whether the non-durational acoustic correlates mentioned earlier are further conditioned by (i) utterance position and (ii) manner of articulation/stop voicing type. In this regard, the analysis of the word-initial consonant contrast is critical given the earlier findings on the association between utterance position and domain-initial strengthening (see e.g. Cho Reference Cho2001, Cho & Keating Reference Cho and Keating2001, Keating et al. Reference Keating, Cho, Fougeron, Hsu, Local, Ogden and Temple2003, among others). Cho & Jun (Reference Cho and Jun2000) suggest two types of domain-initial strengthening effects: (i) syntagmatic contrast enhancement and (ii) paradigmatic contrast enhancement. The former refers to the contrast between the initial segment and the following vowel, i.e. the consonant–vowel (CV) contrast at the beginning of a prosodic domain, e.g. an intonational phrase, while the latter deals with the enhancement of a contrastive phonemic distinction such as the singleton/geminate consonant contrast which is the main focus of the current study of KM. Given the fact that the singleton/geminate contrast in KM only occurs in word-initial position, we hypothesise that BOTH singleton and geminate consonants in KM can be expected to undergo domain-initial SYNTAGMATIC CV contrast enhancement by way of higher amplitude/f0 values or greater amplitude/f0 ratios. We might also argue that, in utterance-initial position, the KM word-initial singleton/geminate contrast may also be PARADIGMATICALLY enhanced via greater amplitude/f0 differences in this context as compared to that in utterance-medial position. More specifically, we expect that domain-initial strengthening effects will be most noticeable in voiceless stop tokens in which the acoustic closure duration is absent in utterance-initial position and therefore potentially perceptually indiscernible in this context. As for voiced stops and sonorants, it is predicted that contrast enhancement will be smaller, given the fact that there is clear voicing/resonance in the closure phases of the target consonant both in utterance-initial and utterance-medial positions (see Hamzah, Fletcher & Hajek Reference Hamzah, Fletcher and Hajek2016).
Word-initial consonant gemination in KM may also be associated with Stevens & Keyser's (Reference Stevens and Keyser1989, Reference Stevens and Keyser2010) theory of contrast enhancement (see also Keyser & Stevens Reference Keyser and Stevens2006). That is, the fact that non-durational acoustic correlates may potentially be more ‘performing’ in utterance-initial position could be interpreted as a diagnostic of the strengthening of these accompanying correlates that probably leads to a phonological interpretation. As mentioned earlier, Abramson (Reference Abramson, Fant, Fujisaki, Cao and Xu2004) claims that the singleton/geminate contrast in PM may entail a difference in accentuation; he speculates that the word-initial contrast may undergo transphonologisation that switches the contrast from a segmental to an accentual distinction. It is possible that the same phenomenon may take place in KM given the phonological similarities between KM and PM.
We hope that, in addition to a small number of short research papers directly associated with the current study (Hamzah Reference Hamzah, Tabain, Fletcher, Grayden, Hajek and Butcher2010; Hamzah, Fletcher & Hajek Reference Hamzah, Fletcher, Hajek, Lee and Zee2011, Reference Hamzah, Fletcher, Hajek, Cox, Demuth, Lin, Miles, Palethorpe, Shaw and Yuen2012, Reference Hamzah, Fletcher, Hajek, Hay and Parnell2014, Reference Hamzah, Fletcher, Hajek, Wolters, Livingstone, Beattie, Smith, MacMahon, Stuart-Smith and Scobbie2015; Hamzah, Hajek & Fletcher Reference Hamzah, Hajek, Fletcher, Ma, Ding and Hirst2012, Reference Hamzah, Hajek, Fletcher, Carignan and Tyler2016), this study will offer new experimental insights into the non-durational phonetics of KM and make a significant contribution to our understanding of KM as well as to the field of acoustic phonetics dealing with a relatively under-investigated phonological feature such as word-initial consonant gemination.
2 Method
2.1 Materials and speakers
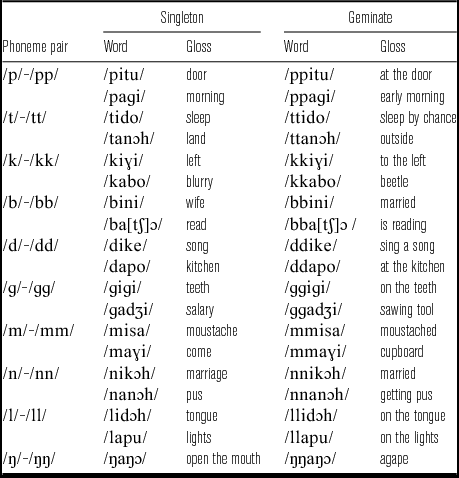
An acoustic phonetic experiment was designed to investigate non-durational correlates of word-initial singletons and geminates in KM. A list of 38 tokens was prepared consisting of nineteen minimal pairs, as presented in Table 2.
The KM tokens beginning with singleton consonants (second column) and geminate consonants (fourth column). The glosses are shown next to the tokens.

It can be seen that all tokens were disyllabic words with either C(C)VCV or C(C)VCVC structures. Twenty phonemes were chosen and they were grouped according to voicing profile and manner of articulation: voiceless stops (/p/–/pp/, /t/–/tt/, /k/–/kk/); voiced stops (/b/–/bb/, /d/–/dd/, /ɡ/–/ɡɡ/); and sonorants (/m/–/mm/, /n/–/nn/, /ŋ/–/ŋŋ/, /l/–/ll/). Each phoneme was followed by two distinct vowels: the high front vowel /i/ and the low central vowel /a/, except /ŋ/–/ŋŋ/ (low back vowel /a/ only). All tokens were high-frequency words and well known to the participants. The target phonemes represent word-initial singletons and geminates in KM that occur across all manners and places of articulation, with the exception of the two glides (i.e. /w/–/ww/ and /j/–/jj/), fricatives and affricates, which are also contrastive in this variety. It is worth mentioning that consonant gemination in KM has both grammatical and lexical functions, as can be seen in the singleton/geminate word pairs in Table 2.
The participants were sixteen native speakers of KM (eight males, eight females) whose ages ranged from 20 to 28 years (mean age: 22.4 years). Six of them were students from several universities in Melbourne, Australia, and ten were students from Universiti Malaysia Kelantan located in the state of Kelantan, Malaysia. All of the participants were born and raised in Kelantan, Malaysia.
2.2 Data collection
For the speakers in Melbourne, the experimental materials were recorded individually in a professional recording studio at the Horwood Language Centre located on the main campus of the University of Melbourne. As for the speakers in Kelantan, they were recorded individually in a quiet room at Universiti Malaysia Kelantan. In all sessions, speakers were asked to repeat each token in two different contexts: (i) in isolation, i.e. utterance-initial position; and (ii) in a carrier sentence, i.e. utterance-medial position. In the first context, the target word was preceded by a long silent pause, while in the second context, the target word was preceded by a vowel. The carrier sentence was: /diɔ katɔ (the target word) tigɔ kali/ ‘he said (the target word) three times’.Footnote 8 We are aware that, although in principle utterance-initial tokens were spoken in isolation, our auditory impressions of the two utterance contexts suggest that speakers were producing laboratory-style speech for both utterance types without undue listing effects or obvious citation-form hyperarticulation. As for the utterance-medial context, we ensured that speakers practised reading the materials without pausing before the experimental tokens. The carrier sentences were not particularly long and auditory analysis by the first author confirmed that speakers were able to produce them fluently. Speakers were also able to repeat utterances if they stumbled or hesitated during the recordings.
All experimental tokens were presented in randomised order using a powerpoint presentation on a computer. The carrier sentence was written separately on a piece of A4 paper. Since there is no written counterpart of KM, Standard Malay orthography was used although the speakers were required to produce the KM equivalent. The speakers were seated about 20 cm from an omni-directional microphone. The tokens were presented six times, each time in a different random order. The speakers were reminded to read them at their normal comfortable rate of speech. They were first trained to say a few tokens in succession and to use a natural falling intonation (i.e. declarative intonation in KM). Stress was not controlled in the stimulus set since it is not contrastive in KM as well as in Standard Malay (e.g. Karim Reference Karim1965), although further experimental work on stress is required to confirm this claim. Both utterance contexts placed the experimental tokens in informational focus so this was not an experimental variable in this study. Two hundred and twenty-eight utterances were recorded from each speaker in both contexts, yielding 7,296 utterances. The experiment took approximately one and a half hours for each speaker. They were compensated financially for their participation in the experiment.
2.3 Data analysis
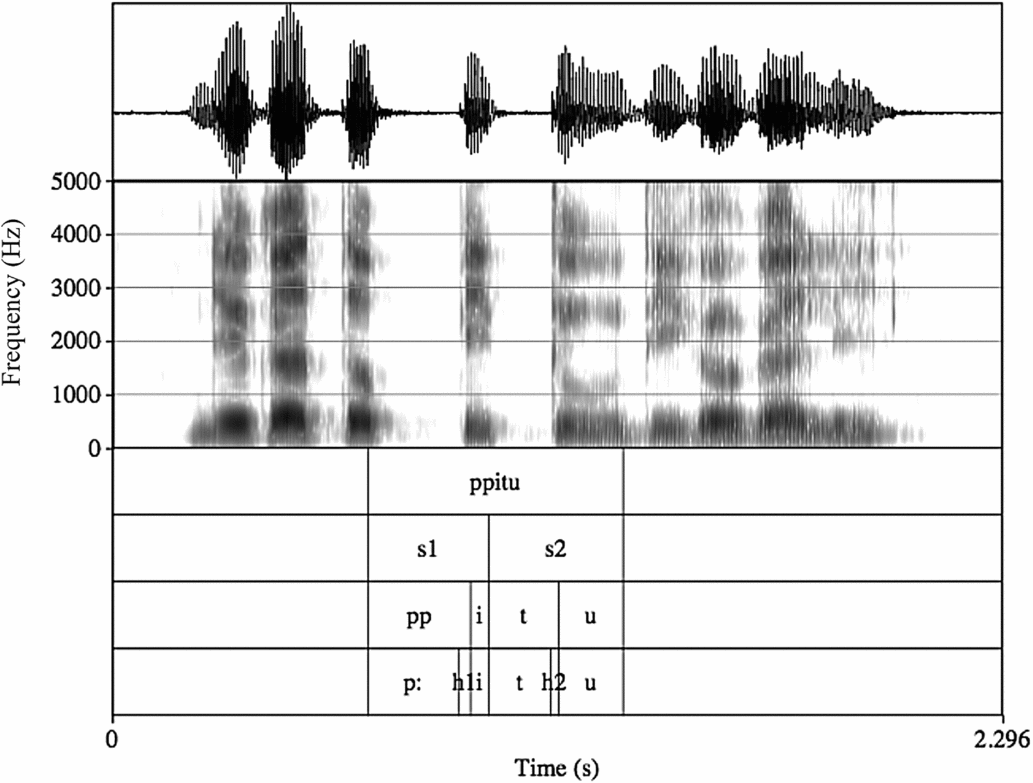
The waveform files were digitised at 44.1 kHz, segmented into single utterances for each participant and then coded accordingly. The segmentation and annotation were conducted using Praat version 5.1.11 (Boersma Reference Boersma2001) in which segmental boundaries were determined manually based on visual inspection of simultaneous spectrographic and waveform displays. The annotation criteria for singleton/geminate tokens beginning with voiceless stops, voiced stops and sonorants were established by following standard segmentation and labeling procedures taken from several studies (e.g. Croot & Taylor Reference Croot and Taylor1995). On the basis of these segmental annotations, four tiers were derived in the Praat TextGrid (see Figure 1).
Illustration of annotated waveform and spectrogram in the Praat TextGrid for the male speaker, MS8, /ppitu/ ‘at the door’ in utterance-medial position, showing four major annotation tiers (see text for details).

As can be observed in Figure 1, the word tier (top tier) shows the segmentation and labeling of the target word (i.e. /ppitu/). The syllable tier (second tier) highlights the syllables in a disyllabic word: (i) ‘s1’ refers to the initial syllable (C(C)V), while (ii) ‘s2’ refers to the final syllable (CV(C)). The underlying tier (third tier) represents the phonemic representation of the target word (i.e. /ppitu/), and the surface tier (bottom tier) is the phonetic representation of the target word (i.e. [pːitu]). [h1] and [h2] represent the release portions of the stops [pː] and [t], respectively. Note that vowel onset amplitude/f0 values (described in detail in the following subsections) were taken for the interval marked as /i/ in the third tier in Figure 1, while amplitude/f0 ratio values were extracted from the intervals marked as /i/ and /u/ in the same tier.
Non-durational values were extracted using the Emu-tkassp routine in the Speech Signal Analysis tools that are part of EMU Speech Database System version 2.3.0 (e.g. Harrington Reference Harrington2010) and an open source programming language R version 3.3.1 (R Development Core Team 2013). The Praat TextGrids, shown in Figure 1, were converted to EMU labels using ‘Convert Tools’ (i.e. ‘Praat 2 Emu’). Template files were created for individual speakers and data type (i.e. utterance-initial and utterance-medial tokens). The speech signal analysis suite in EMU was employed to extract the RMS amplitude (i.e. ‘rmsana’) using a Blackman window with a window shift of 5 ms and a window size of 25 ms. As for f0, this signal was extracted using the pitch tracker application ‘f0ana’ in EMU based on the Schaefer-Vincent (Reference Schaefer-Vincent1983) periodicity detector, with a minimum f0 of 50 Hz, a maximum of 500 Hz and a frame shift of 5 ms.
After extracting relevant signals for analysis, hierarchies were automatically built in which the labels on each tier were linked according to their hierarchical relationship within the Hierarchy View. Values of non-durational acoustic parameters were extracted and measured via the EMU-R interface using specific measurement points in the hierarchy. The details of these measurements are given in the following subsections.
2.3.1 Vowel amplitude
RMS values, calculated in dB, were measured just after vowel onset, i.e. within 0.1 of the vowel following the singleton/geminate consonant contrast. The vowel type was either the high front vowel /i/ or the low central vowel /a/. The RMS values were measured after each target consonant in each utterance position (i.e. utterance-initial and utterance-medial positions). Previous studies (e.g. House & Fairbanks Reference House and Fairbanks1953, Ohde Reference Ohde1984) have shown that the influence of the preceding consonant tends to take place in the early part of the following vowel, as mentioned earlier in Section 1.4. Therefore, all the measurements of vowel amplitude, as well as vowel f0, in this study were extracted at the onset of the following vowel.
2.3.2 Vowel f0
f0 values were calculated in hertz (Hz) and obtained using EMU-R at 0.1 into the vowel following the target consonant across the whole corpus. A small number of tokens were produced with missing f0 values at the vowel onset point, which was mostly due to (i) creaky voice and, (ii) in the case of one speaker (FS8), occasional full or partial devoicing of voiced stop geminates.Footnote 9 All tokens in both categories were excluded from the vowel f0 analysis. The number of tokens included in the analyses is reported in the results section. These vowel f0 measurements, together with the vowel amplitude measurements, would help determine whether post-consonantal vocalic information (i.e. in terms of intensity and f0) could potentially contribute to the enhancement of the preceding consonant contrast. We were aware, of course, that these raw measurements of RMS and f0 values might be tampered by intra- and inter-speaker variance (e.g. distance from the microphone, gender differences, speakers’ loudness). We hope that ratio measurements (as described in the following subsection) would minimise these influences.
2.3.3 Inter-syllabic differences
The relative amplitude and f0 between the first and second syllables of all disyllabic tokens were measured across the whole corpus. Following Abramson (Reference Abramson, Warotamasikkhadit and Panakul1998), amplitude ratios were obtained by dividing the RMS amplitude at the 0.1 time point after vowel onset in the first syllable with that in the second syllable, while the ratio of vowel onset f0 in the first syllable relative to that in the second syllable was also obtained. We, however, did not take into account the intrinsic differences between vowel qualities in the first and second syllables that could influence the ratio results. Based on these measurements, the potential inter-syllabic differences are schematically illustrated in Figure 2.
Schematics of potential differences in the RMS amplitude and f0 values across two syllables, showing ratios in values above 1 (left) and values below 1 (right). ‘S1’ and ‘S2’ refer to the first and second syllables, respectively.

As shown, values above 1 (left), potentially associated with geminate production (as shown in PM; see Abramson Reference Abramson, Warotamasikkhadit and Panakul1998), would imply that the first syllable containing the target consonant was produced with greater RMS amplitude or higher f0 values than the second syllable. On the other hand, values below 1 (right), potentially associated with words beginning with singletons, would suggest that there was a lower level of energy or pitch in the initial syllable (where the target consonant was located) as compared to the following syllable.
2.4 Statistical analyses
A total of five acoustic phonetic parameters (i.e. vowel onset amplitude, vowel onset f0 for males, vowel onset f0 for females, relative amplitude and relative f0) were submitted to several maximally specified linear mixed-effects models (Baayen, Davidson & Bates Reference Baayen, Davidson and Bates2008) using the lmerTest package in the statistical environment R (R Development Core Team 2013, Kuznetsova, Brockhoff & Christensen Reference Kuznetsova, Brockhoff and Christensen2016) to investigate the influence of a range of factors on amplitude (dB) and f0 (Hz). Each best-fit model had three fixed factors: LENGTH (singleton and geminate), POSITION (utterance-initial and utterance-medial) and MANNER (voiceless stop, voiced stop and sonorant) and two fixed-effects interactions LENGTH and POSITION, LENGTH and MANNER. In each model, we had random effects for Speaker (16 speakers) with by-slope and intercept calculated with respect to the fixed factors. The inclusion of Speaker as a random factor (i.e. using the lmerTest notation ‘(LENGTH+POSITION+MANNER|SPEAKER)’ in the models) controlled for individual variation among speakers with regard to potential differences in speech rate and other sources of speaker-specific variability (see Appendix A for the mixed-effects model formulae). Repetition was not included as a factor in these models as this was shown in earlier iterations not to be a significant factor. Dummy coding was used in the models and the baselines for each model were as follows: LENGTH (singleton), POSITION (utterance-medial), MANNER (sonorant). Significance of fixed-effects interactions, which was set at p < .05, were further verified via model comparison (Piccinini & Arvaniti Reference Piccinini and Arvaniti2015).
In the overall results sections for each parameter, we first report summary statistics (Tables 3, 7, 13) and results of the linear mixed-effects models and summary of coefficients for each fixed factor (Tables 4, 8, 9, 14, 15). Post-hoc Multiple Comparisons of Means using the glht function in R and Tukey tests were also used to investigate any significant interactions between LENGTH and POSITION, and also LENGTH and MANNER, in each model. The summary statistics (i.e. z scores and significance values) presented in Tables 3, 5, 6, 7, 10, 11, 12, 13, 16, 17 and 18 are the results from a series of Post-hoc Multiple Comparisons of Means using the glht function in R and Tukey tests from respective mixed-effects models. An experiment-wide correction was not conducted since Tukey tests adjusted the p-values for multiple testing and, therefore, the family-wise error rate was controlled. Following the standard shown in R (see also Arnhold Reference Arnhold2016), the significance levels are coded as follows: *** = p < .001, ** = p < .01, * = p < .05, . = p < .1.
Number of tokens, mean RMS amplitude values (dB), standard deviations, a mean difference and post-hoc Tukey test results for vowel onset amplitude after singletons and geminates across the entire corpus.

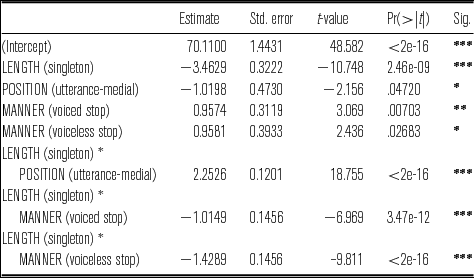
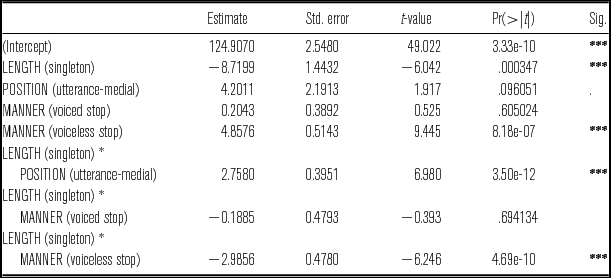
Coefficients of the best linear mixed-effects model of vowel onset amplitude (dB) with fixed factors LENGTH (singleton and geminate), POSITION (utterance-initial and utterance-medial), MANNER (voiceless stop, voiced stop and sonorant) and all interactions. Speaker was a random factor.

Number of tokens, mean RMS amplitude values (dB), standard deviations, mean differences and post-hoc Tukey test results for vowel onset amplitude after singletons and geminates according to utterance position.

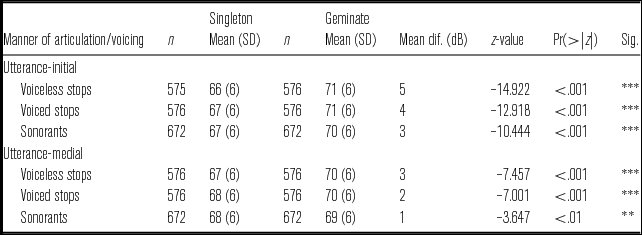
Number of tokens, mean RMS amplitude values (dB), standard deviations, mean differences and post-hoc Tukey test results for vowel onset amplitude after singletons and geminates according to manner of articulation/voicing and utterance position.

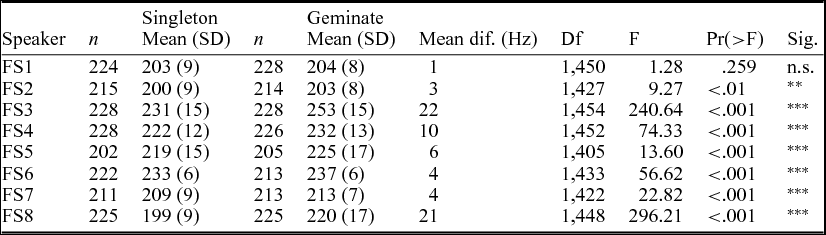
Number of tokens, mean f0 values (Hz), standard deviations, mean differences and post-hoc Tukey test results for vowel onset f0 after singletons and geminates across the entire corpus.

Coefficients of the best linear mixed-effects model of vowel onset f0 (Hz) produced by male speakers with fixed factors LENGTH (singleton and geminate), POSITION (utterance-initial and utterance-medial), MANNER (voiceless stop, voiced stop and sonorant) and all interactions. Speaker was a random factor.

Coefficients of the best linear mixed-effects model of vowel onset f0 (Hz) produced by female speakers with fixed factors LENGTH (singleton and geminate), POSITION (utterance-initial and utterance-medial), MANNER (voiceless stop, voiced stop and sonorant) and all interactions. Speaker was a random factor.

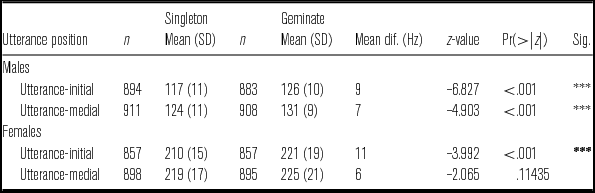
Number of tokens, mean f0 values (Hz), standard deviations, mean differences and post-hoc Tukey test results for vowel onset f0 after singletons and geminates according to utterance position.

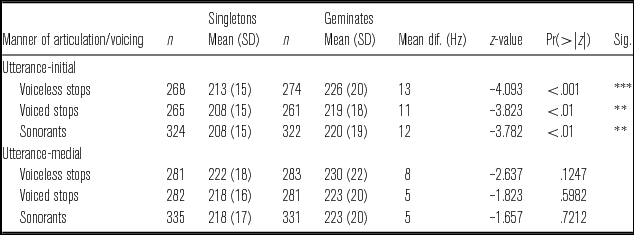
Number of tokens, mean f0 values (Hz), standard deviations, mean differences and post-hoc Tukey test results for vowel onset f0 after singletons and geminates produced by male speakers according to manner of articulation/voicing and utterance position.

Number of tokens, mean f0 values (Hz), standard deviations, mean differences and post-hoc Tukey test results for vowel onset f0 after singletons and geminates produced by female speakers according to manner of articulation/voicing and utterance position.

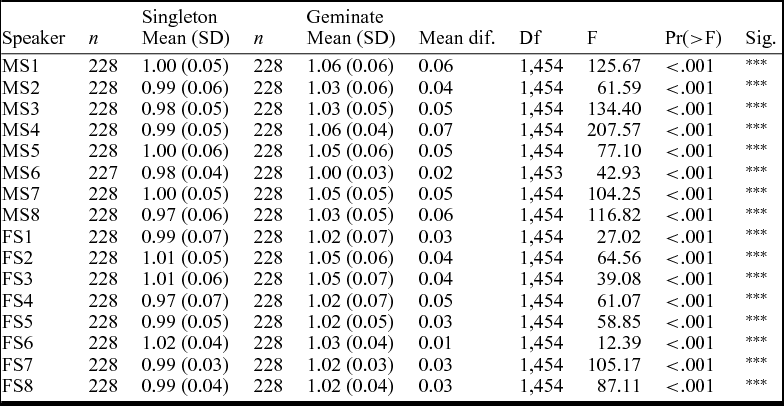
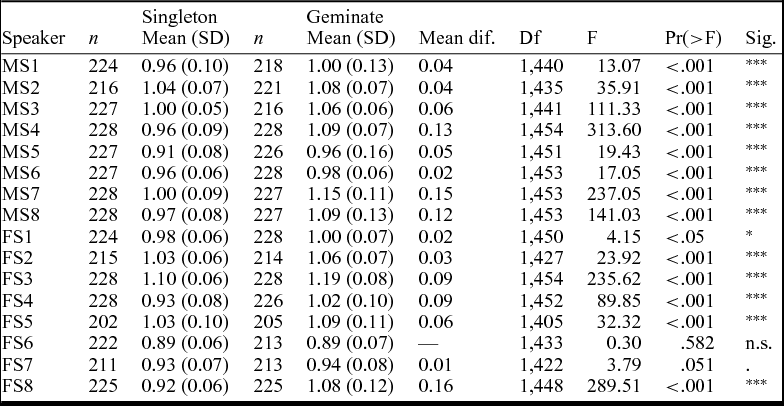
Number of tokens, mean amplitude and f0 ratios, standard deviations, mean differences and post-hoc Tukey test results for ratios of the first and second syllables of disyllabic words beginning with singletons and geminates averaged across the entire corpus.

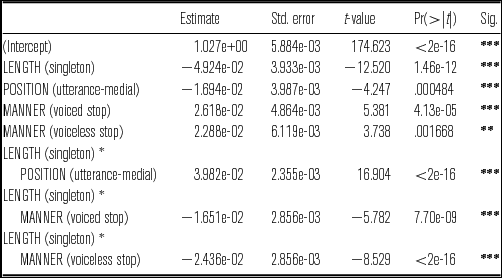
Coefficients of the best linear mixed-effects model of AMPLITUDE RATIOS with fixed factors LENGTH (singleton and geminate), POSITION (utterance-initial and utterance-medial), MANNER (voiceless stop, voiced stop and sonorant) and all interactions. Speaker was a random factor.

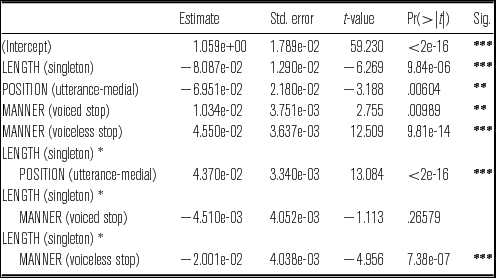
Coefficients of the best linear mixed-effects model of f0 ratios with fixed factors LENGTH (singleton and geminate), POSITION (utterance-initial and utterance-medial), MANNER (voiceless stop, voiced stop and sonorant) and all interactions. Speaker was a random factor.

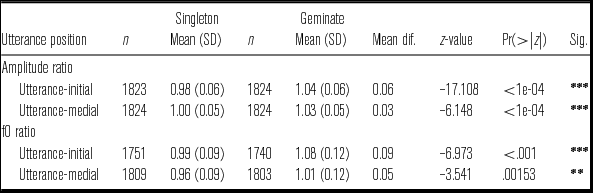
Number of tokens, mean amplitude and f0 ratios, standard deviations, mean differences and post-hoc Tukey test results for ratios of the first and second syllables of disyllabic words beginning with singletons and geminates according to utterance position.

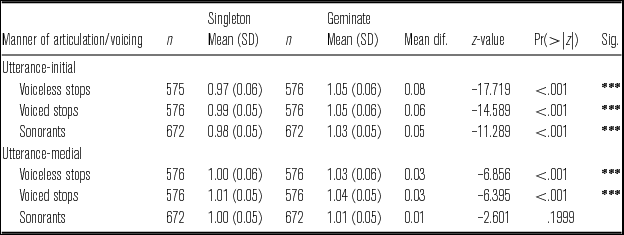
Number of tokens, mean amplitude ratios, standard deviations, mean differences and post-hoc Tukey test results for ratios of the first and second syllables of disyllabic words beginning with singletons and geminates according to manner of articulation/voicing and utterance position.

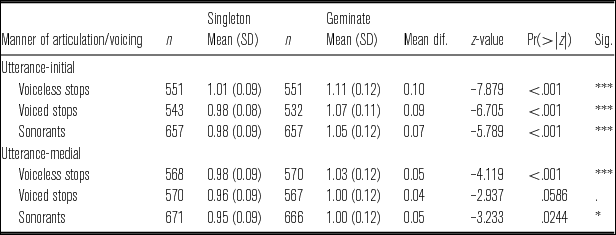
Number of tokens, mean f0 ratios, standard deviations, mean differences and post-hoc Tukey test results for ratios of the first and second syllables of disyllabic words beginning with singletons and geminates according to manner of articulation/voicing and utterance position.

3 Results
3.1 Vowel onset amplitude
3.1.1 Overall results
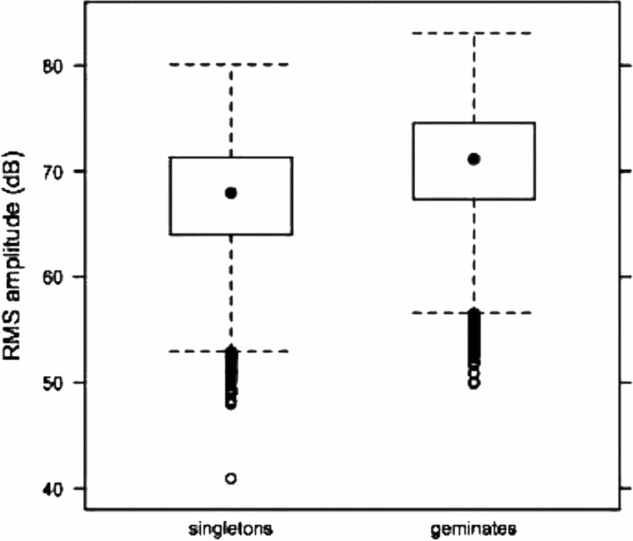
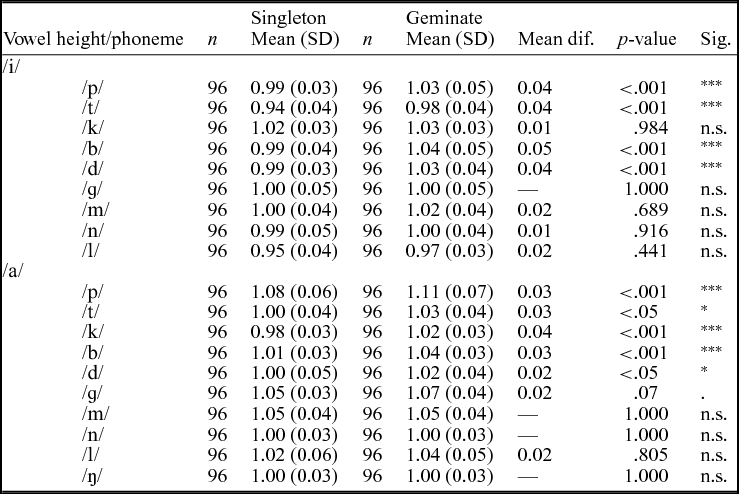
The overall results for vowel onset amplitude are illustrated in the boxplots in Figure 3, showing a combined simplified distribution and outliers for RMS amplitude values at vowel onset after singletons and geminates. Table 3 provides the detailed measurements and post-hoc Tukey test results.
Distribution of RMS amplitude values (dB) at vowel onset after singletons (left boxplot) and geminates (right boxplot) across the entire corpus. Data are collapsed across manners of articulation/stop types (voiceless stops, voiced stops and sonorants) and utterance positions (utterance-initial and utterance-medial positions). The middle box represents the middle 50% of RMS amplitude values for each consonant category, while the dot inside the box marks the median/middle quartile of the data. The upper and lower whiskers represent values outside the middle 50%.

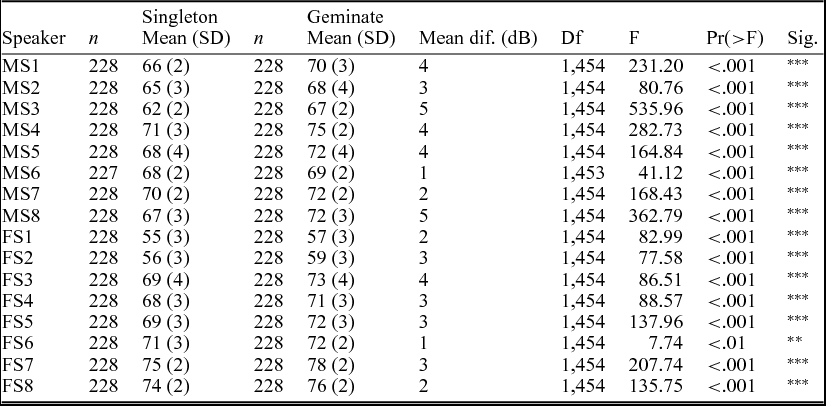
It can be observed that there are different distributions of RMS amplitude values for singletons and geminates: the geminate boxplot (right) is higher than the singleton plot (left), indicating a contrast between singletons and geminates in terms of vowel onset amplitude, with the RMS amplitude in the geminate environment being 3 dB higher (z = –10.14, p < .001) than that in the singleton environment (see Table 3). This difference, whilst small, is significant enough to be considered as perceptually relevant; the suggested JND value for the perception of differences in intensity is 3 dB, as proposed by Toole & Olive (Reference Toole and Olive1988). A further examination of the individual speaker data indicates that all speakers show significantly higher RMS amplitude values at vowel onset after geminates than after singletons, with MS3 and MS8 marking the length contrast with the largest amplitude difference (i.e. 5 dB, p < .001) (see Appendix B for full speaker-specific results). Note also that there is greater variability in the RMS amplitude data, as noticeably evidenced by the clustering of outliers below the lower whiskers in both singleton and geminate boxplots in Figure 3.
A maximally specified mixed-effects model was fitted to the vowel onset amplitude data. Table 4 summarises the coefficients of this model for the main effects LENGTH, POSITION, MANNER and interactions.
As shown, vowel onset amplitude varies significantly according to consonant length, utterance position and manner of articulation/voicing type. The results of likelihood ratio tests (using model comparison) confirm the significant interaction between LENGTH and POSITION (χ2 = 343.59, p < .001), i.e. the contrast magnitude in terms of vowel onset amplitude is larger in utterance-initial position. Similarly, model comparison reveals that the interaction between LENGTH and MANNER is significant (χ2 = 103.13, p < .001), i.e. the size of contrast is larger for voiceless stops. A detailed investigation of these effects will be presented in the next two subsections.
3.1.2 Vowel onset amplitude: Utterance position effects
The mean RMS values at vowel onset after singletons and geminates according to utterance position are illustrated in Figure 4 and summarised in Table 5.
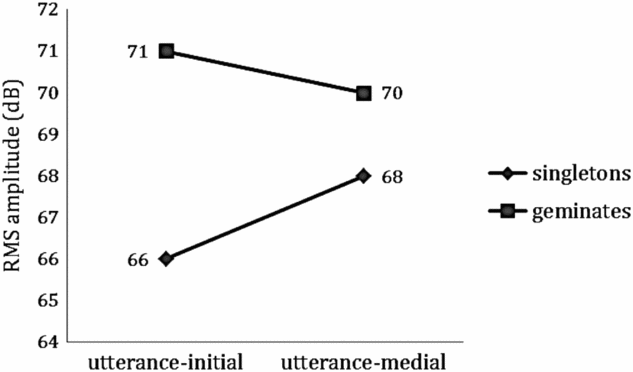
Mean RMS amplitude values (dB) at vowel onset after singletons and geminates according to utterance position: utterance-initial (left) and utterance-medial (right) positions. Data are collapsed across manners of articulation/stop types (i.e. voiceless stops, voiced stops and sonorants).

It can be observed in Figure 4 that there are clear mean RMS amplitude differences between singletons and geminates in both utterance positions, with the mean values being always significantly greater (all p < .001) after geminates than after singletons (see Table 5). However, the degree of contrast between singletons and geminates in terms of vowel onset amplitude is larger in utterance-initial position (5 dB, z = –13.533, p < .001) than in utterance-medial position (2 dB, z = –6.334, p < .001). Interestingly, contrast enhancement shown in utterance-initial position is due primarily to a slight fall in amplitude after singletons: post-hoc Tukey test comparisons show that there is a lowering of RMS values from 68 dB in utterance-medial position to 66 dB in utterance-initial position, a significant difference of 2 dB (z = 2.605, p = .0325). As for geminates, the RMS values do not deviate markedly across utterance positions and the RMS difference is only reaching significance (z = –2.154, p = .0987). The next subsection will elaborate details of manner of articulation/voicing effects underlying this pattern.
3.1.3 Vowel onset amplitude: Manner of articulation/voicing effects
The results showing the distribution of RMS amplitude values in each manner of articulation/stop type can be observed in Figure 5. Detailed measurements and summary statistics are provided in Table 6.
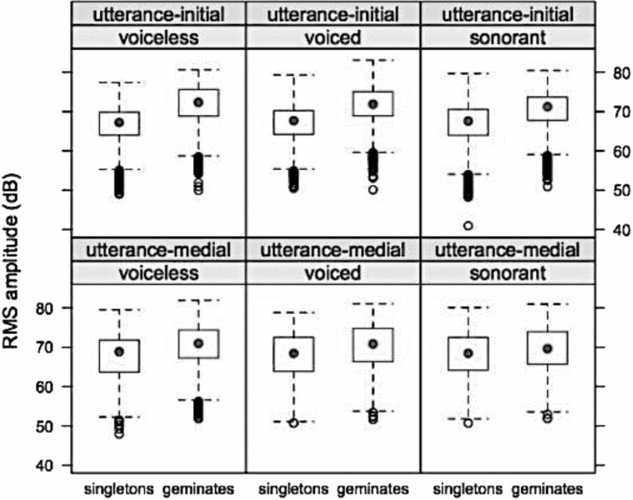
Distribution of RMS amplitude values (dB) at vowel onset after singletons and geminates according to manner of articulation/voicing and utterance position: voiceless stops (left column), voiced stops (middle column) and sonorants (right column). Utterance-initial tokens are provided in the upper panel, while utterance-medial tokens in the lower panel. The middle box represents the middle 50% of RMS amplitude values for each consonant category, while the dot inside the box marks the median/middle quartile of the data. The upper and lower whiskers represent values outside the middle 50%.

It can be seen in Figure 5 that, for all consonant types, the boxplots for geminates are higher than those for singletons. As shown in Table 6, the mean RMS differences between singletons and geminates are all significant (at least p < .01) across manners of articulation/stop types and utterance positions, with geminates always associated with significantly greater RMS values at the onset of the following vowel. The effect is particularly strong in the case of voiceless stops in which the mean RMS differences between singletons and geminates are largest across utterance positions (i.e. utterance-initial = 5 dB, z = –14.922; utterance-medial = 3 dB, z = –7.457, both p < .001). This finding explains the significant interaction between Length and Manner of Articulation/Voicing (p < .001), as reported earlier. As for voiced stops and sonorants, the degrees of contrast between singletons and geminates are reduced somewhat, especially in utterance-medial position where the mean RMS differences do not reach the suggested JND value of 3 dB, although they are still significant (i.e. voiced stops = 2 dB, z = –7.001, p < .001; sonorants = 1 dB, z = –3.647, p < .01). Note also the distributions of outliers in utterance-initial position (the upper panel in Figure 5), which are highly clustered across the board in the lower whiskers of the boxplots. As also demonstrated earlier in the overall results section (see Figure 3), these outliers indicate variability in the RMS amplitude data across consonant types, particularly in the utterance-initial environment.
3.2 Vowel onset f0
3.2.1 Overall results
The overall results for vowel onset f0 are presented in Figure 6, showing the distribution of f0 values at vowel onset after singletons and geminates for male (left) and female (right) speakers.Footnote 10 The detailed measurements and summary statistics are provided in Table 7.
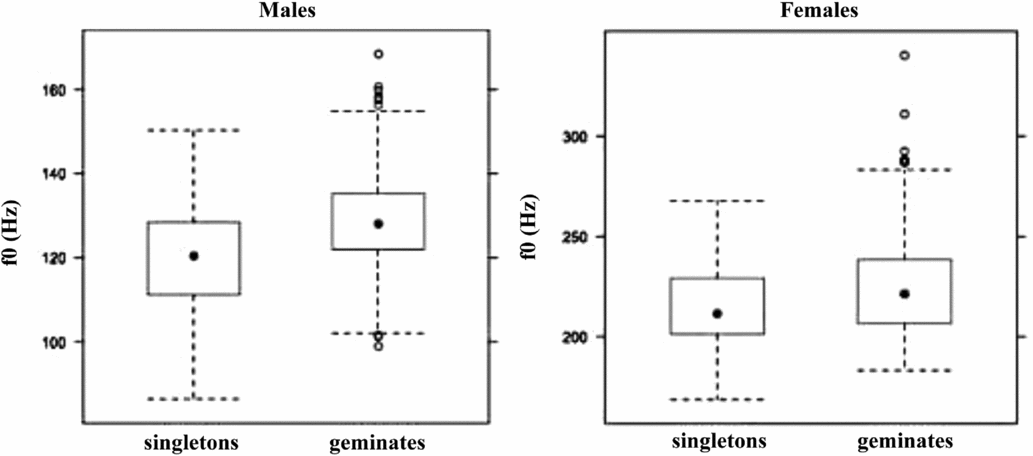
Distribution of f0 values (Hz) at vowel onset after singletons and geminates across the entire corpus, showing results for male (left) and female (right) speakers. Data are collapsed across manners of articulation/voicing types (voiceless stops, voiced stops and sonorants) and utterance positions (utterance-initial and utterance-medial positions). The middle box represents the middle 50% of f0 values for each consonant category, while the dot inside the box marks the median/middle quartile of the data. The upper and lower whiskers represent values outside the middle 50%.

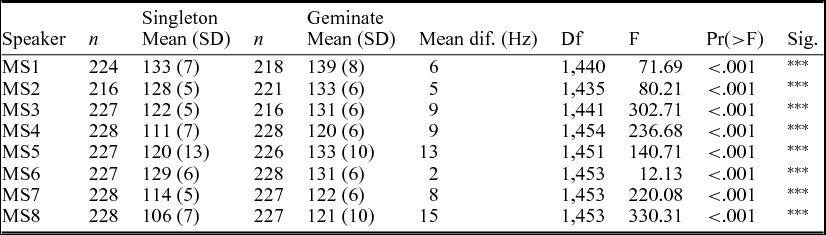
It can be observed in Figure 6 that the boxplots for geminates are higher than those for singletons, indicating that vowel onset f0 is differentiated in terms of the singleton/geminate contrast for both male and female speaker data sets. As shown in Table 7, the mean f0 differences that specify the preceding consonant contrast are about the same between males (9 Hz, z = –5.909, p < .001) and females (8 Hz, z = –3.009, p = .00262), although the level of significance is higher for the former than the latter. In each case, f0 values at vowel onset are significantly higher (at least p < .01) after geminates than after singletons, although the mean f0 differences between singletons and geminates are relatively small, i.e. they are only reaching the suggested JND value for frequency, which is around 10 to 15 Hz depending on frequency regions (e.g. Klatt Reference Klatt1973). Note the higher SD values in the female speaker data for both singletons (17 Hz) and geminates (20 Hz), suggesting greater variability of f0 values among female speakers in comparison to male speakers. Results of individual speakers, in general, show that higher mean f0 values are always associated with geminates across participants, with the largest f0 contrast being exhibited by MS8 (15 Hz, p < .001) for male speakers and FS3 (22 Hz, p < .001) for female speakers. The effect, however, was not significant for one female speaker (FS1). See Appendix C for full speaker-specific results.
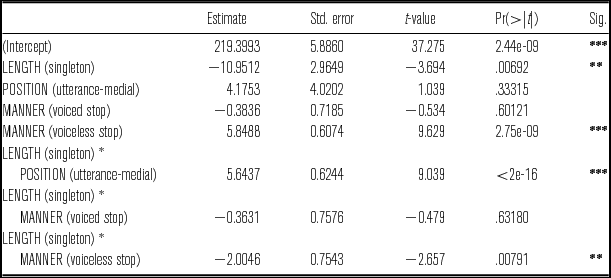
A separate mixed-effects model was applied to the f0 data for male and female speakers, respectively, for the main effects LENGTH, POSITION, MANNER and interactions (see Tables 8 and 9).
The statistical results, as displayed in Tables 8 and 9, indicate that vowel onset f0 differs according to consonant length and manner/stop type, but not according to utterance position. However, the results of likelihood ratio tests (using model comparison) indicate that there is a significant interaction between LENGTH and POSITION for both male (χ2 = 48.453, p < .001) and female (χ2 = 80.857, p < .001) data sets, i.e. f0 values are generally heightened in utterance-medial position, although the f0 differences between singletons and geminates are larger in utterance-initial position. Likewise, model comparison confirms that the interaction between LENGTH and MANNER is significant for both speaker groups (males: χ2 = 46.438, p < .001; females: χ2 = 7.7361, p < .05), i.e. f0 values at vowel onset are always greatest after voiceless stops. Detailed accounts of these results are given in the following subsections, focusing primarily on the effects of Utterance Position and Manner of Articulation/Voicing.
3.2.2 Vowel onset f0: Utterance position effects
The f0 results showing the effect of utterance position are demonstrated in Figure 7 for male (left) and female (right) speakers, respectively. Detailed measurements and summary statistics are given in Table 10.
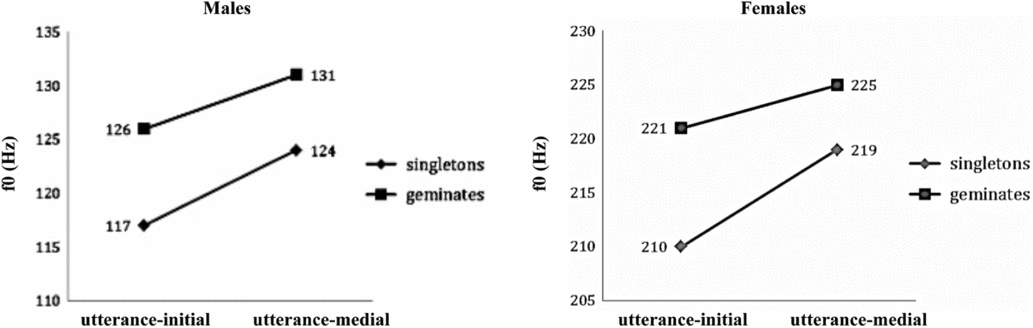
Mean f0 values (Hz) at vowel onset after singletons and geminates according to utterance position as produced by male (left) and female (right) speakers. Data are collapsed across manners of articulation/stop types (i.e. voiceless stops, voiced stops and sonorants).

It can be seen in Figure 7 that greater f0 values are always found in utterance-medial position across singletons and geminates for both speaker groups, as mentioned earlier in the overall results. However, post-hoc Tukey test comparisons indicate that the f0 differences between utterance positions are only significant for the singleton category (males: p = .00554; females: p = .04739). As for the geminate category, the f0 differences between utterance positions are non-significant (males: p = .14915; females: p = .59624). In terms of contrast magnitude, it can be observed in Figure 7 that slightly greater enhancements of f0 contrast between singletons and geminates are found in utterance-initial position for both males (9 Hz, z = –6.827, p < .001) and females (11 Hz, z = –3.992, p < .001), which explains the significant interaction between Length and Utterance Position (p < .001) noted earlier for both data sets. The degree of f0 contrast declines somewhat in the medial context for both speaker groups, with only males showing a significant f0 difference (7 Hz, z = –4.903, p < .001), while females showing a non-significant difference (6 Hz, z = –2.065, p = .11435, see Table 10). This latter result for female speakers could potentially be due to greater variability in the f0 data in utterance-medial position in both singleton (SD value = 17 Hz) and geminate (SD value = 21 Hz) environments, as also noted earlier. The next subsection, focusing on manner of articulation/voicing type, will attempt to explain this particular trend in greater detail.
3.2.3 Vowel onset f0: Manner of articulation/voicing effects
The distribution of f0 values at vowel onset after each manner of articulation/voicing type is demonstrated in Figures 8 (males) and 9 (females). Detailed measurements and summary statistics are given in Tables 11 (males) and 12 (females).
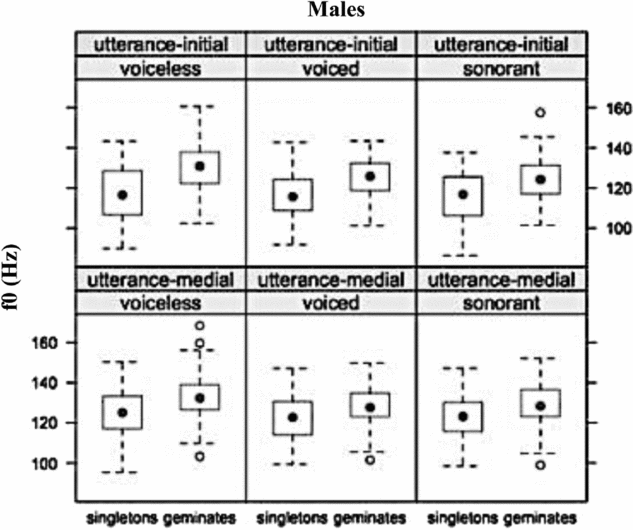
Distribution of f0 values (Hz) at vowel onset after singletons and geminates produced by male speakers according to manner of articulation/voicing and utterance position: voiceless stops (left column), voiced stops (middle column) and sonorants (right column). Utterance-initial tokens are provided in the upper panel, while utterance-medial tokens in the lower panel. The middle box represents the middle 50% of f0 values for each consonant category, while the dot inside the box marks the median/middle quartile of the data. The upper and lower whiskers represent values outside the middle 50%.

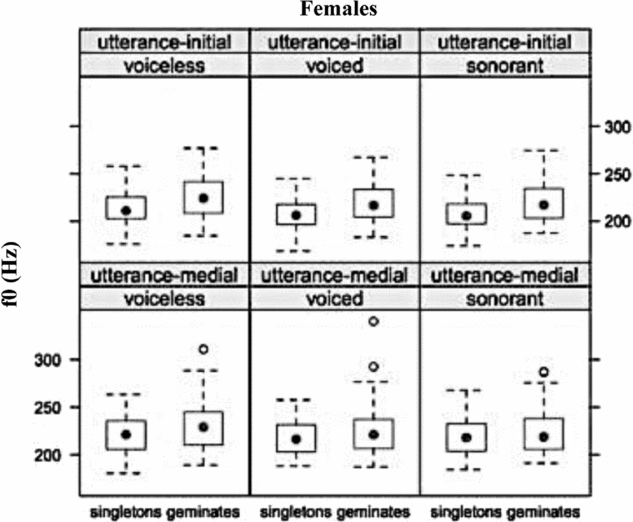
Distribution of f0 values (Hz) at vowel onset after singletons and geminates produced by female speakers according to manner of articulation/voicing and utterance position: voiceless stops (left column), voiced stops (middle column) and sonorants (right column). Utterance-initial tokens are provided in the upper panel, while utterance-medial tokens in the lower panel. The middle box represents the middle 50% of f0 values for each consonant category, while the dot inside the box marks the median/middle quartile of the data. The upper and lower whiskers represent values outside the middle 50%.

It can be observed in Figures 8 and 9 that the boxplots for geminates are generally higher than those for singletons. With the exception of the female speaker data in utterance-medial position (see below), the mean f0 values are always significantly greater (at least p < .01) after geminates than after singletons across manners of articulation/voicing for both speaker groups, although the mean f0 differences are relatively small. The significant interaction between Length and Manner of Articulation/Voicing (p < .001), as mentioned earlier, can be accounted for by the f0 patterns after voiceless stops: the magnitudes of f0 contrast are reinforced more substantially after this particular stop type, which is consistent across utterance positions and speaker groups. As for voiced stops and sonorants, the mean f0 differences are smaller and are about the same across these two manner categories, particularly for the female speaker data in utterance-medial tokens (see Table 12). Note that, in this context (i.e. utterance-medial tokens for female speakers), the f0 differences between singletons and geminates are all non-significant across consonant groups, including voiceless stops. In addition, the f0 data is also more variable for female speakers in utterance-medial position (i.e. with higher SD values), resulting in the overall heightened variability in this particular environment, as emphasised earlier in the overall results.
3.3 Inter-syllabic differences
3.3.1 Overall results
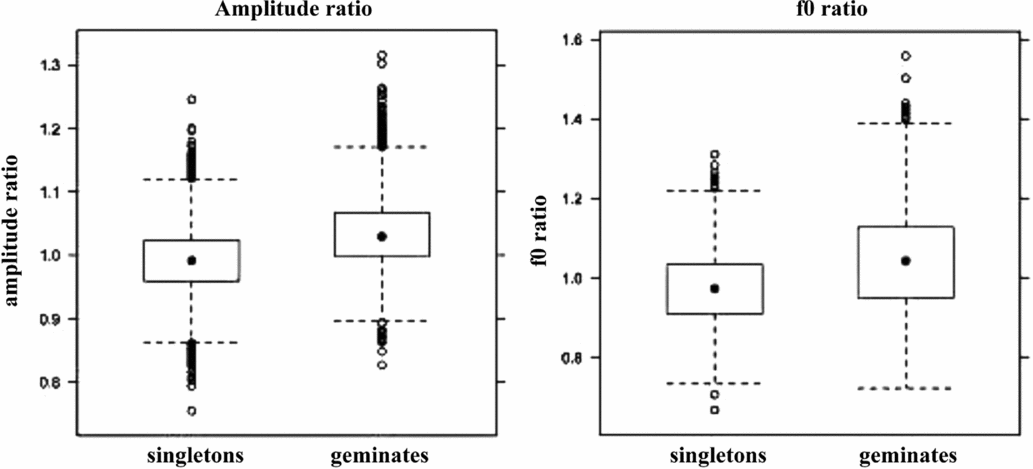
The overall results for inter-syllabic differences are demonstrated in Figure 10, showing a combined simplified distribution and outliers for amplitude ratio (left) and f0 ratio (right). Detailed measurements and summary statistics are presented in Table 13.
Distribution of ratios of the first and second syllables of disyllabic words beginning with singletons and geminates averaged across the entire corpus: amplitude ratio (left) and f0 ratio (right). Data are collapsed across manners of articulation/voicing types (voiceless stops, voiced stops and sonorants) and utterance positions (utterance-initial and utterance-medial positions). The middle box represents the middle 50% of ratio values for each consonant category, while the dot inside the box marks the median/middle quartile of the data. The upper and lower whiskers represent values outside the middle 50%.

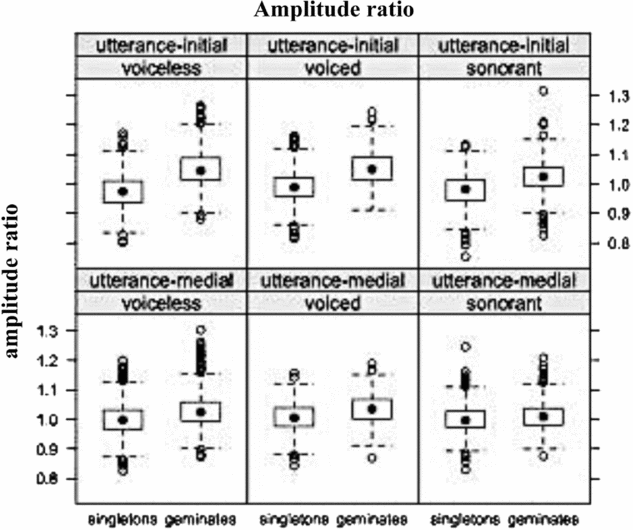
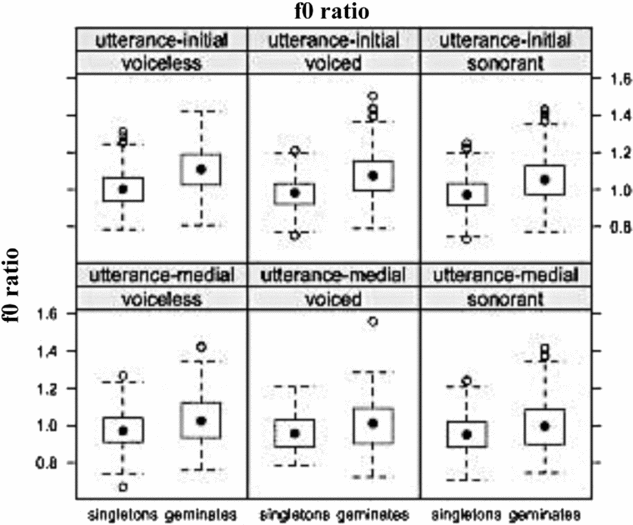
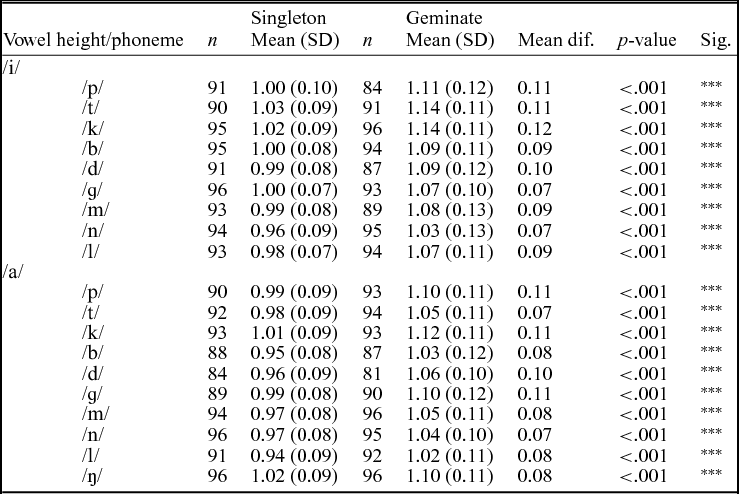
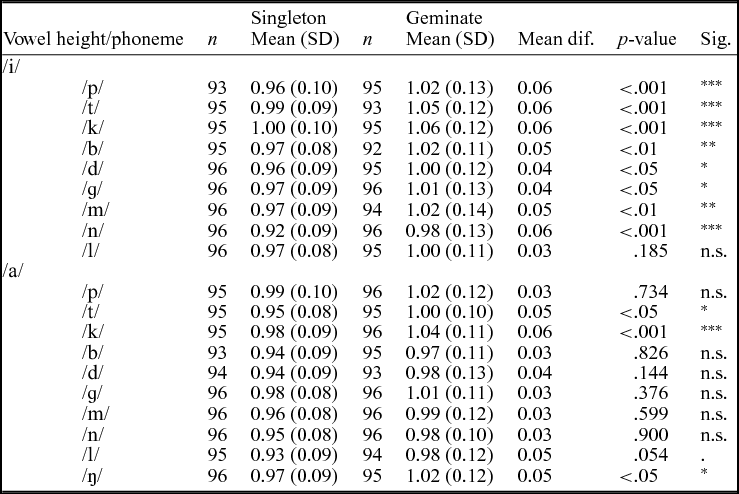
In general, it can be seen in Figure 10 that there are different distributions of ratio values for singletons and geminates, indicating that both amplitude and f0 ratios differ according to the consonant contrast. That is, the boxplots for geminates are higher than those for singletons. Post-hoc Tukey test results, shown in Table 13, indicate that there are significantly higher ratios (p < .001) in the geminate context than in the singleton context across both ratio types. Although the overall mean ratio differences between singletons and geminates are relatively small (i.e. amplitude ratio = 0.04, z = –12.34; f0 ratio = 0.07, z = –5.272, both p < .001), as expected, these two parameters appear to work together to give a greater acoustic salience to the first syllable of words beginning with geminate consonants. Under the singleton column in Table 13, both ratio types show values below 1 in the mean ratios, indicating a lower level of amplitude and f0 in the first than in the second syllable of words beginning with singletons. On the contrary, the values for the mean ratios of words beginning with geminates are above 1, suggesting that, in this context, the level of amplitude and f0 is higher in the first syllable than in the second syllable.
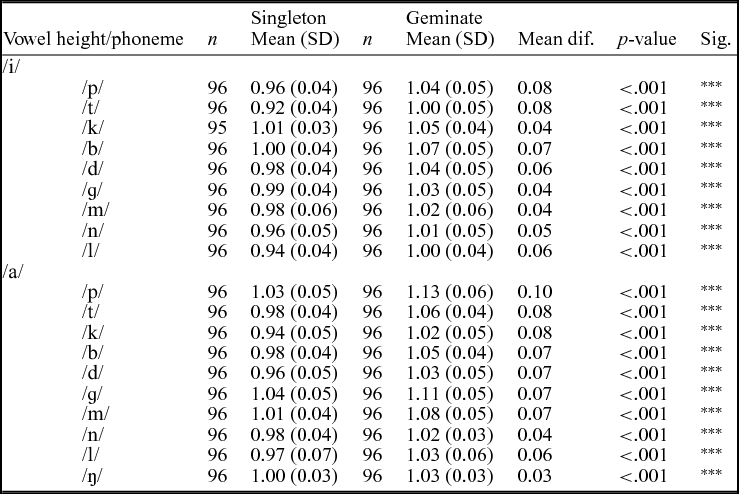
A separate analysis of the individual speaker data reveals that, for amplitude ratio, there are significant differences in the mean ratios separating singletons and geminates across all speakers, with the largest difference being exhibited by MS4 (0.07, p < .001). As for f0 ratio, the analysis shows that significant ratio differences are generally shown by most speakers to designate the consonant contrast, with FS8 displaying the strongest effect (0.16, p < .001). Only two speakers (FS6, FS7) show no effect (full speaker-specific results for amplitude ratio and f0 ratio are provided in Appendix D). In addition, a closer inspection into vowel-specific results shows that there is no clear pattern with regard to the role of vowel height on the amplitude and f0 ratio results. That is, the differences between singletons and geminates may not be due to differences in vowel qualities. For full vowel-specific results, see Appendix E (amplitude ratio) and Appendix F (f0 ratio).
With respect to a contour shape (Figure 2 in Section 2.3 above), the observed values below 1 can be inferred as a pattern for words with singletons that exhibit a RISING pattern in the amplitude and pitch contours, while, for those with geminates, the values above 1 can be interpreted as a FALLING trend in the contours of amplitude and f0 from the first to the second syllable. Note, however, that the degree of contrast between singletons and geminates is somewhat larger for f0 ratio, suggesting that this parameter is a slightly more promising dimension in signaling the singleton/geminate contrast in comparison to amplitude ratio, particularly in utterance-initial position (see below on utterance position effects). We can further validate this trend by comparing the mean ratios of f0 and amplitude shown in Table 13. For words beginning with singletons, the lower mean f0 ratio (i.e. 0.97) suggests that f0 values are likely to rise more steeply from the first to the second syllable as compared to amplitude values. As for words with geminates, the higher mean f0 ratio (i.e. 1.04) implies that f0 values tend to fall slightly more sharply from the first syllable to the next one as compared to amplitude values. Yet, SD values are slightly higher in the f0 ratio data across consonant length categories, more so in the case of geminates (i.e. 0.12, see Table 13), indicating greatest variability in the relative values of f0 when words begin with geminates.
The two sets of data, amplitude ratio and f0 ratio, were each submitted to a maximally fit mixed-effects model for the main effects LENGTH, POSITION, MANNER and interactions. The summaries of coefficients are given in Tables 14 (amplitude ratio) and 15 (f0 ratio).
As shown, both amplitude and f0 ratios vary as a function of the consonant length, utterance position and manner of articulation/voicing type. The results of likelihood ratio tests (using model comparison) show that there is a significant interaction between LENGTH and POSITION for both ratios of amplitude (χ2 = 280.36, p < .001) and f0 (χ2 = 169.24, p < .001), i.e. magnitude differences between singletons and geminates change according to utterance environment, with amplitude/f0 ratios being greater in utterance-initial position than in utterance-medial position. Similarly, model comparison confirms that the interaction between LENGTH and MANNER is significant (amplitude ratio: χ2 = 76.7; f0 ratio: χ2 = 26.179, both p < .001), i.e. the degrees of contrast in terms of relative values differ depending on consonant manner/voicing type. In the following subsections, the effects of Utterance Position and Manner of Articulation/Voicing are described in detail.
3.3.2 Inter-syllabic differences: Utterance position effects
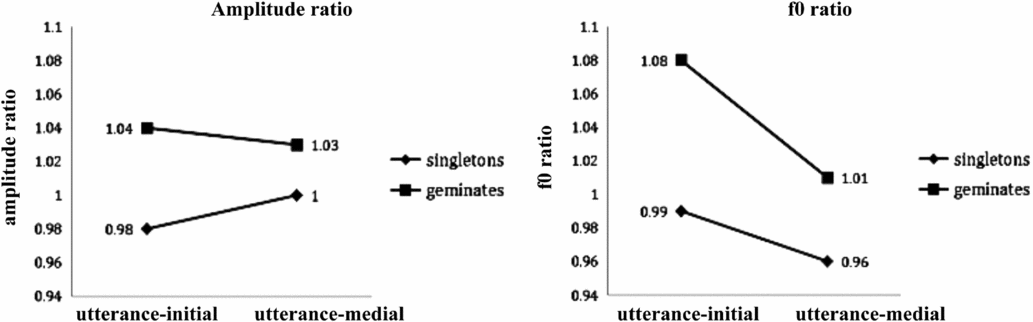
Figure 11 illustrates the effect of utterance position on amplitude ratio (left) and f0 ratio (right). Detailed measurements and summary statistics are provided in Table 16.
Mean ratios of the first and second syllables of disyllabic words beginning with singletons and geminates according to utterance position. Amplitude ratio is shown on the left, while f0 ratio on the right. Data are collapsed across manners of articulation/stop types (i.e. voiceless stops, voiced stops and sonorants).

It can be observed in Figure 11 that the ratios are always significantly greater (at least p < .01) in the geminate environment than in the singleton environment across utterance positions. However, there are always greater contrast enhancements between singletons and geminates in utterance-initial position across ratio types (mean differences: amplitude ratio = 0.06, z = –17.108; f0 ratio = 0.09, z = –6.973, both p < .001, see Table 16). The other important finding is that such enhancements in utterance-initial position are implemented differently between the two ratio types. On one hand, there is a lack of enhancement for amplitude ratio, particularly for words beginning with singletons in which the mean amplitude ratio is instead decreased in utterance-initial position (amplitude ratio = 0.98) as compared to that in utterance-medial position (amplitude ratio = 1.00), i.e. a decrease of 0.02 (z = 5.720, p < .001). On the other hand, utterance-initial enhancement is clearly present for f0 ratio, especially for words beginning with geminates in which there is a particularly large increase in the mean f0 ratio in utterance-initial position (f0 ratio = 1.08) as compared to that in utterance-medial position (f0 ratio = 1.01), i.e. an increase of 0.07 (z = –3.184, p = .00489); this particular heightening associated with geminates in utterance-initial position can be interpreted as the largest pitch fall from the first to the second syllable of a disyllabic word, thus reinforcing the singleton/geminate contrast in this utterance context. Note, however, that there is greater variability of f0 values in this particular environment (i.e. SD value = 0.12), as noted earlier in the overall results. In utterance-medial position, there are smaller, albeit significant, degrees of contrast between singletons and geminates for both ratios of amplitude (0.03, z = –6.148, p < .001) and f0 (0.05, z = –3.541, p < .01). The next subsection will elaborate details of manner of articulation/voicing effects underlying this pattern.
3.3.3 Inter-syllabic differences: Manner of articulation/voicing effects
Figures 12 (amplitude ratio) and 13 (f0 ratio) demonstrate the distribution of relative values according to manner of articulation/voicing. Tables 17 (amplitude ratio) and 18 (f0 ratio) present the detailed measurements and post-hoc Tukey test results.
Distribution of amplitude ratios of the first and second syllables of disyllabic words beginning with singletons and geminates according to manner of articulation/voicing and utterance position: voiceless stops (left column), voiced stops (middle column) and sonorants (right column). Utterance-initial tokens are provided in the upper panel, while utterance-medial tokens in the lower panel. The middle box represents the middle 50% of ratio values for each consonant category, while the dot inside the box marks the median/middle quartile of the data. The upper and lower whiskers represent values outside the middle 50%.

Distribution of f0 ratios of the first and second syllables of disyllabic words beginning with singletons and geminates according to manner of articulation/voicing and utterance position: voiceless stops (left column), voiced stops (middle column) and sonorants (right column). Utterance-initial tokens are provided in the upper panel, while utterance-medial tokens in the lower panel. The middle box represents the middle 50% of ratio values for each consonant category, while the dot inside the box marks the median/middle quartile of the data. The upper and lower whiskers represent values outside the middle 50%.

The paradigmatic contrast enhancements between singletons and geminates in utterance-initial position, as observed in the previous section, are clearest in the case of utterance-initial voiceless stops across both ratio types (mean differences: amplitude ratio = 0.08, z = –17.719; f0 ratio = 0.10, z = –7.879, both p < .001). Further, the heightening of geminates in the f0 ratio data, as noted earlier, is also due to utterance-initial voiceless stops in which the mean ratio is greatest (i.e. 1.11, see Table 18). In utterance-medial position, the smaller magnitude differences between singletons and geminates are more evident in the amplitude ratio data, particularly for utterance-medial sonorants in which the mean ratio difference between the two consonant categories is not statistically significant (p = .1999, see Table 17). As for f0 ratio, the mean ratio difference between singletons and geminates almost reaches significance for utterance-medial voiced stops (p = .0586), while it is significant for utterance-medial sonorants (p = .0244, see Table 18).
4 Discussion
In this study, we have examined the potential roles of non-durational acoustic correlates (i.e. amplitude and f0) in signaling the word-initial singleton/geminate consonant contrast in KM. Abramson's (Reference Abramson and Gamkrelidze1987) prediction for PM, with regard to the potential link between word-initial consonant gemination and a set of additional cues alongside closure duration, as stated in Section 1.2, seems generally to hold in our current data. As shown in Section 3.1 for vowel onset amplitude and in Section 3.2 for vowel onset f0, the singleton/geminate contrast is associated with systematic differences in the amplitude and f0 of the following vowel (at least at vowel onset). The overall amplitude difference between singletons and geminates (i.e. 3 dB) reaches the suggested JND value of 3 dB for intensity perception (Toole & Olive Reference Toole and Olive1988). As for the overall f0 difference, we find reliable and statistically significant f0 differences between the two consonant categories for males (9 Hz) and females (8 Hz), although at first glance they do not exceed the expected JND for frequency, i.e. between 10 to 15 Hz (Klatt Reference Klatt1973). That said, it is feasible to argue here that differences in both amplitude and f0 may still function as mutually enhancing.
The RMS amplitude results in KM are comparable in particular to those previously reported for PM (Abramson Reference Abramson and Gamkrelidze1987) in which there is also a 3-dB difference between the vowels produced after word-initial geminates and singletons, as discussed earlier in Section 1.1 (see Table 1). In the case of vowel onset f0, the results in KM are consistent with those reported for Tashlhiyt Berber (Ridouane Reference Ridouane2007) in which there is a 10-Hz difference between the vowels after singletons and geminates (calculated over the first 10 ms of the following vowel). Pertaining to this particular finding, Ridouane (Reference Ridouane2007: 119) argues that the f0 differences shown in vowels after Tashlhiyt Berber geminates, although not found to be statistically significant, may still possibly function as ‘enhancing correlates’ to compensate for a devoicing process found in voiced stop tokens in that language. However, in KM, this is not necessarily the case since voiced stop closures have been found to be reliably voiced in this variety, with the exception of one female speaker FS8, as mentioned in Section 2.3 (see also Hamzah, Fletcher & Hajek Reference Hamzah, Fletcher and Hajek2016). Although higher f0 is not necessarily produced in conjunction with longer closure duration, as pointed out by Ridouane (Reference Ridouane2007), we may otherwise argue that, higher f0 values at vowel onset following all KM geminates observed in this study can nevertheless plausibly be linked to considerably increased closure duration shown across all manners of articulation/stop types (on duration patterns, see Hamzah, Fletcher & Hajek Reference Hamzah, Fletcher and Hajek2016). That is, the increased closure duration in KM geminates may suggest a build-up of intra-oral pressure during longer constriction which may in turn have some potential effect on the amplitude/f0 of the consonant release (see e.g. Stevens Reference Stevens2000) and also of the following vowel, although this speculation requires further experimental confirmation with regard to the potential association between closure duration and amplitude/f0 in the context of KM word-initial geminates.
We asked at the beginning of this study whether amplitude and f0 differences at vowel onset would be affected by utterance position; the results presented in the present study for KM have shown that the largest magnitude difference between singletons and geminates is always displayed in vowels following utterance-initial target consonants. This observation can be interpreted again as an enhancing strategy to contribute to the signaling of the singleton/geminate consonant distinction in utterance-initial position, particularly for voiceless stops in which acoustic closure information is absent as a perceptual cue. There are, however, different strategies within both consonant length categories to deliver larger contrast in domain-initial position. In the case of vowel onset amplitude, larger magnitude differences in utterance-initial position are due to the LOWERING of RMS values in the singleton category (see Figure 4 in Section 3.1), while in the case of vowel onset f0, the size of contrast in utterance-initial position is enhanced by LOWERING of f0 values within both singleton and geminate categories, albeit at different rates and with much stronger effect in the female speaker data (see Figure 7 in Section 3.2). As for ratio results, the larger contrast magnitude between singletons and geminates in utterance-initial position is also realised differently: for amplitude ratio, it is due to the LOWERING of amplitude ratio in the singleton category, while for f0 ratio, it is due to the greater increase of the f0 ratio in the geminate length category (see Figure 11 in Section 3.3). That amplitude/f0 values are lowered in utterance-initial position is antithetical to Cho & Jun's (Reference Cho and Jun2000) prediction on SYNTAGMATIC contrast enhancement (see Section 1.4), i.e. it was expected that amplitude/f0 values would be enhanced in utterance-initial position within both singleton and geminate categories. However, some of our findings have shown that the amplitude/f0 values are instead lowered within these categories. Our results nevertheless provide some evidence for PARADIGMATIC contrast enhancement (Cho & Jun Reference Cho and Jun2000), i.e. larger magnitude differences between singletons and geminates in terms of changes in the level of intensity and pitch in the following vowel are always realised in utterance-initial position (see Figures 4, 7, 11). It is also worth noting that the present study examines all target consonants in relatively prominent position (i.e. with informational focus), as mentioned in Section 2.2. As shown in Italian and many other languages (Avesani, Vayra & Zmarich Reference Avesani, Vayra, Zmarich, Trouvain and Barry2007; Cho & Keating Reference Cho and Keating2009), prominence has an impact on the acoustics and the overall kinematic properties of syllables. In addition, boundary effects in the utterance-initial condition may also lead to different patterns, as has been discussed in e.g. Cho & Keating (Reference Cho and Keating2009) and Cho, Lee & Kim (Reference Cho, Lee and Kim2014). This speculation, however, requires further experimental confirmation with regard to the effects of focus and prominence on consonant gemination in KM in different prosodic contexts, particularly with regard to non-durational acoustic correlates such as amplitude and f0.
With respect to manner of articulation/voicing variation, the heightened contrast in utterance-initial position is usually largest for voiceless stop tokens. For the vowel onset amplitude data, the mean amplitude difference between singletons and geminates is found to be largest after utterance-initial voiceless stops (i.e. 5 dB), which exceeds the suggested JND value for the perception of intensity, i.e. 3 dB (Toole & Olive Reference Toole and Olive1988). This particular finding can be linked to a possible contrast enhancement intended to assist listeners to ‘perceive’ the voiceless stop geminate in this utterance-initial context. There is also the typical relationship between higher f0 and voiceless stops in the vowel onset f0 data in KM, as shown in the current data. That is, it is generally accepted in the literature on f0 that the first few tens of milliseconds of the vowel are influenced by the voicing characteristics of the preceding consonant, with f0 at vowel onset usually being higher following voiceless stops than following voiced stops (e.g. House & Fairbanks Reference House and Fairbanks1953). In KM, this situation is apparent across the board, particularly in utterance-initial position where the mean f0 differences between voiceless stop singletons and geminates are highest for both males (12 Hz) and females (13 Hz). In addition, these f0 differences are also within the threshold of the suggested JND for frequency, i.e. 10 to 15 Hz (Klatt Reference Klatt1973). As for voiced stops and sonorants, the degree of contrast in terms of amplitude and f0 is smaller, which appears to be reflective of the perceptual value of clear voicing/resonance in the closure phases of the target consonant. Although VOT and stop release bursts are not the focus in the current study, previous small-scale studies for KM presented in Hamzah, Fletcher & Hajek (Reference Hamzah, Fletcher, Hajek, Lee and Zee2011, Reference Hamzah, Fletcher, Hajek, Cox, Demuth, Lin, Miles, Palethorpe, Shaw and Yuen2012) have also shown that utterance-initial voiceless stop geminates in KM are associated with shortest VOT but greatest burst amplitude, which can further enhance the voiceless stop length contrast in utterance-initial environments; further detailed investigation on VOT and stop release bursts are warranted to expand our current findings on amplitude and f0.
Our findings in KM broadly converge with the data reported for word-medial geminates in Japanese (Idemaru & Guion Reference Idemaru and Guion2008) and also Lebanese Arabic (Al-Tamimi & Khattab Reference Al-Tamimi, Khattab, Lee and Zee2011, see Table 1 in Section 1.1), i.e. in the way that there are systematic amplitude and f0 differences in vowels surrounding singletons and geminates, suggesting the potential co-variation between the acoustic properties in the target consonant and those in adjacent vowels. In the wider literature on phonological contrasts, the results found here in KM are also for the most part consistent with studies that investigate the fortis/lenis contrast (e.g. Kim, Beddor & Horrocks Reference Kim, Beddor and Horrocks2002), the voiced/voiceless distinction (e.g. Stevens & Klatt Reference Stevens and Klatt1974) and the aspirated/unaspirated contrast (e.g. Pind Reference Pind1999), i.e. in the sense that systematic differences in acoustic properties are observed in a vowel that follows these phonological contrasts, in particular f0 variation.Footnote 11 It is important to bear in mind, however, that the current study only examines the effect of amplitude/f0 at the onset of the following vowel; it remains to be seen in KM whether there is also systematic variation in amplitude and f0 at the midpoint or the offset of the following vowel. Our RMS and f0 data also have to be interpreted with caution as the results were based on raw calculations, as mentioned earlier in Section 2.3.
With regard to the potential role of inter-syllabic differences at word level, the results presented in Section 3.3 have shown that the relative values of amplitude and f0 of the first syllable to the second syllable of a disyllabic word do appear to contribute to the enhancement of the consonant contrast in KM, with significantly higher amplitude and f0 ratios for words beginning with word-initial geminates, although closer inspection finds the effects hold always for voiceless and voiced stops, but for sonorants only in utterance-initial position. No such effect is found for amplitude ratios for utterance-medial sonorants (see Table 17 in Section 3.3), although, pending further investigation, it remains unclear at this stage why this might be the case. We have also demonstrated that the consonant contrast in terms of relative values across syllables is enhanced in utterance-initial position, particularly for words beginning with voiceless stops. This finding is generally consistent with the interpretation of ratio results in PM presented by Abramson (Reference Abramson, Warotamasikkhadit and Panakul1998) in that the initial syllable of a disyllabic word beginning with voiceless stop geminates is always associated with greater salience (i.e. higher ratios of amplitude and f0) than that beginning with singletons. Our results are also in line with Abramson's (Reference Abramson, Warotamasikkhadit and Panakul1998: 8) proposal of ‘accentual system’. Finally, we have observed in the current data in KM that the overall magnitude of contrast between singletons and geminates is larger for relative f0 in comparison to relative amplitude, which accords well with Abramson's (Reference Abramson, Warotamasikkhadit and Panakul1998) observation of a stronger effect of f0 ratio in PM. Our ratio results in KM have also shown that the fall of amplitude and f0 from the first to the second syllable is always greater across geminates than across singletons, particularly for voiceless stop tokens produced in utterance-initial contexts. These results are in tandem with the previously noted observations of Idemaru & Guion (Reference Idemaru and Guion2008) and also Kubozono et al. (Reference Kubozono, Takeyasu, Giriko, Hirayama, Lee and Zee2011) with respect to contour shapes across syllables in Japanese. Bear in mind that, for ratio results, we did not take into account the intrinsic differences between vowel qualities. However, we hope that these ratio results would provide alternative insights into non-durational characteristics of KM geminates, in addition to the raw results of vowel amplitude and vowel f0.
5 Conclusion
This study has examined in detail the nature and the potential roles of two non-durational acoustic correlates (amplitude and f0) in signaling the word-initial singleton/geminate consonant contrast in an understudied language, Kelantan Malay. The overall results have shown that the KM consonant contrast is reflected through systematic variation in vowel onset amplitude, vowel onset f0, and, in almost all contexts tested, the relative values of amplitude and f0 across syllables. At this end, it appears that KM word-initial geminates are reliably characterised not only by longer closure duration (Hamzah, Fletcher & Hajek Reference Hamzah, Fletcher and Hajek2016; Hamzah, Hajek & Fletcher Reference Hamzah, Hajek, Fletcher, Carignan and Tyler2016), shorter VOT for voiceless stops (Hamzah, Fletcher & Hajek Reference Hamzah, Fletcher, Hajek, Lee and Zee2011) and, to a certain degree, shorter post-consonantal vowel duration (Hamzah, Hajek & Fletcher Reference Hamzah, Hajek, Fletcher, Ma, Ding and Hirst2012), but also, as shown in the current study, by greater amplitude and f0 in the early part of the following vowel, and also by higher ratios of amplitude and f0 across syllables of disyllabic words. Also, because of these additional correlates, the saliency of the consonant contrast is preserved in utterance-initial position where the contrast is likely to be weakened, particularly in the case of voiceless stops. Since the singleton/geminate contrast in KM only occurs word-initially, and, by extension, frequently also utterance-initially, extra effort from native speakers may be required to produce a clear distinction in utterance-initial position, which mirrors the additional strategy employed by, for example, the speakers of PM (i.e. the use of amplitude/f0, Abramson Reference Abramson, Warotamasikkhadit and Panakul1998) and also Cypriot Greek (i.e. the use of VOT, Arvaniti & Tserdanelis Reference Arvaniti, Tserdanelis, Yuan, Huang and Tang2000) to maintain the same word-initial consonant contrasts in these languages.
The acoustic results in our study suggest that there are several non-closure cues that contribute to contrast enhancement in KM. The fact that utterance-initial voiceless stop geminates are associated with shorter VOT (Hamzah, Fletcher & Hajek Reference Hamzah, Fletcher, Hajek, Lee and Zee2011) as well as with higher burst amplitude values (Hamzah, Fletcher & Hajek Reference Hamzah, Fletcher, Hajek, Cox, Demuth, Lin, Miles, Palethorpe, Shaw and Yuen2012) supports the view that there is a potentially different phonetic implementation strategy for this particular stop type at least. Although domain-initial strengthening effects are implemented differently within consonant length categories (e.g. vowel onset amplitude, see Figure 4), they can be interpreted as the manifestation of greater articulatory effort in order to maintain the singleton/geminate contrast in domain-initial position. This observation is line with Cho & Jun's (Reference Cho and Jun2000) concept of paradigmatic contrast enhancement which claims that the phonological contrast is maximised at prosodically strong locations, i.e. utterance-initial position. In a nutshell, acoustic enhancement of the consonant contrast is evident in the KM corpus, with strengthening possibly functioning in combination with durational parameters to signal the word-initial consonant contrast. Future work should investigate articulatory parameters associated with this contrast to see whether indeed there are differences in intraoral pressure, for example, among singleton and geminate stops in KM. Analysis of spontaneous speech may also provide further insights into the production of word-initial consonant gemination in authentic communicative data with particular focus on the potential influence of post-lexical prosody.
Acknowledgements
This study was supported by the Skim Latihan Akademik Bumiputra (SLAB) under the Ministry of Education Malaysia and Universiti Teknologi Malaysia awarded to the first author. Many thanks go to the staff of the University of Melbourne for their generous assistance during the recording of the Kelantanese speakers in Melbourne. We are also grateful to the management of Universiti Malaysia Kelantan for offering access to their undergraduate students who made the task of data collection enjoyable and rewarding.
Appendix A. Mixed-effects models
The best five maximally fit mixed-effects models were applied to the amplitude/f0 data examined in this study: all models tested fixed effects and interactions between consonant length, utterance position and manner of articulation on the word-initial singleton/geminate consonant contrast in KM.
Model1: Vowelonsetamplitude ~ length+position+manner + length*position + length* manner + (length+position+manner|speaker)
Model2: Vowelonsetf0male ~ length+position+manner + length*position + length*manner + (length+position+manner|speaker)
Model3: Vowelonsetf0female ~ length+position+manner + length*position + length* manner + (length+position+manner|speaker)
Model4: amplituderatio ~ length+position+manner + length*position + length*manner + (length+position+manner|speaker)
Model5: f0ratio ~ length+position+manner + length*position + length*manner + (length+ position+manner|speaker)
Appendix B. Speaker-specific results (vowel onset amplitude)
Number of tokens, mean RMS amplitude values (dB), standard deviations, mean differences and ANOVA results for singletons and geminates according to speaker.

Appendix C. Speaker-specific results (vowel onset f0)
Number of tokens, mean f0 values (Hz), standard deviations, mean differences and ANOVA results for singletons and geminates according to speaker (males).

Number of tokens, mean f0 values (Hz), standard deviations, mean differences and ANOVA results for singletons and geminates according to speaker (females).

Appendix D. Speaker-specific results (amplitude and f0 ratios)
Number of tokens, mean amplitude ratio, standard deviations, mean differences and ANOVA results for singletons and geminates according to speaker.

Number of tokens, mean f0 ratio, standard deviations, mean differences and ANOVA results for singletons and geminates according to speaker.

Appendix E. Vowel-specific results (amplitude ratio)
Number of tokens, mean amplitude ratio, standard deviations, mean differences and adjusted p-values for singletons and geminates according to vowel height (utterance-initial position).

Number of tokens, mean amplitude ratio, standard deviations, mean differences and adjusted p-values for singletons and geminates according to vowel height (utterance-medial position).

Appendix F. Vowel-specific results (f0 ratio)
Number of tokens, mean f0 ratio, standard deviations, mean differences and adjusted p-values for singletons and geminates according to vowel height (utterance-initial position).

Number of tokens, mean f0 ratio, standard deviations, mean differences and adjusted p-values for singletons and geminates according to vowel height (utterance-medial position).