Implications
Sufficient access to drinking water is important to safeguard animal welfare, but providing water continuously may represent a challenge when keeping pigs outdoors during periods of frosty weather. The present study found that behavioural signs of thirst increased with increasing duration of nightly water restriction in lactating sows and suggests that depriving sows of water for 6 h, or more, is associated with negative subjective experiences of thirst. Water-deprived sows showed compensatory water intake during the day but performance was unaffected.
Introduction
Freedom from hunger and thirst is the first of the ‘five freedoms’ outlined by the UK Animal Welfare Council (http://www.fawc.org.uk/freedoms.htm) and the absence of prolonged thirst is used as a criterion in the European WelfareQuality® scheme (Botreau et al., Reference Botreau, Veissier, Butterworth, Bracke and Keeling2007). However, water requirements of farm animals and the impact of water restriction on animal welfare have received little scientific attention (Patience, Reference Patience2012; Von Keyserlingk et al., Reference Von Keyserlingk, Nielsen, Patience and Phillips2015). Pigs must always have access to drinking water according to EU regulations (Council Directive 2008/120/EC of 18 December 2008), but providing water continuously for 24 h may represent a challenge, for instance when keeping pigs outdoors during periods of frosty weather (Andersen and Pedersen, Reference Andersen and Pedersen2014). In lactating sows (Andersen and Pedersen, Reference Andersen and Pedersen2014), as well as in growing pigs (Turner et al., Reference Turner, Sinclair and Edwards2000), most water was ingested during the daylight hours. Thus, if little water is ingested during the night, temporary nightly restriction of water may have no adverse effects on animal welfare, and an investigation of the effects of timing and duration of water deprivation is relevant. Water is essential for biological functioning and in lactating sows water restriction may lead to reduced milk production, less nursing and reduced piglet growth. On the other hand, sows may be experiencing high levels of thirst before water deprivation affects nursing behaviour or milk production. Thirst has been defined as a motivation to search for and ingest water (Kyriazakis and Tolkamp, Reference Kyriazakis and Tolkamp2011). This definition implies that behavioural measures of thirst are increased water intake (compensatory water consumption; Viola et al., Reference Viola, Ribeiro and Penz2005; Sprenger et al., Reference Sprenger, Vangestel and Tuyttens2009) and reduced latency to drink after a period of water deprivation. Correspondingly, compensatory feed consumption and reduced latency to eat are used as measures of hunger (e.g. De Jong et al., Reference De Jong, Fillerup and Blokhuis2005; Nielsen et al., Reference Nielsen, Thodberg, Malmkvist and Steenfeldt2011).
Thirst has also been defined as a subjective sensation of lack of water (Rolls and Rolls, Reference Rolls and Rolls1982), and a subjective perception that motivates animals to drink (Sprenger et al., Reference Sprenger, Vangestel and Tuyttens2009), and these definitions focussing on subjective experiences are more helpful in relation to which levels of thirst are detrimental to animal welfare. In a conceptual review, Fraser and Duncan (Reference Fraser and Duncan1998) suggest that negative motivational states, such as thirst and fear, have evolved in response to ‘need situations’ in order to maintain homoeostasis. Thus, potentially damaging disturbances to the homeostasis give rise to negative motivational affective states that, if intense and prolonged, are associated with reduced animal welfare. Hence, if water restriction is long enough then the sensation of thirst may exceed a threshold where it is accompanied by a negative subjective experience compromising animal welfare. Reduced latency to drink and increased compensatory water consumption may be associated with a negative subjective perception of thirst. However, behavioural measures indicative of frustration will strengthen the argument that these measures are associated with negative subjective experiences. In the case of food restriction, measures of frustration due to hunger are tail pecking and stereotypic pecking of fixture in broilers (De Jong et al., Reference De Jong, Fillerup and Blokhuis2005; Nielsen et al., Reference Nielsen, Thodberg, Malmkvist and Steenfeldt2011), and abnormal behaviour and aggression in pregnant sows (Appleby and Lawrence, Reference Appleby and Lawrence1987; Meunier-Salaün et al., Reference Meunier-Salaün, Edwards and Roberts2001). Similarly, such measures may be indicative of frustration due to thirst, but this has not been investigated.
The aim of the present study was to investigate effects of varying duration of nightly water restriction on the welfare and production of lactating sows. We hypothesised a reduced latency to drink, increased compensatory water consumption and more behavioural signs of frustration with increasing duration of nightly water deprivation. Further, we hypothesised less nursing and reduced milk yield the longer sows were denied access to water.
Material and methods
Animals, general housing and management
The study was conducted at Aarhus University, AU-Foulum, Denmark from August 2013 to February 2014 and complied with a protocol approved by the Danish Animal Experiments Inspectorate (2013-15-2934). A total of 48 Danish crossbred Landrace×Yorkshire 1st parity sows in three successive blocks of 16 animals were used. The gestating sows were purchased through the Danish specific pathogen free trading company (Vejen, Denmark), transported to AU-Foulum 3 weeks before their expected farrowing and group housed in a pen with individual feeding crates. One week before expected farrowing each of the 16 sows in a block was allocated to one of two neighbouring rooms balanced for BW, and within room they were randomly allocated to one of eight identical farrowing pens for loose housed lactating sows. Each pen measured 6.6 m2 and the flooring was 41% slatted and 59% solid concrete (Supplementary Figure S1). Artificial light was turned on daily from 0800 to 2000 h. The room temperature was maintained at 20°C until 2 days after the last sow in a room had farrowed. Then it was gradually reduced to 16°C and kept at this level throughout the remaining experimental period. Day 7 to 28 after the last sow in a room had farrowed, the room temperature was 15.8 (15.5 to 16.8)°C (median (interquartile range)), and relative humidity was 75.9 (15.5 to 90.1)%. All sows had ad libitum access to uncut barley straw in a straw rack. At introduction to the experimental pens sows were on average 107 (SD 5.61) days of gestation and weighed on average 214 (SD 18.8) kg.
Each farrowing pen was equipped with a feeding trough and, adjacent to this, a modified water trough with an edge height of 35 cm holding 16 l of water was placed (Supplementary Figure S2). All water troughs had a lid, which was automatically closed between 0750 and 0800 h, while the troughs were automatically emptied, rinsed and refilled with fresh water according to self-written software (Supplementary Material S1). In addition, all water troughs were closed (manual control) for ~20 min within the interval 1230 to 1330 h to allow for manual opening, cleaning and refilling of individual water troughs. The exact time of this procedure was noted daily.
Litter equalisation was conducted twice. First, the day after each individual sow had farrowed such that each litter contained 13 to 14 piglets. Second, litter equalisation was conducted 7 days after the last sow of the room within a block had farrowed (day 7) such that each litter contained 10 to 12 piglets (constant within a block). To maintain a similar demand for milk in litters within blocks, piglets that died after day 7 were weighed and replaced with a piglet of similar age and weight from one of two non-experimental sows per block. On day 4, all piglets were injected with 1 ml iron and male piglets were also injected with 0.5 ml flunixin and castrated by use of a scalpel.
In the farrowing pens, the experimental sows were fed a commercially available complete dry feed mix with 13.5 MJ of metabolisable energy (ME)/kg and 14% CP (So Die Profil U, DLG, Copenhagen, Denmark) three times daily (25% feed at 0900 h, 25% feed at 1400 h and 50% feed at 1900 h). From day 7 to 28 after farrowing feed was supplied according to appetite. Each day between 1230 and 1400 h the leftovers were removed, weighed and discarded, the straw racks were refilled and the pens were cleaned out.
Experimental treatments, design and experimental water troughs
Throughout the experimental period the sows’ only source of water was the modified water trough. Troughs were chosen as the water source to minimise water spillage due to sows’ manipulation. After a minimum of 9 days from the time when the last sow in a room within a block had farrowed (median 12 (interquartile range 11 to 14) days after farrowing), all sows in the room had ad libitum access to water in the troughs throughout the 24-h period, except for the standard cleaning procedures described above. From 2000 h on day 10 until 0800 h on day 28 (both days included and counting from the last sow in a room within a block had farrowed), sows were either deprived of access to water each night for 3 h (no water access from 0500 to 0800 h), 6 h (no water access from 0200 to 0800 h), 12 h (no water access from 2000 to 0800 h) or had ad libitum access to water throughout the 24 h (control). Within a block and a room, two sows were allocated to each of the four treatments balanced for farrowing date (i.e. among the first four sows and the last four sows that farrowed, respectively, one sow was randomly allocated to each of the four treatments).
On days 26 and 27, a ‘water simulation test’ (WST) was carried out, where the water troughs were closed 25 min longer than usual (i.e. from 0750 to 0825 h), while two extra rinsing procedures were conducted. This procedure was conducted to give the usual signals of imminent availability of water without subsequently providing it in order to measure the sow’s response in this hypothetical frustrating situation. Finally, on day 28 the troughs remained closed while milk and urine samples were collected.
Inclusion criteria
Two sows were excluded from the experiment; one sow due to disease and one sow due to delayed farrowing (both control sows). Another two sows had to be excluded from day 24 and onwards (one control and one 3 h sow); one due to sudden disease and one due to malfunction of her water trough (leaving only 44 sows in the WST data set). For the automatically recorded data on water intake, days with malfunction of the waterlogging equipment, or the water trough, were noted throughout the experiment. Individual days with irregularities in the collection of water data (e.g. due to power failure or malfunctioning pumps) were excluded from the automatically collected water data. Due to such malfunctions another four sows had to be removed from the data sets for water intake and production (these sows were one control, two 3 h and one 6 h) leaving only 40 sows (8, 9, 11 and 12 sows on the treatments control, 3, 6 and 12 h, respectively) in these data sets.
Automatic recordings of water intake
Water consumption from the water trough was measured by an input pulse counter (PC) sending a string containing registered pulses for each water trough and each second to the PC via a serial connection. The serial data were then collected using the ‘RealTerm’ software, which also added a timestamp to each data line received. Calibrations were performed routinely (Supplementary Material S1). The mean number of pulses per litre water was calculated for each individual sow and this mean was used when calculating individual water consumption. The daily time windows, where the troughs were rinsed and refilled, were deleted from the water data set.
Behavioural measures
The behaviour of each experimental sow was recorded continuously using video (Monacor TVCCD-190COL, Monacor, Bremen, Germany) and saved digitally by use of MSH-Video Server (version 5.0.11.136, M. Shafro & Co, Riga, Latvia, Europe). Recordings were initiated when sows were moved to the experimental pens and ended on day 28. From the video recordings it was routinely checked if the water trough opened and closed as planned.
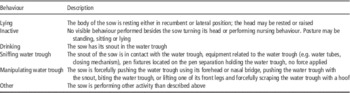
From the video recordings, behaviour of individual sows was recorded on a number of occasions. First, on days 10, 11, 16, 18, 24 and 25 the behavioural elements ‘lying’, ‘inactive’, ‘sniffing water trough’ and ‘manipulating water trough’ (see Table 1) were recorded from 0730 to 0830 h, labelled ‘water trough opening’ (WTO). Before the water trough opened the observer was blind to treatment groups 3, 6 and 12 h. Second, on days 26 and 27 (WST), the behaviour of the sows was recorded from 0730 to 0930 h. During this time, ‘lying’, ‘inactive’, ‘sniffing water trough’ and ‘manipulating water trough’ (see Table 1) were recorded (the observer was blind to treatments 3, 6 and 12 h). Finally, milk let down (defined as the sow lying still, while all (except maximally one to three) piglets have a teat in the mouth and are suckling simultaneously and intensively for at least 10 s) was recorded on day 24 during 24 h, starting at midnight. All behavioural recordings were conducted using continuous recording and focal animal sampling (Martin and Bateson, Reference Martin and Bateson2007), and were performed by two trained observers. Observer one recorded behaviour around the time of WTO, whereas behaviour during the WST and nursing behaviour was recorded by observer two.
Description of the recorded behaviours around the time of water trough opening and during the water simulation test

Performance and physiological measures
Sows were weighed 7 days before the day of expected farrowing and again on day 28 when exiting the experiment. Piglets were weighed the day after birth and then on days 7, 14, 21 and 28 (all days calculated from the farrowing of the latest farrowing sow in the room within a block).
Milk samples (~100 ml) were also taken on day 28 when exiting the experiment, while each sow was restrained by nose sling and injected with 0.3 ml oxytocin in the ear vein. All samples were taken between 0800 and 1200 h. The milk was filtered through cheesecloth and stored at −20°C until analysis for contents of dry matter, lactose, protein and fat using MilkoScan FT2 (Foss, Hillerød, Denmark). Although the sow was still in nose sling a urine catheter was inserted into the bladder, which was emptied for urine. The catheter was closed, the sow was released and left undisturbed for 30 min after which a fresh urine sample was taken and stored at −20°C until analysis for content of nitrogen using a modified Kjeldahl method (AOAC, 2000).
Statistical analyses
Continuous variables were analysed using the following model (model 1) in SAS (Mixed procedure; SAS Institute, Cary, NC, USA):
 $$Y_{{ijks}} {\,=\,}\mu {\plus}\alpha _{i} {\plus}\beta _{j} {\plus}\alpha \beta _{{ij}} {\plus}\tau _{k} {\plus}\upsilon _{{is}} {\plus}{\varepsilon }_{{ijks}} $$
where Y ijks is the response variable, μ the overall mean, α i the fixed effect of water deprivation (i=0, 3, 6 or 12 h), β j the fixed effect of time (the values of ‘j’ depending on data set, see below), αβ ij the interaction between water deprivation and time, τ k the random effect of block (k=1, 2, 3), υ is the random effect of sow within water deprivation treatment and ε ijks the residual error component which was assumed to be N (0, σ 2) distributed. Depending on the data set, the effect of time varied (1) automatic recorded water intake and latency to drink; the effect of period (j=1 (days 10 to 17) or 2 (days 18 to 25)), (2) behaviour around the time of WTO; the effect of day (j=WTO_10, WTO_17 or WTO_24), (3) performance data; the effect of week (j=1, 2, 3 or 4). All indications of time refer to the time of farrowing of the last sow in a room within a block. Correlation between repeated observations on the same sow was modelled by compound symmetry (water intake and behaviour) or spatial (performance). The assumptions of normal distribution of data and variance homogeneity were checked by visual inspection of residual plots.
Automatic recorded water intake and latency to drink
The daily water intake of each sow was calculated from day 10 to day 25 (after the last sow in a room within a block had farrowed) as the sum over 24 h (from 0800 to 0759 h the following day). In addition, the latency to drink was calculated as the time from opening of the water trough until the first water pulse was recorded for each sow and day. To investigate the effect of stage of lactation, days after the onset of water deprivation treatment on day 10 were categorised into two periods; period one (days 10 to 17) and period two (days 18 to 25), and average daily water intake and a median latency to drink was calculated for each sow in each period. These were then used as input in statistical analyses using model 1.
For the analysis of effect of treatment on the circadian rhythm of water intake, day 10 to day 25 were split up in eight 3-h times of day (0800 to1059 h, 1100 to 1359 h, 1400 to 1659 h, 1700 to 1959 h, 2000 to 2259 h, 2300 to 0159 h, 0200 to 0459 h and 0500 to 0759 h), and the water intake in each 3-h time of day was calculated for each sow and day. Subsequently, an average daily water intake in each 3-h time of day was calculated for each sow in period one and two, as defined above, and used as input for the analysis. Data were analysed using model 1 adding as fixed effects the time of day and the interactions, treatment×time of day and treatment×period×time of day. Finally, a subset of data including the first 3 h after water became accessible (0800 to 1059 h) was defined and analysed for effects of treatment and treatment interactions adding as fixed effects hour and the interactions, treatment×hour and treatment×period×hour.
Behaviour around the time of WTO
For the analysis of effect of treatment on behaviour around the time of trough opening, the duration of lying and the duration of being inactive were calculated for each sow and day during 30 min before opening of the water trough (0730 to 0800 h) and during 30 min after opening of the water trough (0800 to 0830 h). After trough opening the latency to drink was also calculated for each sow and day. Subsequently, an average for the 30 min before and after trough opening was calculated for days 10 and 11 (WTO_10), days 16 and 18 (WTO_17) and days 24 and 25 (WTO_24) and these data were analysed using model 1. Before analysis the latency to drink was transformed by the natural log to meet the assumption of normal distribution.
The variables ‘sniffing water trough’ and ‘manipulating water trough’ were, due to many zero observations, converted into a categorical variable (0, 1) and these data were analysed using a Fisher’s exact test (Siegel and Castallean, Reference Siegel and Castellan1988).
WST
The duration of lying and the duration of inactive were calculated for each sow and day during the 55 min before (0730 to 0825 h) and the 65 min after opening of the water trough (0825 to 0930 h). In addition, the latency to drink was calculated for each sow and day. These data were averaged over the 2 days of test (days 26 and 27) and analysed using model 1 (omitting the effect of time). The variables ‘sniffing water trough’ and ‘manipulating water trough’ were calculated as described above and analysed using a Fisher’s exact test.
Nursing behaviour
The number of daily milk let-down occasions was calculated for each sow on day 24 and analysed using model 1 (omitting the effect of time). For the analysis of effect of treatment on the circadian rhythm of nursing behaviour, the 24-h period was spilt up in eight 3-h times of day (0800 to1059 h, 1100 to 1359 h, 1400 to 1659 h, 1700 to 1959 h, 2000 to 2259 h, 2300 to 0159 h, 0200 to 0459 h and 0500 to 0759 h), and the number of daily milk let down was calculated for each sow and used as input for the analysis. Data were analysed using model 1 adding as fixed effects the time of day and the interaction treatment×time of day.
Performance
The daily water intake of each sow was calculated from day 1 to 25 and averaged over each week of lactation. In addition, the feed water intake was calculated based on intake and moisture content (AOAC, 2000). For deriving the daily water balance, total water input (kg/day) was calculated as water intake (recorded)+water from feed+metabolically produced water (assumed to be ascribed to carbohydrate oxidation of ~85%; Theil et al., Reference Theil, Jorgensen and Jakobsen2004). First, the heat production of the sow was calculated: heat-production-sow (MJ/day)=0.482 MJ/kg0.75/day×kg0.75+(1−((kg milk produced×energy content in milk)/0.78)), where 0.482 denotes the daily energy requirement for maintenance (per kg0.75), energy content in milk was assumed to be 5.3, 5.0, 4.8 and 4.6 MJ/kg for week 1, 2, 3 and 4, respectively (Hansen et al., Reference Hansen, Strathe, Kebreab, France and Theil2012), and 0.78 the efficiency of converting ME to milk (Theil et al., Reference Theil, Jorgensen and Jakobsen2004). Then, the metabolically produced water was calculated: metabolically produced water (kg/day)=heat-production-sow×18×6/(162×17.58×1000), where 18 is molecular weight for water, 6 the number of H2O molecules produced per molecule of glucose, 162 the molecular weight for glucose bound in starch (Theil et al., Reference Theil, Jørgensen, Serena, Hendrickson and Bach Knudsen2011), 17.58 the caloric value of dietary carbohydrates (Brouwer, Reference Brouwer1965) and 1000 used to convert from gram to kilogram. The water output was calculated: output of water (kg/day)=water in milk+water in faeces+respiratory water loss+urinary water loss. The mean weekly milk yield was calculated from recordings of litter gain (in kg/day) and litter size as described by Hansen et al. (Reference Hansen, Strathe, Kebreab, France and Theil2012), and water in milk calculated as milk yield×moisture content of the milk (moisture content was assumed to be 80.3, 81.2, 81.7 and 82.2% for week 1, 2, 3 and 4, respectively; Hansen et al., Reference Hansen, Strathe, Kebreab, France and Theil2012). Water in faeces was calculated from recorded feed intake×digestibility×moisture content of faeces, where the digestibility and moisture content of faeces were assumed to be 83% and 66%, respectively. Water in faeces (kg/day)=feed intake×(1−0.83)×0.66. Respiratory water loss (kg/day) was calculated as 0.0483×sow BW0.6309 (extrapolated from values reported by Holmes and Mount (Reference Holmes and Mount1967)). The water secreted in urine was calculated as: water in urine (kg/day)=input of water−(water in milk+water in faeces+respiratory water loss).
Results
Automatic recorded water intake and latency to drink
No significant effect of water restriction was found on average daily water intake during the treatment period (day 10 to 25), but water intake was higher in the second period (19.7 v. 21.2 (SEM 1.9) l/24 h for period one (days 10 to 17) and period two (days 18 to 25); F 1,33=7.83; P<0.01).
The latency to drink after opening of the water trough at 0800 h was shorter the longer the duration of previous water deprivation, however, this effect was most pronounced in period two (19.9b, 16.3bc, 7.4cd and 8.0cd min for control, 3, 6 and 12 h sows in period one and 33.7a, 19.6b, 3.2d and 5.3d (SEM 3.8) min for control, 3, 6 and 12 h sows in period two; treatment×period interaction F 3,33=3.97; P<0.05).
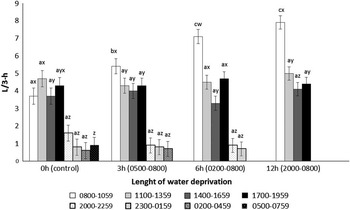
Water intake during the first 3 h following trough opening (from 0800 to 1059 h) was higher the longer duration of prior deprivation (treatment×3-h period interaction F 21,245=5.89; P<0.001; Figure 1). This was due to a higher intake the 1st hour after water became accessible the longer the duration of deprivation (2.05d, 3.37c, 4.71b and 5.62a l/h from 0800 to 0859 h, 0.65e, 0.99d, 1.46d and 1.06d l/h from 0900 to 0959 h and 0.86e, 1.00d, 1.02d and 1.22d l/h from 1000 to 1059 h for control, 3, 6 and 12 h sows (SEM 0.39) l/h; treatment×hour interaction F 6,73=5.43; P<0.001). Water intake during the night hours (2000 to 0800 h) constituted 22%, 13%, 7% and 0% for sows on 0, 3, 6 and 12 h of deprivation, respectively.
Water consumption of sows in 3-h periods (mean and SEM) after deprivation of water for 0 h (control), 3 h (0500 to 0800 h), 6 h (0200 to 0800 h) and 12 h (2000 to 0800 h). Filled bars indicate daylight hours and patterned bars indicate night hours. Periods are given below the figure. Within 3-h period of day bars with different letters (a, b, c) differ significantly at P<0.05, and within treatment bars with different letters (w, x, y, z) differ significantly at P<0.05.

Behaviour
Behaviour around the time of opening of the water trough
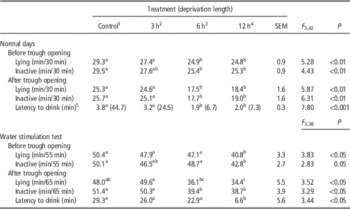
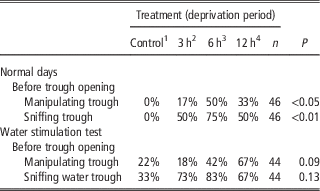
Observations on normal days during 30 min before the opening of the water trough (0730 to 0800 h) showed that sows spent less time lying and less time inactive with increasing duration of water deprivation (Table 2). Before opening of the trough, sows previously deprived of water sniffed and manipulated the trough, whereas no sows on the control treatment were observed to do this (Table 3).
Behaviour (mean and SEM) before and after opening of the water trough on normal days (four mornings between days 10 and 25) and during the water simulation test (days 26 and 27) in control sows and sows deprived of water for 3, 6 and 12 h

a,b,cValues within a row with different superscripts differ significantly at P<0.05.
1 Control sows had access to water during 24 h except for routine cleaning 0750 to 0800 h.
2 3 h sows were deprived of water in the interval 0200 to 0800 h.
3 6 h sows were deprived of water in the interval 0500 to 0800 h.
4 12 h sows were deprived of water in the interval 2000 to 0800 h.
5 Variable transformed before analysis. Backtransformed estimate is given in brackets.
Percentage of animals manipulating and sniffing the water trough during the 30 min before trough opening on four mornings between days 10 and 25 and during the water stimulation test (days 26 and 27) in control sows and sows deprived of water for 3, 6 and 12 h

Number of sows per treatment were for normal days 10, 12, 12 and 12 for control, 3, 6 and 12 h and for water stimulation test 9, 11, 12 and 12.
1 Control sows had access to water during 24 h except for routine cleaning 0750 to 0800 h.
2 3 h sows were deprived of water in the interval 0200 to 0800 h.
3 6 h sows were deprived of water in the interval 0500 to 0800 h.
4 12 h sows were deprived of water in the interval 2000 to 0800 h.
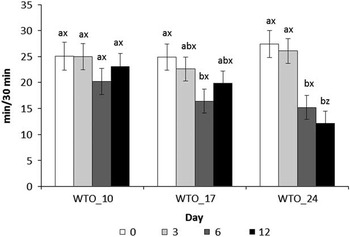
Observations after opening of the water trough (0800 to 0830 h) revealed an interaction between treatment and day for lying (F 6,74=2.68; P<0.05) and inactive behaviour (F 6,74=2.42; P<0.05); a decreasing trend over days was seen for these variables for treatments 6 and 12 h, but not for control and treatment 3 h (see Figure 2 for lying). Thus, on day 24 treatments 6 and 12 h had a significantly lower level of lying and being inactive compared with control and treatment 3 h. The observed latency to drink was lower in sows deprived of water for 6 and 12 h than for sows deprived for 3 h and controls (Table 2).
Duration of lying (mean and SEM) after opening of the water trough (0800 to 0830 h) average over days 10 and 11 (WTO_10), days 16 and 18 (WTO_17) and days 24 and 25 (WTO_24) for treatments 0, 3, 6 and 12 h of water deprivation. Treatments are given below the figure. Within period bars with different letters (a, b) differ significantly at P<0.05, and within treatment bars with different letters (x, z) differ significantly at P<0.05. WTO=water trough opening.

WST on days 26 and 27
Before the water trough opened at 0825 h, sows on treatment 12 h spent less time lying than the remaining treatments (Table 2), while for being inactive this was only a tendency. Before trough opening, a number of sows on all treatments were observed to sniff or manipulate the trough (Table 3). The number of sows manipulating the trough tended to increase with increasing duration of water deprivation (Table 3).
After opening of the water trough, a decreasing trend of lying was seen with increasing duration of deprivation (Table 2). Sows deprived of water for 6 and 12 h were less inactive than controls and sows deprived for 3 h, whereas sows deprived for 12 h had a shorter latency to drink than all other treatments (Table 2).
Nursing behaviour
No effect of treatment was seen on the number of milk let downs on day 24 (14.5, 13.6, 17.3 and 15.6 (SEM 1.45) F 3,36=1.31; P=0.29). The nursings occurred primarily during the daylight hours (2.6, 2.7, 2.6, 2.7, 1.1, 1.4, 1.0, 1.3 (SEM 1.9) nursings/3 h for 0800 to 1059 h, 1100 to 1359 h, 1400 to 1659 h, 1700 to 1959 h, 2000 to 2259 h, 2300 to 0159 h, 0200 to 0459 h and 0500 to 0759 h; F 7,261=24.42; P<0.001), but there was no effect of treatment and no interaction between treatment and time of day.
Performance
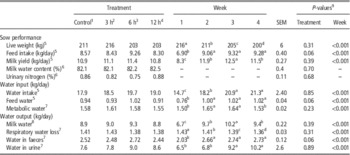
None of the traits related with productivity (sow live weight, feed intake and milk yield), indicators of water imbalance (moisture content of milk and nitrogen concentration in urine) or traits related with water input and water output, were affected by the duration of water deprivation and no interaction between duration of water deprivation and week of lactation was found (Table 4).
Performance (means and SEM) of control sows and sows deprived of water for 3, 6 or 12 h from day 10 to 28 of lactation

a,b,c,dValues within a row with different superscripts differ significantly at P<0.05.
1 Control sows had access to water during 24 h except for routine cleaning 0750 to 0800 h.
2 3 h sows were deprived of water in the interval 0200 to 0800 h.
3 6 h sows were deprived of water in the interval 0500 to 0800 h.
4 12 h sows were deprived of water in the interval 2000 to 0800 h.
5 Measured weekly.
6 Measured at end of experiment (approximately day 28 of lactation).
7 Calculated values (see Material and method section).
8 Milk yield was measured weekly and milk water content measured at end of lactation to compare measured and assumed values of moisture.
9 P-values for the interaction treatment×week is not shown as none of these were significant.
All measured variables changed with progress of lactation. The sow live weight (F 3,114=41.1; P<0.001) decreased with week of lactation, whereas feed intake (F 3,117=38.5; P<0.001), milk yield (F 3,83=98.5; P<0.001) and water intake (F 3,87=86.8; P<0.001 increased with progress of lactation and peaked in week 3 or week 4. As a consequence, the calculated respiratory water loss (F 3,114=41.4; P<0.001) decreased with progress of lactation, whereas calculated values of water from feed (F 3,117=38.5; P<0.001), metabolically produced water (F 3,115=65.9; P<0.001) and water loss via milk (F 3,117=97.8; P<0.001), faeces (F 3,117=38.5; P<0.001) and urine (F 3,83=10.2; P<0.001) also peaked in weeks 3 to 4 of lactation.
Discussion
The results show that behavioural signs of thirst increase with increasing duration of water deprivation in lactating sows. As hypothesised, increasing the duration of nightly water restriction increased compensatory water intake and reduced the latency to drink. Compensatory water intake during the 1st hour after water became accessible was significantly increased with each increasing level of restriction. The lowest latency to drink was observed among sows deprived for 6 or 12 h, whereas sows deprived for 3 h lay between these two treatments and the controls. These measures are behavioural indicators of thirst (Pritchard et al., Reference Pritchard, Burn, Barr and Whay2008; Sprenger et al., Reference Sprenger, Vangestel and Tuyttens2009). However, it is unclear how much these variables must deviate from the norm to be associated with negative subjective experiences of thirst, as outlined in the introduction.
That a reduced latency to drink and an increased compensatory water intake is associated with a negative subjective experience of thirst is supported by our observations of behaviour indicative of frustration and restlessness. First, several sows denied water were observed sniffing and forcefully manipulating the water trough before this opened, whereas none of the control sows were observed doing this on normal days. Second, sows denied water for 6 and 12 h lay down less and were less inactive during the 30 min before trough opening compared with 3 h sows and controls. This suggests that sows on treatments 6 and 12 h had negative subjective experiences of thirst. However, because also some 3 h sows forcefully manipulated the water trough before opening, it cannot be ruled out that also 3 h of water deprivation is associated with negative experiences of thirst. During the WST, the differences regarding forceful manipulation of the trough were non-significant, which may be due to the test inducing a larger variation. During this test, the latency to drink was only shorter for 12 h sows. This may be due to 6 h sows resuming other activities, for example, nursing, whereas 12 h sows continued to focus on the water trough. That 12 h sows were more adversely affected by water restriction than 6 h sows is also supported by 12 h sows lying less and being less inactive before trough opening during the test than 6 h sows. Thus, the behavioural responses during the test suggest that 12 h sows were experiencing more adverse effects of thirst than sows on the remaining treatments. In the present experiment, only first parity sows were used and the effect of water deprivation may be stronger for later parity sows due to a higher milk yield.
The found diurnal variation with 78% of water intake in the day and 22% during the night is in accordance with previous studies in outdoor lactating sows (Andersen and Pedersen, Reference Andersen and Pedersen2014), indoor housed pregnant sows (Kruse et al., Reference Kruse, Traulsen and Krieter2011) and growing pigs (Andersen et al., Reference Andersen, Dybkjær and Herskin2014). Contrary to expectation, the daily water consumption was unaffected by treatment and sows were able to compensate for nightly restriction by drinking more water in the morning. The milk yield peaked in the 3rd week of lactation, which is common for lactating sows (Flummer and Theil, Reference Flummer and Theil2012), and consequently, the loss of water via milk also peaked in the 3rd week. The increasing water consumption over the weeks of experiment is best explained by the increasing water requirement due to increased milk production. Water restriction during the night was hypothesised to cause the sows to conserve water by reducing the number of nursings, or the moisture content of milk and urine. However, we saw no indication of this, which suggests that the water balance of the sows was not affected even though the sows were at peak lactation (Hansen et al., Reference Hansen, Strathe, Kebreab, France and Theil2012). Milk and urine samples were only collected at the end of the experimental period to avoid interfering with the sows’ behaviour. Furthermore, some of the traits for the water input and output variables were calculated based on constants, assumed to be fixed per sow. In the present study, the trait with the highest impact on daily water balance not recorded was milk water, which was calculated based on expected water contents in weeks 1, 2, 3 and 4 (80.3%, 81.2%, 81.7% and 82.2%) according to Hansen et al., Reference Hansen, Strathe, Kebreab, France and Theil2012. As we found values from 82.1% (0-h restriction) to 82.5% water in milk (12-h restriction) at the end of the experiment, the data calculated for water input and outputs seems valid.
Both water and feed intake were comparable for the four treatment groups, which supports that the sows were able to compensate for nightly restriction by increasing water intake when water became accessible in the morning. It follows that, sows seem capable of compensating for temporary water deprivation by using body water during periods of water deprivation to meet the great need for water required for milk production, but as suggested by the behavioural measures, this comes with a cost of negative subjective feelings and reduced welfare.
Conclusion
As hypothesised, behavioural signs of thirst, in the form of increased compensatory water intake and reduced latency to drink, were observed in sows with restricted access to water during the night. Furthermore, with increasing duration of water restriction an increase in the signs of thirst was observed. In addition, forceful interaction with the trough immediately before trough opening on normal days, as well as during a WST, by a number of sows on all restricted treatments, suggests that deprivation of water is associated with negative subjective experiences of thirst, and thus reduced animal welfare, in lactating sows.
Contrary to expectation restricted access to water during the night did not affect nursing behaviour or performance.
Acknowledgements
The study was funded by the Ministry of Food, Agriculture and Fisheries and the Department of Animal Science, Aarhus University. The authors wish to thank the farm staff at AU-Foulum for taking care of the animals, and John Misa Obidah, Lars Bilde Gildbjerg, Mads Ravn Jensen and Connie Hårbo Middelhede (all Aarhus University) for technical assistance and help with data editing.
Supplementary Material
For supplementary material/s referred to in this article, please visit http://dx.doi.org/doi:10.1017/S1751731115002736