


Ageing is associated with an increase in fat mass (FM) and a redistribution of adipose tissue from peripheral to central fat depots(Reference Gabriely and Barzilai1). The age-related decrease in the capacity of the body to store fat in subcutaneous depots (SAT)(Reference Kotani, Tokunaga and Fujioka2) increases fat deposition in visceral adipose tissue (VAT), enhancing the risk of CVD and type 2 diabetes(Reference Boyko, Fujimoto and Leonetti3). The age-related decrease in gluteofemoral SAT may also add to adverse health consequences because this depot is inversely associated with insulin resistance(Reference Snijder, Dekker and Visser4) and cardiometabolic risk(Reference Snijder, Visser and Dekker5). By contrast, epidemiological data suggest a lower impact of overweight and obesity on mortality with age(Reference Childers and Allison6). Age-related changes in the metabolic, endocrine and inflammatory function of adipose tissue may contribute to this contradiction. Adiponectin is an anti-inflammatory adipokine, which is positively associated with insulin sensitivity(Reference Weyer, Funahashi and Tanaka7), whereas leptin has been found to be related to insulin resistance, inflammation and haemostasis(Reference Wannamethee, Tchernova and Whincup8). The effect of age on serum levels of these adipokines remains controversial. Some studies have shown an increase in leptin levels with age(Reference Ryan, Berman and Nicklas9), whereas others found no effect or even an age-related decrease in serum leptin concentrations(Reference Cnop, Landchild and Vidal10–Reference Ostlund, Yang and Klein13). In addition, adiponectin levels increased(Reference Cnop, Havel and Utzschneider14, Reference Koh, Hyun and Choi15) or remained unchanged with age(Reference Staiger, Tschritter and Machann16). These discrepant findings may be partly due to differences in the assessment of adiposity used for the normalisation of adipokine levels. Although leptin is mainly secreted by SAT(Reference Wiest, Moleda and Farkas17), leptin levels were either not normalised(Reference Ryan, Berman and Nicklas9) or adjusted for %FM(Reference Marques-Vidal, Bochud and Paccaud12, Reference Ostlund, Yang and Klein13, Reference Solin, Ball and Robertson18). Adiponectin inversely correlated with %FM as well as with VAT, but was adjusted for these parameters only in some(Reference Marques-Vidal, Bochud and Paccaud12, Reference Koh, Hyun and Choi15, Reference Staiger, Tschritter and Machann16), but not all studies(Reference Ryan, Berman and Nicklas9, Reference Cnop, Havel and Utzschneider14).
In addition, methodological issues of body composition analysis may contribute to discrepancies in the normalisation of adipokine levels(Reference Jurimae, Sudi and Jurimae19). For example, leptin levels were highly correlated with %FM measured by dual-energy X-ray absorptiometry, whereas bioelectrical impedance-derived FM showed a weak relationship with leptin only in obese subjects(Reference Jurimae, Sudi and Jurimae19).
Because adipokine levels and age are both associated with body fat and fat distribution(Reference Minocci, Savia and Lucantoni20), detailed body composition analysis is a prerequisite for understanding the age-related changes in adipokine levels. Today, whole-body MRI is considered as a ‘gold standard’ for the analysis of adipose tissue distribution.
The purpose of the present study was (1) to investigate the impact of age on serum leptin and adiponectin levels independent of age-related changes in adiposity and body fat distribution and (2) to determine the effect of leptin and adiponectin on indices of glucose metabolism in a sample of 210 Caucasians aged 18–78 years.
Subjects and methods
The study population consisted of 210 healthy Caucasian volunteers (127 women and eighty-three men) aged 18–78 years with a BMI range of 16·8–46·8 kg/m2. Participants were recruited from staff at the University of Kiel, by notice board postings in local supermarkets and pharmacies and advertisements in local newspapers. Exclusion criteria were metallic implants, smoking, pregnancy, acute or chronic illness (e.g. diabetes) and regular intake of drugs. The study was conducted according to the guidelines laid down in the Declaration of Helsinki and all procedures involving human subjects were approved by the local ethical committee of the Christian-Albrechts-Universität zu Kiel. Written informed consent was obtained from all subjects before participation.
Study protocol
All participants arrived at the Body Composition Laboratory of the Institute of Human Nutrition and Food Science in the morning at 07.30 hours after an overnight fast of >8 h.
Anthropometric measurements
Body height was measured to the nearest 0·5 cm with subjects wearing no shoes (Seca stadiometer; Vogel & Halke, Hamburg, Germany). Weight was assessed to the nearest 0·01 kg with an electronic scale (Tanita, Tokyo, Japan).
Air-displacement plethysmography
%FM was assessed using the BOD-POD™ device (Life Measurement Instruments, Concord, CA, USA). Before each measurement, a two-step calibration was carried out. In the first step, the volume of the empty chamber was measured, and in the second step, the volume of a 50-litre calibration cylinder was assessed. Then, two repeated measurements of body volume were performed, averaged and corrected for predicted body surface area and measured thoracic gas volume using BOD-POD™ software (version 1.69; Life Measurement Instruments). %FM was calculated from body mass and volume via body density(Reference Siri21).
MRI
Adipose tissue (SAT and VAT) was measured using whole-body multislice MRI. Scans were obtained with a 1.5T scanner (Magnetom Vision Siemens, Erlangen, Germany). Subjects were placed on the platform with their arms extended above their heads. The protocol involved the acquisition of approximately 100 axial images of 10 mm thickness and 10 mm interslice gaps across the whole body. Images were obtained using a T1-weighted gradient-echo sequence (time to repeat 575 ms, time to echo 15 ms). Images were analysed from the wrist to the ankle using SliceOmatic image analysis software (version 4.3; Tomovision, Montreal, Canada). SATarms was segmented from the wrist to the humeral heads, SATlegs from the femoral heads to the ankle and SATtrunk was defined as the area between the femoral heads and the humeral heads. VAT was segmented from the top of the liver to the femoral heads. Intra-observer CV based on the comparison of repeated segmentations were 0·9 % for SAT and 1·0 % for VAT. Body fat distribution is characterised by presenting volumes of adipose tissue as a percentage of total adipose tissue volume (TAT).
Adipocytes are known to enlarge with obesity(Reference Spalding, Arner and Westermark22). Because hypertrophic adipocytes have been shown to secrete more leptin and less adiponectin than small adipocytes(Reference Jernas, Palming and Sjoholm23), we used the parameter FM (kg)/total adipose tissue volume as a measure of fat storage (i.e. a proxy for adipocyte size) in adipose tissue.
Adipokines and parameters of glucose metabolism
Blood samples were taken after an 8 h overnight fast and analysed following standard procedures. HDL-cholesterol was assessed enzymatically using a Konelab-20i-Analyzer (intra-assay CV < 3·5 %; Konelab, Espoo, Finland). Serum glucose was analysed enzymatically with a Konelab-Test-Kit (intra-assay CV = 2·2 %; Thermo Clinical Labsystems, Frankfurt, Germany). RIA were used to measure serum insulin (CV < 5·4 %; Adaltis, Freiburg, Germany), serum leptin and adiponectin concentrations (Linco Research, St Charles, MO, USA). Intra-assay CV were 4–8 % (leptin) and 2–7 % (adiponectin). Insulin resistance was calculated using the HOMA(Reference Matthews, Hosker and Rudenski24).
Statistical analysis
Statistical analyses were performed using SPSS for Windows 15.0 (SPSS, Inc., Chicago, IL, USA). Data are presented as means and standard deviations. Levels of adipokines, insulin and HOMA, HOMA-insulin resistance (HOMA-IR) were not normally distributed (Kolgorov–Smirnov test), so these variables were ln-transformed before correlation and regression analyses. Volumes of VAT and SAT by MRI are expressed as a %TAT in order to characterise fat distribution. Pearson's correlation coefficients were used to calculate the relationships between variables. Differences between sexes were analysed by the independent-samples t test. Partial correlations were used to calculate the relationships between variables independent of %FM, VAT%TAT and age. Stepwise linear regression analyses were used to determine the relationships between levels of adipokines, age, %FM and body fat distribution. All variables, which correlated with the levels of leptin or adiponectin, were used as potential confounders for the multiple regression models.
Although all measures of body fat distribution were highly correlated with each other, collinearity diagnostics indicated that they could be used in the same multiple regression model (tolerance values ranging from 0·273 to 1·000). All tests were two-tailed and a P value < 0·05 was accepted as the limit of significance.
Results
Subject characteristics
Characteristics of the study population are given in Table 1. Men were significantly older and had higher body weight, height, VAT and glucose levels compared with women. By contrast, body FM, amounts of total and regional SAT and fat storage in adipose tissue (as assessed by the ratio FM:TAT) were lower in men compared with women. In addition, serum levels of leptin, adiponectin and insulin were also lower in men than in women. Leptin and adiponectin were inversely correlated in men (r − 0·39, P < 0·001) and women (r − 0·26, P = 0·004).
(Mean values and standard deviations)

FM, body fat mass; SATtotal, subcutaneous adipose tissue volume of the total body; SATtrunk, subcutaneous adipose tissue volume of the trunk; SATarms, subcutaneous adipose tissue volume of the arms, SATlegs, subcutaneous adipose tissue volume of the legs; VAT, visceral adipose tissue volume; FM:TAT, fat storage in adipose tissue; TAT, total adipose tissue; HOMA, homeostasis model assessment.
* Values were significantly different between the sexes (t test).
† Data are given as median and interquartile ranges.
Impact of age and adiposity on leptin and adiponectin levels
Leptin levels were inversely associated with age in women but not in men (Fig. 1; Table 2). When excluding older women ( ≥ 60 years), this correlation was confirmed (r − 0·23, P < 0·05). Partial correlation adjusted for %FM revealed an inverse relationship between age and leptin levels already in the younger age group (18–45 years; r − 0·22, P < 0·05).
Relationships between age and leptin ((a): r − 0·23, P = 0·01, (b): r 0·16, P = 0·16) and adiponectin levels ((c): r 0·38, P < 0·001, (d): r 0·23, P = 0·04) in women (a, c) and men (b, d).

(Correlation coefficients and partial correlation coefficient values)

FM:TAT, fat storage in adipose tissue; SATtotal, subcutaneous adipose tissue volume of the total body; TAT, total adipose tissue; SATtrunk, subcutaneous adipose tissue volume of the trunk; SATarms, subcutaneous adipose tissue volume of the arms, SATlegs, subcutaneous adipose tissue volume of the legs.
* Adipose tissue volumes are given as %TAT.
Age was positively associated with VAT%TAT and inversely with SATtotal%TAT and SATlegs%TAT in men and women. %FM correlated with age in men only (Table 2, correlation coefficients). Controlling for %FM, the inverse association between leptin and age was confirmed in women, whereas in men, the relationship remained non-significant (P = 0·09; Table 2). Fat storage in adipose tissue (FM:TAT) adjusted for %FM was associated with age in women only (Table 2, partial correlation coefficients). Fat storage in adipose tissue correlated with %FM (r 0·70 in women, r 0·76 in men, both P < 0·001) and levels of leptin in both sexes (Table 3).
(Correlation coefficients and partial correlation coefficient values)

FM, body fat mass; FM:TAT, fat storage in adipose tissue; SATtrunk, subcutaneous adipose tissue volume of the trunk; SATarms, subcutaneous adipose tissue volume of the arms, SATlegs, subcutaneous adipose tissue volume of the legs; VAT, visceral adipose tissue TAT, total adipose tissue; SATtotal, subcutaneous adipose tissue volume of the total body.
* Adipose tissue volumes are given as %TAT.
Unadjusted leptin levels as well as levels of leptin adjusted for age correlated with %FM, regional SAT depots, VAT, SATtrunk%TAT and FM:TAT, and were inversely associated with SATarms%TAT and SATlegs%TAT in both sexes. In men, leptin levels also correlated with VAT%TAT (Table 3).
Age explained 5·2 % of the variance in leptin levels in women (Table 4, model 1). In a stepwise regression analysis with serum leptin as a dependent variable and age, %FM, FM:TAT, body fat distribution and interaction terms between age and adiposity or body fat distribution (age × %FM, age × VAT%TAT and age × SAT%TAT) as independent variables, a model including age and %FM explained 80·3 % of the variance in leptin levels in women, with age × %FM explaining additional 1·3 %. By contrast, age alone was not a significant predictor for leptin levels in men (Table 4). Including %FM, FM:TAT, body fat distribution and interaction terms between age and adiposity or body fat distribution (age × %FM, age × VAT%BV and age × SAT%BV) as independent variables in the prediction model, %FM explained 76·6 % of the variance, with age × %FM explaining additional 1·7 %.
Regression models for the impact of age and other potential confounders on leptin levels in women (n 127) and men (n 83)
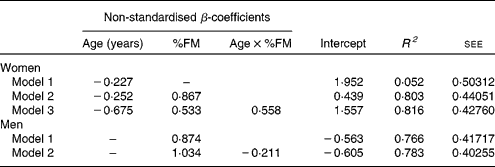
FM, body fat mass; age × %FM, interaction between age and FM; R 2, coefficient of determination; see, standard error of estimate for the regression model.
In contrast to leptin, adiponectin levels were positively correlated with age in both sexes (Table 2; Fig. 1). In women, adiponectin levels were inversely associated with regional SAT depots, whereas adiponectin adjusted for age correlated with SATtrunk, SATarms and VAT. In men, adiponectin levels were inversely associated with %FM, regional SAT depots, SATarms%TAT and VAT (Table 3). Adjustment for age showed additional inverse associations between adiponectin and SATtotal%TAT, SATlegs%TAT and VAT%TAT.
The results of a stepwise multiple regression analysis with adiponectin as the dependent variable and age, %FM, FM:TAT, body fat distribution and interaction terms between age and adiposity or body fat distribution as independent variables are presented in Table 5. Age explained 5·1 %, SATtrunk an additional 9·1 % and including VAT%TAT in the model altogether explained 27·2 % of the variance in adiponectin levels in men. In women, age was the main predictor of adiponectin levels, explaining 14·1 % of its variance and SATtrunk contributing to an additional 3·3 % of explained variance.
Regression models for the impact of age and other potential confounders on adiponectin levels in women (n 127) and men (n 83)
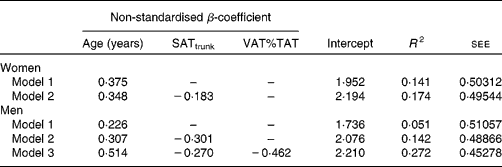
SATtrunk, subcutaneous adipose tissue of the trunk; VAT%TAT, visceral adipose tissue as a percentage of total adipose tissue; R 2, coefficient of determination; see, standard error of estimate for the regression model.
Relationships between adipokines and indices of glucose metabolism independent of age and adiposity
Partial correlations adjusted for %FM showed inverse relationships between age and insulin levels (r − 0·26 for women and r − 0·30 in men, both P < 0·01). There was also an inverse association between age and HOMA-IR in men (r − 0·25, P < 0·05) and a positive association between age and serum glucose levels in women (r 0·39, P < 0·001).
Partial correlations adjusted for %FM, age and VAT%TAT between levels of adipokines and parameters of glucose metabolism showed positive correlations between serum leptin and insulin (r 0·21, P < 0·05), glucose (r 0·31, P < 0·01) and HOMA-IR (r 0·25, P < 0·01) in women. By contrast, adiponectin levels showed inverse associations with parameters of glucose metabolism (insulin: r − 0·31, P < 0·001; glucose: r − 0·19, P = 0·03; HOMA-IR: r − 0·32, P < 0·001) in women. In men, no relationships between leptin or adiponectin levels and parameters of glucose metabolism were found.
Discussion
The present study shows that adiponectin levels increased with age in both sexes, whereas leptin decreased with age in women only. %FM was the main predictor of leptin levels, but age added to the variance in serum leptin in women. By contrast, the variance in adiponectin levels was positively associated with age in both sexes, whereas independent and inverse contributions were found for truncal SAT (and VAT%TAT in men). In women, leptin levels showed positive correlations and adiponectin inverse associations with parameters of glucose metabolism independent of age and body composition.
There was a significant decrease in leptin levels with age in women, whereas leptin did not decline with age in men (Table 2). These findings persist after controlling for %FM and are in line with previous studies, showing an age-related decrease in leptin levels independent of BMI(Reference Isidori, Strollo and More11) and %FM(Reference Cnop, Landchild and Vidal10, Reference Marques-Vidal, Bochud and Paccaud12) in women and no effect of age in men(Reference Cnop, Landchild and Vidal10–Reference Marques-Vidal, Bochud and Paccaud12, Reference Staiger, Tschritter and Machann16). By contrast, others found no association between age and (1) unadjusted leptin in women(Reference Solin, Ball and Robertson18, Reference Castracane, Kraemer and Franken25, Reference Douchi, Iwamoto and Yoshimitsu26) or (2) leptin levels normalised for %FM measured by dual-energy X-ray absorptiometry or bioelectrical impedance(Reference Staiger, Tschritter and Machann16, Reference Baumgartner, Waters and Morley27). Also, age-related increases in unadjusted leptin levels in women(Reference Ryan, Berman and Nicklas9, Reference Baumgartner, Waters and Morley27) or %FM-adjusted leptin in men have been reported(Reference Baumgartner, Waters and Morley27). Some studies have found a decline in leptin only after adjusting for %FM, whereas unadjusted leptin levels tended to increase with age(Reference Marques-Vidal, Bochud and Paccaud12, Reference Baumgartner, Waters and Morley27). The different results could partly be explained by the cut-off chosen for separation of age groups. Some authors have shown an increase in unadjusted leptin levels up to the age of 60 years with a subsequent decrease(Reference Ostlund, Yang and Klein13, Reference Perry, Morley and Horowitz28). We also found a decline in unadjusted leptin levels with age ≥ 60 years in women, whereas partial correlation adjusted for %FM revealed an inverse relationship between age and leptin levels already after the age of 45 years.
The present results show a significant age-related decrease in total SATtotal%TAT, which was explained by the decline in SATlegs%TAT (Table 2). Consistently, previous studies have found lower leg fat in older compared with younger women(Reference Douchi, Yamamoto and Yoshimitsu29) and men(Reference Borkan, Hults and Gerzof30). Because loss of gluteofemoral fat leads to a reduced propensity for storing fat away from the visceral compartment(Reference van Pelt, Jankowski and Gozansky31), this may have contributed to the higher VAT%TAT in older subjects (Table 2). These results are in line with previous studies(Reference Douchi, Yamamoto and Yoshimitsu29, Reference Shen, Punyanitya and Silva32, Reference Zamboni, Armellini and Harris33). According to the present results, the shift towards a central body fat distribution with age is explained by an increase in VAT and a concomitant decrease in SATlegs at an unchanged SATtrunk.
In both sexes, %FM was the main predictor of leptin levels. The interaction between %FM and age had only a low impact on leptin levels in men, explaining 1·7 % of the variance. In women, age alone explained 5·2 % of the variance in leptin. This could be due to lower oestrogen production during and after menopause, because 17β-oestradiol has been shown to increase leptin mRNA in rats(Reference Murakami, Iida and Shima34). Accordingly, Isidori et al. (Reference Isidori, Strollo and More11) identified oestrogen as one factor that accounts for sex differences in leptin levels and could influence leptin production with age.
Using MRI-derived volumes of different adipose tissues and densitometry-derived FM, we found evidence for an increase of fat storage in adipose tissue with age in women (Table 2). Enlarged adipocytes showed a higher leptin secretion rate than smaller fat cells(Reference Jernas, Palming and Sjoholm23). In agreement with this finding, we found associations between leptin levels and FM:TAT in both sexes (Table 3). However, FM:TAT as a measure of fat storage in adipose tissue has not been validated by biopsies. FM:TAT as a parameter of adipocyte size can be limited in the case of weight-loss-induced shrinkage of adipocytes. It is therefore possible that weight-reduced obese subjects may have a lower fat content at the same adipose tissue volume than never-obese, lean subjects with the same %FM.
The age-related increase in adiponectin levels in both sexes (Fig. 1; Table 2) is in line with most studies(Reference Marques-Vidal, Bochud and Paccaud12, Reference Cnop, Havel and Utzschneider14, Reference Koh, Hyun and Choi15, Reference Isobe, Saitoh and Takagi35) but contrary to others who found a decrease(Reference Vilarrasa, Vendrell and Maravall36) or no change(Reference Ryan, Berman and Nicklas9, Reference Staiger, Tschritter and Machann16) in serum adiponectin levels with age. Because of (1) the age-related increase in %FM and VAT%TAT (Table 2) and (2) the inverse relationships between adiponectin and %FM and VAT (Table 3) in men, serum adiponectin levels would have been expected to decrease with age. In agreement with the present results, other studies have reported inverse relationships between adiponectin and VAT measured by MRI or dual-energy X-ray absorptiometry(Reference Ryan, Berman and Nicklas9, Reference Koh, Hyun and Choi15, Reference Snijder, Flyvbjerg and Stehouwer37), or dual-energy X-ray absorptiometry-derived trunk FM(Reference Ryan, Berman and Nicklas9, Reference Snijder, Flyvbjerg and Stehouwer37). However, in the present study, age was the main predictor of adiponectin in women; SATtrunk explained only 3 % of the variance (Table 5). Thus, other factors, such as the age-related decline in testosterone and oestrogen levels, which have been shown to inhibit adiponectin production(Reference Combs, Berg and Rajala38, Reference Nishizawa, Shimomura and Kishida39), might have a higher impact on adiponectin than on body fat or fat distribution in women.
Associations between leptin or adiponectin and parameters of glucose metabolism
Adiponectin levels inversely correlated with the levels of insulin, glucose and HOMA-IR in women; this was independent of FM, individual fat depots and age. In line with previous results, these relationships were significant in women only(Reference Cnop, Havel and Utzschneider14, Reference Salas-Salvado, Granada and Bullo40).
Leptin may adversely affect glucose metabolism. In fact, serum leptin levels (adjusted for adiposity and body fat distribution) showed positive associations with fasting insulin, glucose and HOMA-IR in women, but not in men. These relationships have been reported previously for women(Reference Paz-Filho, Esposito and Hurwitz41) but also for men(Reference Wannamethee, Tchernova and Whincup8). It is tempting to speculate that the observed age-related increase in serum adiponectin and decrease in serum leptin may protect against insulin resistance, and therefore explain the lower impact of %FM on mortality in older subjects(Reference Childers and Allison6).
Strengths and limitations of the study
One strength of the present study is the use of whole-body MRI in a study population covering a wide range of age and BMI. This method allows us to precisely differentiate between truncal SAT and VAT. In addition, we were able to measure volumes of adipose tissue instead of single-slice observations with computed tomography.
The present study has also several limitations. First, this is a cross-sectional rather than a longitudinal study. In addition, the age range of the present study population is limited. The oldest participants were 78 years old, so we could not investigate levels of adipokines or body fat distribution at advanced age. Also, we did not assess habitual physical activity, which may decrease leptin and increase adiponectin levels(Reference de Salles, Simao and Fleck42). We did not assess menopausal status, although sex hormones may have an impact on adipokine levels, and postmenopausal women were shown to have higher adiponectin levels and lower leptin levels than premenopausal women(Reference Marques-Vidal, Bochud and Paccaud12).
The present results indicate that leptin levels should be normalised for %FM only, because body fat distribution has a minor influence on serum leptin. Levels of adiponectin were inversely associated with body fat distribution (SATtrunk in both sexes and VAT%TAT in men). When interpreting differences in adiponectin between people or populations, central fat distribution should be considered.
Although leptin levels are mainly explained by %FM, the age-related decrease in leptin levels in women is partly independent of changes in adiposity. Higher serum adiponectin levels in older men and women occurred despite an age-related increase in VAT and were thus considered independent of alterations in adiposity. The age-related changes in adipokine levels are opposite to each other. They might be due to changes in secretion or clearance and had a positive effect on parameters of glucose metabolism in women.
Acknowledgements
This study was funded by DFG Mü 714/8-3. The authors' contributions were as follows: A. B.-W. and M. J. M. designed the study; M. H. contributed to the MRI protocol; A. P. was responsible for the analysis of the blood samples; A. B.-W. and W. L. were involved in data collection; B. S. was involved in image segmentation; B. S. and A. B.-W. performed the data analyses; B. S., A. B.-W. and M. J. M. participated in the discussion of the data and the writing of the manuscript. There are no conflicts of interest.



