In a system of representation based on population and geography such as the House of Representatives and subsequently the Electoral College, heterogeneity among state population growth rates has demonstrable political consequences. Of particular relevance to political scientists and the political process is the impact that the coming retirement of a generation of unprecedented size, the “baby boomers,” will have on the dynamics of presidential elections. Migration often accompanies retirementFootnote 1 and the combined effects of domestic migration and foreign immigration, which disproportionately affects a limited number of states, will measurably affect the balance of power in the Electoral College. Traditional Democratic strongholds in the upper Midwest, Mid-Atlantic, and Northeast have lost and will continue to lose influence in the Electoral College while rapidly growing Sun Belt states are poised to assume the positions of prominence once enjoyed by states such as Michigan, Ohio, and Pennsylvania.
This project uses statistical projections of the 2010 and 2020 US Censuses to create two Electoral College maps: one covering the presidential elections of 2012, 2016, and 2020, and a second for 2024 and 2028. These maps are combined with state-level estimates of the normal vote based on the last five presidential elections (1992–2008) using a method similar to Lewis-Beck and Rice in their research on the home state advantage for presidential candidates.Footnote 2 Together these data show that the next two censuses will produce Electoral College landscapes that offer net benefits to Republican candidates. Democratic candidates will find it increasingly difficult to win without some non-zero degree of success in Sun Belt states, as Barack Obama achieved in 2008. Conversely Republican candidates, who have performed well in the South and Southwest since the decline of the New Deal Democratic coalition, face the challenge of maintaining support in states with rapidly growing populations, such as Florida, Arizona, Texas, and Nevada. The coming changes are insufficiently large to alter the outcome of one-sided elections but in closely fought races such as 2000 or 2004, the net benefit of approximately eight electoral votes for the GOP is meaningful.
Migrating Boomers and Components of Population Change
Making estimates of the Electoral College in the near future requires an understanding of population dynamics at both the state and national levels. That is, the growth of each state relative to the nation as a whole ultimately determines changes in apportionment and thus the distribution of electoral votes. Demographers have long understood these dynamics by isolating the three components of population change: interstate domestic migration, foreign immigration, and the rate of natural replacement (births relative to deaths) among static population.Footnote 3 There is considerable heterogeneity among states, each having a unique balance of these three factors. But with the decennial Census providing ample data at multiple geographic levels of analysis, it is possible to identify each component and make accurate state-level estimates of population change with a short-to-medium time horizon.
Colloquially, media coverage and analysis of population dynamics focus on the baby boom generation—children of the immediate post-World War II era who will begin retiring en masse between 2010 and 2020. In this narrative, the aging portion of major Midwestern and Northeastern population centers (the “Frost Belt”) will reach retirement age and relocate to the Sun Belt, or warm-winter areas in the South and Southwest such as Florida, Arizona, Texas, and Nevada. The boomers highlight the importance of interstate domestic migration to population balance among states and regions. Census data on net domestic migration (immigrants minus emigrants) by state between 2000 and 2007 show that seven of the ten biggest gainers are Sun Belt states while the list of the ten biggest losers is composed almost entirely of states in the Midwest, Northeast, and Plains.Footnote 4 On this point empirical data largely confirm the conventional wisdom: domestic migrants moving across state lines result in net growth in Sun Belt states at the expense of traditional northern population centers. Given the number of potential retirees in the next decade and the established phenomenon of retirement-driven interstate migration, the trend is expected to continue or intensify as the boomers reach age 65.Footnote 5 It is important to note that existing data do not suggest that boomers are any more or less prone to migrate than other generations.Footnote 6 It is the size of the cohort, not anomalies in its behavior, that will affect the balance of population among states.
Foreign immigration, both legal and undocumented,Footnote 7 is also influential to short-term population dynamics. The Department of Homeland Security estimates that as of 2007 there were nearly twelve million undocumented and nineteen million legal non-US citizens residing in the United States. Of all undocumented immigrants, 51 percent reside in one of four states: California, Texas, Florida, and Arizona.Footnote 8 In comparison the two states outside of the Sun Belt with the highest undocumented immigrant populations, New York and Illinois, combine for only 10 percent of the total. Among legal immigrants and permanent residents, 58 percent of those entering the country between 2000 and 2007 resided in one of five states: California, Texas, Florida, New York, and Illinois. In short, foreign immigration is an important component of American population dynamics but its effects are focused heavily on a small number of states. While some northern states such as Illinois, New York, and New Jersey add substantial numbers of immigrants each year, Sun Belt states such as California, Arizona, Florida, and Texas are magnets for migrants both foreign and domestic.
The final component of population change is the rate of natural replacement, which is simply the number of births relative to deaths in a given population. Nationally, the rate of natural replacement is and has always been positive in the United States. While there is variance among states, rates of replacement for individual states are also positive with one exception. Only West Virginia experienced a “natural decrease” (births < deaths) during the 2000–2007 time period, albeit a very small decrease of −0.5 per 1000.Footnote 9 Because rates of replacement are almost universally positive and clustered in a relatively small range (more than 70 percent of states have replacement rates between 20 and 50 per 1,000),Footnote 10 this component takes a backseat to immigration as a driver of short-term population change. The data show that the effects of replacement are relatively uniform whereas immigration rates vary widely by state. Some states gained more than 100 migrants per 1000 while others experienced net losses due to high rates of emigration.
The combined effects of all sources of population change by state are summarized in table 1. Only two, LouisianaFootnote 11 and North Dakota, actually lost absolute population between 2000 and 2007. It is therefore inappropriate to describe the populations of Frost Belt states as declining or shrinking. Nearly every state is growing; those in the Sun Belt are simply growing at a much faster rate. Heterogeneity of population growth rates among states is the driving force behind the changes in the political landscape in the context of the Electoral College.
Net population change, all sources, by state: 2000–2007

Source: Census 2000 and “Table 4: Cumulative Estimates of the Components of Population Change for the United States, Regions, and States: April 1, 2000 to July 1, 2007” (NST-EST2007-04); author's calculations.
Net Population Change = (Net Domestic Immigration + Net Foreign Immigration + Natural Increase).
Rate calculated as events per 1000 static population at beginning of interval (Census 2000).
Looking Ahead: Census 2010 and 2020
Understanding the components of population change makes it possible to derive accurate estimates of population in the near future based on existing data. An important caveat to population projection is that it reflects current trends but it does not predict future trends. In other words, this exercise is prospective in nature but based on retrospective data. In most cases it is not possible to predict trends that will develop in the future with any degree of accuracy. Events that are currently unforeseeable will ultimately influence the accuracy of these projections. Hurricane Katrina, for example, rendered inaccurate all previous estimates of population growth in Louisiana between 2000 and 2010.
While perfect accuracy is not possible when making projections, Census projections based on contemporaneous data and trends have proven to be reliable over short-time horizons and as predictors of total population for large geographic units such as states.Footnote 12 Literature from demography and human geography supports the short-term accuracy of historical Census population projections.Footnote 13 Long-term predictions suffer from the inherent unpredictability of future rate statistics, notably fertility rates.Footnote 14 Errors in these estimates are compounded over time, drastically reducing the usefulness of fifty- or hundred-year projections. However, short-term predictions tend to be as strong as the current data upon which they are based and suffer less from errors in estimates of future rate statistics. It is easier to estimate growth rates when they can be strongly anchored to current data, as is possible when making ten- or twenty-year projections. Projections in this project are based on the US Census Bureau Interim State Population Projections—2005, Footnote 15 meaning that the population estimates for 2010 and 2020 require only five and fifteen years of projection, respectively.
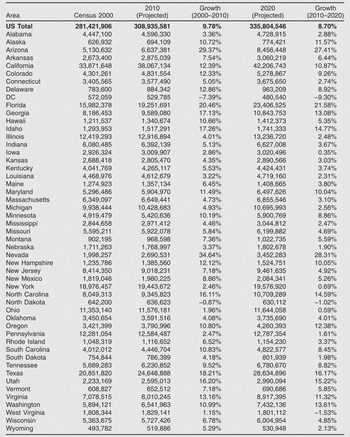
Not only have historical Census projections been proven useful, but contemporary improvements in data quality combined with the use of proven methodology are further increasing the accuracy of current forecasts. Briefly, the Census utilizes a cohort-component method widely used by demographers and population researchers.Footnote 16 This method treats all individuals born in year n as a cohort and calculates rates for all major components of population change—fertility, mortality, and migration—for each age-gender group while continuously updating as new data become available. The technique is useful because it models variance among age cohorts while also recognizing trends that members within each cohort share in common. The data from the ISPP are summarized in table 2. The cohort-component method is simple compared to some examples of recently-developed probabilistic population forecasting methodology,Footnote 17 but a long-running debate in demography literature emphasizes that more complex methods are not necessarily more accurate.Footnote 18
Projections of the total US population by state: 2000–2020

Source: US Census Bureau Population Division Interim State Population Projections—2005, “Table A1: Interim Projections of the Total Population for the United States and States: April 1, 2000 to July 1, 2030”.
Based on these population projections, Electoral College maps are derived using the same methodology used in decennial Congressional reapportionment. Since 1940 Congress has used the Huntington-Hill method to apportion House seats. This method assigns seats by rank-ordering state populations based on a divisor d n representing the inverse of the geometric mean for each additional seat n. A complete description of the methodology is found in the Appendix. Although somewhat cumbersome, Congress has used this method for more than a half-century and, barring legislation in the near future, will use it again in 2011 and 2021.Footnote 19
Normal Vote in Presidential Elections
Putting these Electoral College changes in a relevant political context requires an estimate of the state-level normal vote in presidential elections. While this idea of a “baseline” partisan balance in a given unit of geography is one of the oldest and most familiar concepts in the study of American politicsFootnote 20 it can be difficult to apply to presidential elections. Modern presidential elections are largely personality-driven, with substantial candidate-specific effects which make past results imperfect predictors of future performance.Footnote 21 Nonetheless, estimating the normal vote based on recent results is necessary in a prospective exercise.
There is consensus among existing election forecasting models that previous electoral outcomes, approval of the incumbent president, and current economic conditions are all relevant to accurate forecasting. In this instance it is not possible to predict future economic conditions or public opinion about Obama and the unknown incumbents who succeed him, so a modified version of the normal vote estimate in Lewis-Beck and Rice (Reference Lewis-Beck and Rice1983) is used here.Footnote 22 Those authors suggested using an average of the vote in the past five presidential elections, but two modifications are necessary. First, because of the presence of a significant third-party candidate in 1992 and 1996, the share of the vote received by the Democratic and Republican presidential candidates is not comparable to elections such as 2000, 2004, and 2008, which were traditional two-way races. Accordingly, the estimate used here is of the Democratic share of the two-party vote in each election. Second, for the purpose of making predictions in the near future it is logical to give greater weight to more recent elections—certainly 2008 should be more relevant than 1992 to the context of the 2012 election. Thus the Lewis-Beck and Rice model is modified as a weighted average of the past five elections, with each successive election after 1992 given additional weight such that 2008 is ultimately weighted at 500% of the 1992 results. So, the state-level normal vote is estimated as:

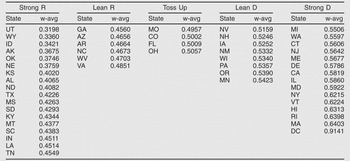
where V a is the normal vote in state a as the Democratic share of the two-party presidential vote in presidential elections from 1992 to 2008; D i and R i are the total number of votes received by the Democratic and Republican candidates, respectively, in year i, and i is an index variable for presidential elections 1 (1992) through 5 (2008). The states were sorted into five groups based on their estimated normal vote, in which higher values represented a greater Democratic share of the two-party vote: Strong R (V a < 0.45), Lean R (0.45 < V a < 0.49), Toss-Up (0.49 < V a < 0.51), Lean D (0.51 < V a < 0.55), and Strong D (V a > 0.55). The normal vote scores and groups are summarized in table 3.
Normal vote as Democratic share of two-party vote, presidential elections 1992–2008

Source data: Federal Election Commission; author's calculations.
Normal Vote calculated as weighted average of the Democratic share of the two-party popular vote in Elections 1992 through 2008.
Assumptions
Using the methods described in the two previous sections requires two assumptions which qualify the results. First, it presumes no major changes in the party system over the time period covered by the projections. If the ideological positions of or coalitions making up the major parties change, normal vote-based estimates will be inaccurate. Second, it assumes no significant changes in the Electoral College at the state or national levels. Currently all but two states, Maine and Nebraska, award Electoral Votes on a winner-take-all basis to the plurality winner of the popular vote. Some states such as Colorado have held unsuccessful referenda recently on altering their winner-take-all systems.Footnote 23 Multiple proposals also exist to alter the entire Electoral College to guarantee the election of the national popular vote winner.Footnote 24 However, no such efforts have been successful and no changes appear imminent at the time of this writing. Rather than attempt to predict changes to an Electoral College system that has proven remarkably resistant to change over time, I will make the assumption of the status quo explicit so that the results presented here can be interpreted in light of any changes that take place during the next five elections.
Additionally, an analysis based on a historical measure of the normal vote may overestimate the likelihood that states will behave in future elections as they have in recent ones. In light of the convincing Obama victory in 2008 some popular commentators have posed questions about whether traditional Republican strongholds in the Sun Belt like Arizona and Texas are trending toward becoming competitive states.Footnote 25 Such arguments are provocative but not well supported. While Arizona and Texas will certainly gain enough new residents by 2020 to alter the balance of an election similar to 2008 in theory—for example, McCain defeated Obama by about 951,000 votes in Texas while the state's population is projected to grow by nearly 8,000,000 by Census 2020—assuming that this growth will alter the partisan balance in the state to the advantage of the Democratic Party is speculative and not well supported by the available evidence.
Existing research on the effects of migration on political behavior has produced three different conclusions, none of which support this argument. One strain of research suggests that political behavior among migrants is shaped by their new environment, mitigating any partisan identification linked to their former states of residence.Footnote 26 Other research has argued that Republicans will benefit in the Sun Belt due to the economic bias inherent in migration.Footnote 27 Those who can afford the costs of relocation and retirement are of high socioeconomic status and therefore presumed to lean conservative. A third argument is that partisanship is fundamentally stable, a function of either one's social identity or core ideological beliefsFootnote 28 and thus unlikely to change with migration. This question of the political behavior of domestic migrants is an important one deserving of more attention in future research. Nevertheless, the argument posed in Todd and Gawiser is interesting but flawed.Footnote 29 If anything, the available empirical evidence suggests that retirement migration will make the Sun Belt less competitive for Democrats, not more so.
Results and Discussion: The Electoral College Post-Census 2010, 2020
The projected changes in the Electoral College after the next two Censuses are summarized in figures 1 through 3. Figure 1 is coded to show the net change in electoral votes for the lower 48 states between the recent 2008 presidential election and 2012.Footnote 30 Figure 2 follows with the net changes between the 2012–2020 elections (figure 2) and the elections of 2024 and 2028. Finally, figure 3 represents the total change between 2008 and 2024.Footnote 31 In these figures the general trend of population movement away from the upper Midwest and Northeast and toward the Sun Belt is clear, with states that are magnets for immigrants and retirees such as Texas, Florida, and Arizona making the biggest gains. Based on the statewide estimates of the normal vote from the previous section, table 4 provides a summary of the partisan balance in the current and future Electoral Colleges.
Projected Electoral College post-Census 2010: presidential elections 2012–2020
Source data: US Census Bureau, Interim State Population Projection—2005, from USCB Population Estimates Program; TerraServer; author's calculations; image created by author in ArcMap 9.2. Alaska and Hawaii experience no change in the projection and are excluded from the image for simplicity.

Projected Electoral College post-Census 2020: Presidential elections 2024–2028
Source data: U.S Census Bureau, Interim State Population Projection—2005, from USCB Population Estimates Program; TerraServer; author's calculations; image created by author in ArcMap 9.2. Alaska and Hawaii experience no change in the projection and are excluded from the image for simplicity.

Cumulative net Electoral College changes, 2008–2024 (Projected)
Source data: U.S Census Bureau, Interim State Population Projection—2005, from USCB Population Estimates Program; TerraServer; author's calculations; image created by author in ArcMap 9.2. Alaska and Hawaii experience no change in the projection and are excluded from the image for simplicity.

Distribution of Electoral College based on estimated normal vote: Post-Census 2010 and 2020

Source: US Census Bureau, Federal Election Commission; author's calculations.
The results show that the proportional decline of traditional Democratic strongholds such as New York, Illinois, Pennsylvania, and the smaller states of New England will decrease the value of Strong Democratic states by seven electoral votes and Lean Democratic states by two after Census 2020. Conversely, states that are either Strong or Leaning Republican will gain eight electoral votes (with the ninth ex-Democratic vote representing a net gain among the four Toss-up states). While not all states that are expected to gain electoral votes during this time period are favorable turf for the GOP, the net gain of eight electoral votes between Arizona and Texas alone provides the party's candidates an advantage equal in value to a medium-sized state. No Republican candidate has lost Arizona or Texas in a two-way race since 1976.Footnote 32
Two states in the Toss-up category, Ohio and Florida, were among the most fiercely contested states in the three most recent elections. The states' populations are heading in opposite directions, with Florida gaining electoral votes more rapidly than Ohio is shedding them. These two states (along with Missouri and Colorado) show no clear advantage for either party based on the measures used here and are likely to remain very competitive in 2012 and beyond. Among the group, however, the relative value of Florida is set to increase rapidly, gaining five electoral votes before the 2024 election due to the combined effects of foreign immigration and an influx of retiring boomers. The political allegiances of these new residents will be crucially important to both parties in Florida's competitive electoral landscape.
A normal vote-based analysis is admittedly an imperfect estimate of future electoral outcomes, which will depend not only on past results but also on candidate- and context-specific effects, which are inherently unpredictable. Furthermore, the changes described here are insufficient to affect the outcome of uncompetitive races. Nonetheless the shift in population toward states in which Republicans traditionally do well will influence highly competitive elections similar to 2000 or 2004. To put the projected change in context, the nine electoral votes that the Democratic-leaning states will shed are equal in value to Colorado. In a true struggle to reach 270, future Democratic candidates will need to find an additional state to win to make up for losses in their traditional strongholds.
The coming redistribution of the American population will present challenges to candidates of both major parties. For Democratic candidates, the challenge is to become more competitive in the rapidly-growing Sun Belt states. The West Coast, New England, and upper Midwest will not be sufficient to win elections. Democrats must have at least modest success in the South and Southwest to win close races. For the GOP, the challenge will be to hold their ground in the Sun Belt as new voters from other areas of the country immigrate to key states like Texas, Florida, Nevada, and Arizona. The political environment in these states will be affected by an influx of northern retirees whose political attitudes and allegiances will differ from the established population. Nowhere will this be more important than in Florida, where a simple population pyramid shows that the migration of New England and Mid-Atlantic retirees will make individuals over the age of 60 the dominant age-demographic in the state.Footnote 33 Political science research, as discussed earlier, has provided conflicting arguments about how migration will affect the political environment of fast-growing states, variously concluding that it will have no impact or will benefit one party. This is a question in need of further research; understanding the political behavior of domestic migrants will be crucial as the aging American population moves into retirement.
Summary
This article presents evidence that the victories Republican presidential candidates currently enjoy in states like Texas and Arizona are about to become more valuable. In the next twelve years, two Censuses will affect apportionment and subsequently the Electoral College in ways, based on the current political landscape, that benefit Republican candidates. The available data support the common wisdom about the coming retirement of the baby boomers and its effect on the distribution of the American population. Frost Belt states—the Upper Midwest, Northeast, and Mid-Atlantic—will lose representation and electoral votes to rapidly-growing Sun Belt states such as Florida, Texas, and Arizona. By the presidential election of 2024 Republican candidates will receive a net benefit of at least eight electoral votes compared to 2008 due to the proportional loss of population in states like New York, Michigan, and Illinois. While no states are expected to experience an absolute loss of population, Sun Belt states, as magnets for both domestic and foreign migration, will simply grow much faster than states in other regions. Democratic candidates will need to have some success in the Sun Belt, which post-New Deal Democrats have often struggled to do. Republican candidates will be challenged to hold their ground in the South as millions of retirees flee the weather, but perhaps not the partisan tendencies, of northern states.
Appendix
The Huntington-Hill method assigns seats by rank-ordering state populations based on a divisor d n representing the inverse of the geometric mean for each additional seat n. The geometric mean differs from the arithmetic mean, a distinction which is important for “rounding up” to the next seat. An arithmetic mean between any two consecutive whole numbers is simply [n + (n + 1)]/2, whereas the geometric mean is the square-root of the product of the upper and lower bounds or
 . Using the inverse of this mean produces a divisor for each additional House seat for a given state after each has been given the one automatic House seat mandated by the Constitution. Divisors d n are calculated for a range of values n representing the lowest and highest number of seats a multi-district state might be expected to receive. In this project, the range of n is (2, 60). So:

where
P i = population of state i in the base year of apportionment
n = range of values representing the number of seats state P i would have if it gained a seat over a range of (2, 60)
jx = the next available House seat after each state has been awarded the Constitutionally-mandated minimum of one seat, giving a range of (1, 385) in a House of 435.
The population of each state P i is divided by the divisor d n for all values of n between 2 and 60. The resulting 2950 products (50 states x 59 values n) are then ranked in descending order with the largest value receiving the 51st House seat and so on until the 435th and final House seat is awarded. For example, in projections for 2010 the 51st House seat was awarded to California using this method, the 52nd to Texas, the 53rd to California, and so on until the 435th and final seat was awarded to Georgia.