INTRODUCTION
There is widespread consensus among development actors that Africa needs a ‘Green Revolution’ in order to feed its growing population and reduce rural poverty. The African Union's Maputo Declaration in 2003 committed governments to allocate at least 10% of national budgets to supporting agriculture, in an effort to improve food security and reduce poverty on the continent. Supporting this prioritization of agriculture, the Alliance for a Green Revolution in Africa (AGRA) bases its strategy on the principle that technological improvements in agriculture and value chains will lead to increased agricultural productivity for smallholders, assuming that this in turn will lead to widespread economic development and reductions in poverty (Toenniessen et al., Reference Toenniessen, Adesina and DeVries2008). The United States Government's Feed the Future program similarly focuses on improved agricultural technologies for sustainable intensification to ‘end hunger and poverty’ (USAID, 2011).
Like the first Green Revolution, its African counterpart was to be based on the development and dissemination of new technologies, adapted to the various agroecologies of the continent. However, while the Maputo Declaration made agriculture a priority of national governments, the prevailing neoliberal political and economic climate led to an emphasis on private sector involvement in agricultural development, from input provision to extension services, and reduced state subsidies and other support to farmers. Thus, in contrast to the first Green Revolution, during which state support of agricultural research and development was prominent, this African Green Revolution increasingly relies on donor organizations and the private sector. The increasing emphasis on the private sector, along with increasing concern for environmental impact and an emphasis on participatory approaches, has contributed to increasing contestation in agronomy (Sumberg et al., Reference Sumberg, Thompson and Woodhouse2013).
Agricultural development projects in the tradition of the Green Revolution perceive low productivity of smallholder agriculture as a largely technological problem (Sanchez et al., Reference Sanchez, Denning and Nziguheba2009; Toenniessen et al., Reference Toenniessen, Adesina and DeVries2008). This leads them to seek broadly applicable technology-focused solutions from agricultural research—such as improved crop varieties and ‘best practice’ fertilizer application methods and rates. The African version has been accompanied by a focus on smallholder farmers’ integration into private-sector value chains (AGRA, 2015; USAID, 2011). A more nuanced view sees smallholder agriculture as embedded in and inseparable from complex rural livelihoods. Farmers make decisions not only based on yield and profit margin, but try to meet a complex set of objectives shaped by diverse social pressures, ranging from local traditions to recommendations by government agencies or changes in commodity prices on a regional or global scale (Koenig et al., Reference Koenig, Diarra and Sow1998). For example, the introduction of cotton to the Kita area of Western Mali by the parastatal ‘Compagnie malienne pour le développement du textile’ (CMDT) represented a substantial upheaval in the political, social and even physical environment. Because the CMDT was conceived as not only a cotton enterprise but also a rural development organization, upon its arrival in Kita CMDT agents organized village credit associations, began providing functional literacy training and improved road infrastructure (Koenig, 2008). Farmers engaged in cotton cultivation as much out of a desire to access these secondary CMDT services as because they saw cotton as their most profitable option. Given these additional roles that cotton plays in farmers’ livelihoods, the recent decline in cotton yields in some areas of southern Mali can be linked both to local, physical causes and to a casual chain encompassing tensions within local cooperatives (Lacy, Reference Lacy, Moseley and Gray2008), the withdrawal of secondary services by the CMDT and international financial institutions that encouraged privatization and restructuring of the CMDT (Serra, Reference Serra2014). Political ecology, by focusing on these types of causal chains, identifies the ways extra-local political economic drivers shape farmers' decision making (Blaikie, Reference Blaikie1989). Political ecology analyses also open problem identification and definition to questioning, by recognizing that environmental management is by its very nature contested, by people and groups who may define problems very differently (Blaikie, Reference Blaikie1995; Fabinyi et al., Reference Fabinyi, Evans and Foale2014).
Natural scientists have often used a framework and vocabulary of system dynamics to analyse socio-ecological systems, including farming systems (Collinson, Reference Collinson2000; Crane, Reference Crane2010; Darnhofer et al., Reference Darnhofer, Gibbon, Dedieu, Darnhofer, Gibbon, Dedieu, Darnhofer, Gibbon and Dedieu2012; Giller et al., Reference Giller, Rowe, Deridder and Vankeulen2006). Agronomists (among others) have used this framework to consider the effects of larger social, economic and political forces on farmers’ constraints and opportunities (Fabinyi et al., Reference Fabinyi, Evans and Foale2014). However, the simplification inherent in system dynamics-based models and analyses often fails to account for human agency, resulting in highly mechanistic and depoliticized representations (Crane, Reference Crane2010). The concept of a ‘socio-ecological niche’ has been used to recognize the social factors in which farming systems are embedded. The term was first used by ethnographers to describe cultural behaviour in terms of relationships within the human (social) and biotic (ecological) community (Frake, Reference Frake1962). It has come to be used by agronomists, including to describe the physical environment and social conditions for which a given crop variety is suited (Brush et al., Reference Brush, Corrales and Schmidt1988), and to match technical options with the farmers who are best placed to use them (Descheemaeker et al., Reference Descheemaeker, Ronner, Ollenburger, Franke, Klapwijk, Falconnier, Wichern and Giller2016; Ojiem et al., Reference Ojiem, De Ridder, Vanaluwe and Giller2006). Defining a socio-ecological niche can be a helpful tool for tailoring agronomic research, by ensuring that research is directed in ways that meet farmers’ objectives within both their ecological and social frameworks. Defining these niches requires inter-disciplinary research to understand farm-level physical dynamics (Falconnier et al., Reference Falconnier, Descheemaeker, van Mourik and Giller2016), interactions between agriculture and off-farm income sources within the household (Haggblade et al., Reference Haggblade, Hazell and Reardon2010), as well as the ways farm households interact with their surrounding environment at different scales. It also requires the inclusion of smallholder farmers in research processes, as they are the only ones who can truly speak to the ‘appropriateness’ or usefulness of a technology. Participatory methods have for years been advocated as a means to engage smallholder farmers in technology development processes, in part as a means to better identify and address their concerns (Chambers and Ghildyal, Reference Chambers and Ghildyal1985; Sumberg et al., Reference Sumberg, Thompson and Woodhouse2013). However, the socio-cultural drivers and incentives that shape scientists’ actual practices in the context of participatory technology development have rarely been critically examined as factors that explain outcomes (Crane, Reference Crane2014; see also de Roo et al. in this issue for an example of where this has been done effectively).
Participatory and inter-disciplinary research centred on fitting technologies to local context does not lend itself to projects with pre-determined pathways such as ‘sustainable intensification’ and which aim for continental or global-scale results. Nevertheless, agronomists, development agencies and donors tend to use a set of common themes when arguing for the importance of agricultural research in developing countries: the need to narrow yield gaps in order to feed a growing population (Pretty et al., Reference Pretty, Toulmin and Williams2011; Tilman et al., Reference Tilman, Balzer, Hill and Befort2011), or that improving the productivity of smallholder farmers will reduce poverty in rural areas (Denning et al., Reference Denning, Kabambe, Sanchez, Malik, Flor, Harawa, Nkhoma, Zamba, Magombo, Keating, Wangila and Sachs2009; Sanchez et al., Reference Sanchez, Denning and Nziguheba2009). While there is some macro-level evidence that improving agricultural productivity can reduce rates of absolute poverty (Christiaensen et al., 2011), Harris and Orr (Reference Harris and Orr2014) have shown that even the best technologies for staple crop production are rarely sufficient to lift smallholder farming households above the poverty line. Agronomists thus find themselves in an invidious position. Research priorities are defined by states or international bodies who prioritize specific technologies or pathways and direct funding accordingly, but the results of agronomic research are meant to be applied by smallholder farmers, who have their own priorities and agendas which do not necessarily align with those of funders. Agronomists, as a group, possess a wide range of political opinions, professional skill sets and personal inclinations, and their agency as actors in the system cannot be discounted. However, the political bodies that set development priorities and funding organizations that determine how and where research investments flow represent the institutional context within which particular approaches and modes of engagement, as well as individual agronomists, are evaluated, rewarded or marginalized, even shaping they ways that research is conceptualized and operationalized (Crane et al., Reference Crane, Pronk, Lakerveld, Weiler, Maat, Springate-Baginski and Udo2016). As such, they establish clear pathways of upward accountability regardless of farmers' priorities and evaluation criteria. Agricultural researchers interested in contributing to development outcomes must therefore walk a thin line between the often-conflicting goals of diverse stakeholders, with whom they have markedly different power relations.
We use the case of Bougouni district, in southern Mali, to explore the limitations of agricultural research for development, which was based on technology transfer and had focused on specific and limited sets of possible interventions. The relative ineffectiveness of sustainable intensification options in changing household poverty and food self-sufficiency status, which we demonstrate here, underlines the need for researchers, donors and policy makers to move beyond the conception of low productivity as a technical problem with standardized, widely applicable technical solutions. Instead, low agricultural productivity is best treated as embedded in socio-ecological systems, implying the need for an interdisciplinary and farmer-focused research process both to define problems and to find solutions.
Southern Mali has long been a key agricultural production zone, both for cotton, Mali's second largest export after gold (Simoes et al., Reference Simoes, Landry, Hidalgo and Teng2015), and for cereals. Increasingly, as land becomes scarcer in the ‘old cotton basin’, expansion of agriculture to meet growing food needs is occurring in the west and southernmost part of the country, including the district of Bougouni. Bougouni forms part of the sparsely populated Guinea Savannah zone that the World Bank described as ‘Africa's Sleeping Giant’, a potential engine of economic growth because of its high-agroecological potential and low population density (Morris et al., Reference Morris, Binswanger-Mkhize and Byerlee2009). For this to happen, agricultural production would need to increase markedly. This could happen by means of large commercial ventures or through increasing the production of smallholder farmers, and while both options potentially contribute to economic growth, smallholder-led growth is generally considered to result in a more equitable distribution of benefits (Ollenburger et al., Reference Ollenburger, Descheemaeker, Crane, Sanogo and Giller2016). In part because of its assessment as a high-potential area, Bougouni forms a priority research zone for the Feed the Future project in Mali, itself a high priority country for both Feed the Future and AGRA. The Malian government is largely concerned with increasing staple crop production to improve national food security, and increasing cotton production as an important source of state revenue. A variety of projects have introduced options for ‘sustainable intensification’ which, as generally defined, refers to increasing productivity on existing land while protecting the natural environment (e.g. Godfray et al., Reference Godfray, Beddington, Crute, Haddad, Lawrence, Muir, Pretty, Robinson, Thomas and Toulmin2010; Pretty et al., Reference Pretty, Toulmin and Williams2011). Donors are also concerned with improving human nutrition and increasing smallholder incomes, expanding the notion of sustainability beyond the environmental dimension (USAID, 2011). These projects turn to agricultural research to provide ‘best bet’ technologies that larger-scale projects can promote to meet their development goals.
Where agricultural intensification has occurred, it is either because conditions make intensification economically attractive (Netting, et al., Reference Netting, Stone and Stone1989) or because land is no longer available for expansion and farmers must intensify to feed their families (Boserup, Reference Boserup1965). Bougouni district's low population density means that the second condition is not a major factor in farmer decision-making. In order for intensification options (sustainable or otherwise) to be adopted, they must fit into this socio-ecological niche, characterized by land abundance as well as alternative sources of income. Thus, it is important to understand how the benefits of intensification compare to potential gains from other activities. We explore the potential benefits of agricultural intensification by defining a ‘solution space’ for agricultural development in Bougouni. The idea of a solution space is borrowed from the mathematical definition: the set of possible solutions to (typically) an optimization problem. The concept has been applied to agricultural modelling to describe the set of outcomes possible via improving management practices, closing yield gaps, or eliminating inefficiencies (Groot and Rossing, Reference Groot and Rossing2011). In our case, we identify the solution space for intensification by evaluating the possible impact of closing yield gaps and optimizing land use for maximum profit. We then compare this to other options, including land expansion. As indicators, we use household food self-sufficiency and incomes, because these are stated goals of smallholder farmers in Bougouni and allow us to consider impacts on the development goals of national food security and poverty reduction. The ability of sustainable intensification options that are outcomes of agricultural research to meet the, sometimes contradictory, development goals of farmers, donor organizations and the state has important implications for the role of agricultural research in development, and in turn how agronomists can engage practically in solutions-oriented research.
METHODS
Study area
Bougouni district, located in southern Mali, has a population density of approximately 24 people per km2. Our study sites are the villages of Flola, Sibirila and Dieba, to the west of the town of Bougouni (11.54°N 7.93°W–11.42°N 7.62°W). They range in size from 500 inhabitants in Flola to 1200 in Dieba. Cropping systems are organized around cotton–maize rotations introduced and promoted by the CMDT, which has monopoly control of cotton seed distribution and the purchase of cotton. Cotton prices are fixed at the beginning of the growing season, and farmers can access credit for cotton and maize inputs through village-level cooperatives. Farmers in this area generally follow one of the two strategies described by Koenig et al. (Reference Koenig, Diarra and Sow1998): either they use agriculture as a source of both food and cash income, or they rely on agriculture for food while seeking other income generating opportunities. While it is notoriously difficult to estimate off-farm income accurately, previous studies in the area suggest that most families rely on at least some off-farm income, most commonly from local small shops or from remittances from family members working most often in seasonal employment elsewhere in Mali (Howard et al., Reference Howard, Azzarri, Haile, Comanescu, Roberts and Signorelli2016).
Scenario development
In order to explore the solution space for staple crop agriculture, we evaluate the impact on food self-sufficiency and gross margin of three intensification levels, represented by typical yields, best farmer yields, and attainable yields. Typical and best farmer yields were defined as median and 90th percentile yields from household surveys in the area. Attainable yields represent ‘the maximum yield achievable by resource endowed farmers in their most productive fields’ (Tittonell and Giller, Reference Tittonell and Giller2013), for which we use yields from researcher-managed trials following best management practices. Yields at each intensification level are combined with three land use scenarios: (i) current crop allocation; (ii) crop allocation optimized for maximum gross margin; and (iii) optimized crop allocation plus a 50% expansion in cultivated land, resulting in nine different crop production scenarios. Three scenarios for input and output prices are considered for each crop production scenario: current average prices, estimated average prices with removal of fertilizer subsidies, and selling produce at peak prices. Two types of integrated crop-livestock production options are also considered: sale of sheep, and milk production with stall-feeding in the dry season.
All 109 farms in the study villages were characterized based on a census of family size, herd size and land allocations by crop. Data were collected with the assistance of CMDT field agents. These field agents already collect such information for a subset of farmers and crops, including GPS measurements of some cotton fields, and were thus familiar with both the procedures and the village inhabitants. Additional information regarding farmer priorities, crop and livestock management practices, and off-farm activities was gathered in focus group meetings and informal discussions over a three-year period of field research. We followed the CMDT definition of a farm household or ‘Unité de Production Agricole’: a group of people who manage land together. Because Malian farm families are often multi-generational and polygamous, these households range greatly in size, from 3 to 86 household members in the study villages. The impact of each scenario was calculated not for a set of ‘representative’ farms or farm types, but for each individual farm in the study area. Using representative farms reduces the variability of a set of farms by assuming that outcomes are relatively homogeneous for farm types defined ex-ante. Analysing each individual farm allowed us to explore the effect of farm characteristics without pre-defined ideas of which of these characteristics would have explanatory power, and could therefore provide greater insight into the variability of outcomes.
Crop intensification scenarios were developed using data on yields and input use from two sources. The first was the AfricaRISING Mali Baseline Survey (ARBES), conducted in 2014 for 700 households in eight villages in Bougouni district, including some households in the study villages (Howard et al., Reference Howard, Azzarri, Haile, Comanescu, Roberts and Signorelli2016). The second was a detailed household characterization survey covering 19 households in Sibirila and Dieba, which we conducted in December 2013. We used median yields from these sources as typical farmer yields for our scenarios, and 90th percentile yields as best farmer yields. Gross margins were calculated using reported costs of production from the ARBES survey, including fertilizers, seed, pesticides and any other costs, but excluding family labour. Gross margins per capita can thus be considered an economic return to family labour. Median yields were assumed to incur median input costs, while 90th percentile yields were assumed to incur 75th percentile input costs. Because spending on inputs and yield were only loosely correlated, we assumed efficient input use for the best farmer yield scenario. We used data from the researcher-managed trials in the area conducted by the International Crops Research Institute for the Semi-Arid Tropics (ICRISAT) to determine values for attainable yields and the associated input costs for groundnut, sorghum, millet and cowpea. Technical briefs from the Malian Institute d'Economie Rurale (IER) were similarly used for cotton and maize. These trial yields are taken to represent the current best practices from available research.
We used a linear programming model to optimize cropland allocation in order to maximize gross margins at each intensification level subject to certain constraints. First, the household was required to grow enough grain (rice, maize, sorghum or millet) to achieve at least 80% of its caloric needs. If this could not be attained, the household maximized food self-sufficiency instead of gross margins. To calculate caloric needs, we estimated adult equivalents as a fraction of the total household size based on the detailed characterization survey, then used data from FAO (2001) for calorie needs. The second constraint was based on CMDT policy, which provides subsidized fertilizer on credit sufficient for up to two hectares of maize for each hectare of cotton they cultivate. Maize could be grown without fertilizer, but would face a severe yield penalty, so farmers prefer to grow sorghum if they cannot access fertilizer for maize. We have assumed this practice to be universal to simplify our calculations. The third constraint was to maintain total cropped area constant, except for the land expansion scenarios, which are based on a 50% increase over the current land area. Because the areas used for rice are distinct from those used for other crops, rice areas were excluded from optimization and maintained constant even in cropland expansion scenarios.
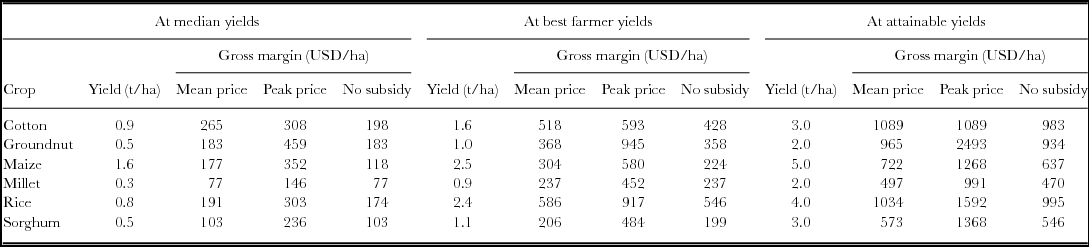
Market price data were collected monthly for one year (September 2014–September 2015) by IER agents in the study area. We explored effects of three price scenarios, including average prices for crops, a scenario in which the CMDT no longer offers subsidized fertilizer and credit to cotton growers, and a scenario using peak prices. The scenario without fertilizer subsidies used 58% higher fertilizer prices, which reflects the price difference between subsidized fertilizer purchased—usually on credit—through the CMDT and open market fertilizer prices (Africa Fertilizer, 2017). Since the CMDT controls both input prices and cotton prices, this scenario could also affect cotton prices. However, in our model, we left cotton prices constant due to lack of relevant data, disregarding the fact that the producer price for cotton has been judged as too high (International Monetary Fund, 2006). Therefore, the cotton price and gross margin are likely to be less favourable than we describe here. Since inter-annual price variability (FAO, 2017) was less than intra-annual variability, we used annual peak prices as recorded in the local market price data to calculate revenue and gross margin in the peak price scenario. Yields and gross margins used in each scenario are listed in Table 1.
Parameters used in crop scenarios.

Estimates of animal production were based on cattle numbers (divided into draft animals and other cattle) and small ruminant numbers (sheep and goats combined) from the farm census. Current herd composition and offtake rates were estimated from the ARBES and detailed characterization data. For the first livestock scenario, sheep reproduction rates of 1.9 lambs per female per year were taken from a monitoring study by Wilson (Reference Wilson1986) in Central Mali. Such high reproduction and offtake rates can be considered a ‘best farmer practice’ option. Input costs were limited to proper veterinary care at US$4 per animal plus US$14 fixed costs for the herd per year. As there are sufficient graze and browse resources around these villages throughout the year, supplemental feeding is not required. The second scenario of milk production was based on models of lifetime productivity of dairy cattle in the nearby district of Koutiala (de Ridder et al., Reference de Ridder, Sanogo, Rufino, van Keulen and Giller2015). Stall-fed cows consumed a total of 300 kg of cowpea hay and 240 kg of cottonseed cake during the stable feeding period of March–June, when calving usually occurs and when feed resources are most limited. Following de Ridder et al. (Reference de Ridder, Sanogo, Rufino, van Keulen and Giller2015), veterinary costs were $5 per cow, while cottonseed cake costs were $45 per cow per year. Gross margins for livestock scenarios were calculated at current herd size and then with a 50% increase in the current number of sheep or cattle, depending on the scenario. In the increased herd size scenarios, farms without animals were assigned a number of sheep or cattle corresponding to the average of the families in the same farm size class, multiplied by 1.5. Size classes were defined by the amount of cultivated land, because herd size is closely correlated with cultivated area, as follows: 0–5 ha, 5–9 ha, 10–14 ha, 15–19 ha, 20–24 ha, and ≥25 ha.
Market price data for livestock products came from the same monthly market surveys as crop price data. We averaged prices for milk because these prices do not vary much over time. As sheep prices vary strongly throughout the year, we compared gross margins obtained with the average price over the year (US$100 per head) and with the peak price commonly obtained prior to the Muslim festival of Eid al Adha, known in the region as Tabaski (US$130 per head). Prices increase just before Tabaski because it is customary for families to purchase a ram to slaughter for the festival. Because animal production is currently not subsidized, we did not include a subsidy removal scenario here. For cattle supplementation, we estimated the fodder requirement in cowpea or groundnut haulms, and assumed these are interchangeable. In the study villages, fodder markets are essentially non-existent, and transportation to towns where such markets do exist is difficult and expensive, so we assigned zero cost to fodder produced on-farm. This presumes some integration between crop and livestock components of the farm, so we considered two combined scenarios of crop and livestock production, for both cattle and small ruminants: optimization at best farmer practice (90th percentile) yields and mean prices, and optimization at best farmer practice with peak prices, both on current land areas. The first scenario assumed most land is devoted to cotton. The most economical option for producing fodder is by growing groundnut, as the grain can still be sold, so an area of cotton was converted to groundnut, in order to produce 300 kg of haulms per cow. At peak prices, land was allocated to groundnut anyhow, so the second scenario of combined production did not require a change in crop production.
We compared gross margins from the agricultural scenarios to the World Bank's absolute poverty line of US$1.90 per person per day at purchasing power parity. We used five-year averages (2010–2015) for both PPP and market exchange rate conversions (from http://data.worldbank.org) to calculate an annual value of US$250 per person as the absolute poverty line for Mali. We also compared farm earnings with the average income from gold mining (US$1225 per person per year) from a nearby village where mining is common (Ollenburger et al., Reference Ollenburger, Descheemaeker, Crane, Sanogo and Giller2016). Other income sources common in the area include small shops and family businesses, remittances, and sale of firewood and charcoal, whose potential per capita incomes ranged from $600/year in the case of firewood sales to $1800/year in the case of family businesses (Howard et al., Reference Howard, Azzarri, Haile, Comanescu, Roberts and Signorelli2016).
RESULTS
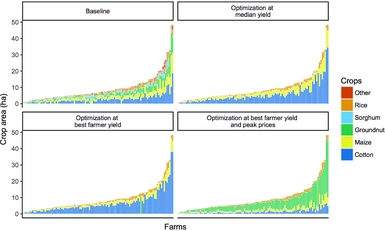
Cropping systems are currently diverse (Figure 1). Cotton, maize and groundnut occupy most of the cultivated area, complemented by other crops including rice, sorghum and millet. In the optimization scenarios, crop allocation results in enough maize to meet family food needs, enough cotton to procure the inputs for maize, and the rest of the land allocated to the most profitable crop (Figure 1). This is cotton in all intensification scenarios given average prices, with groundnut becoming more profitable when sold at peak prices, when groundnut prices are double the yearly average. The resulting cropping patterns should not be considered a projection of future land allocation, because farmers use multiple criteria for crop allocation decisions. Rather, it simply represents the crop allocation that maximizes gross margins while attaining food self-sufficiency.
Land allocation to each crop in four scenarios. Farms are ordered by total land area. Other crops (orange in the baseline scenario) include sorghum, millet, fonio and cowpea. Optimization scenarios are based on maximization of gross margins after accounting for 80% of the household's required calories from staple grains (maize, sorghum, millet and rice).

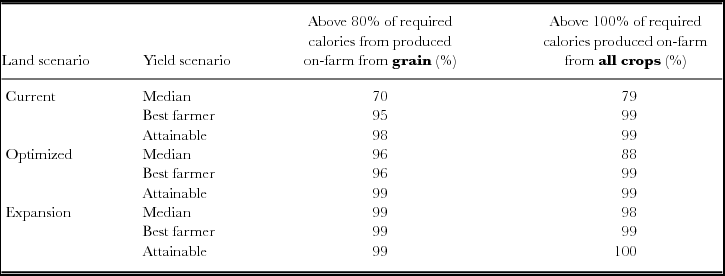
Most households (70%) produce enough grain to be self-sufficient in staple food, even in the median yield scenario (Table 2). Of the 25 farm households which are not food self-sufficient at median yields, seven are large households (35–80 people), with large herds (27–78 TLU) but relatively little land on a per-capita basis. These farm households likely have other resources to ensure they are food secured. The remaining 18 farms are smaller than average households, with smaller than average cultivated area on both a per capita and absolute basis, and few animals. Improving yields to best farmer levels reduces the number of non-self-sufficient households to below 1% (1 household in our 109-household sample), while optimizing crop allocation at current yields leaves only 13 farming households non-self-sufficient: 3 large, and 10 small households.
Village-level food self-sufficiency in crop production scenarios.

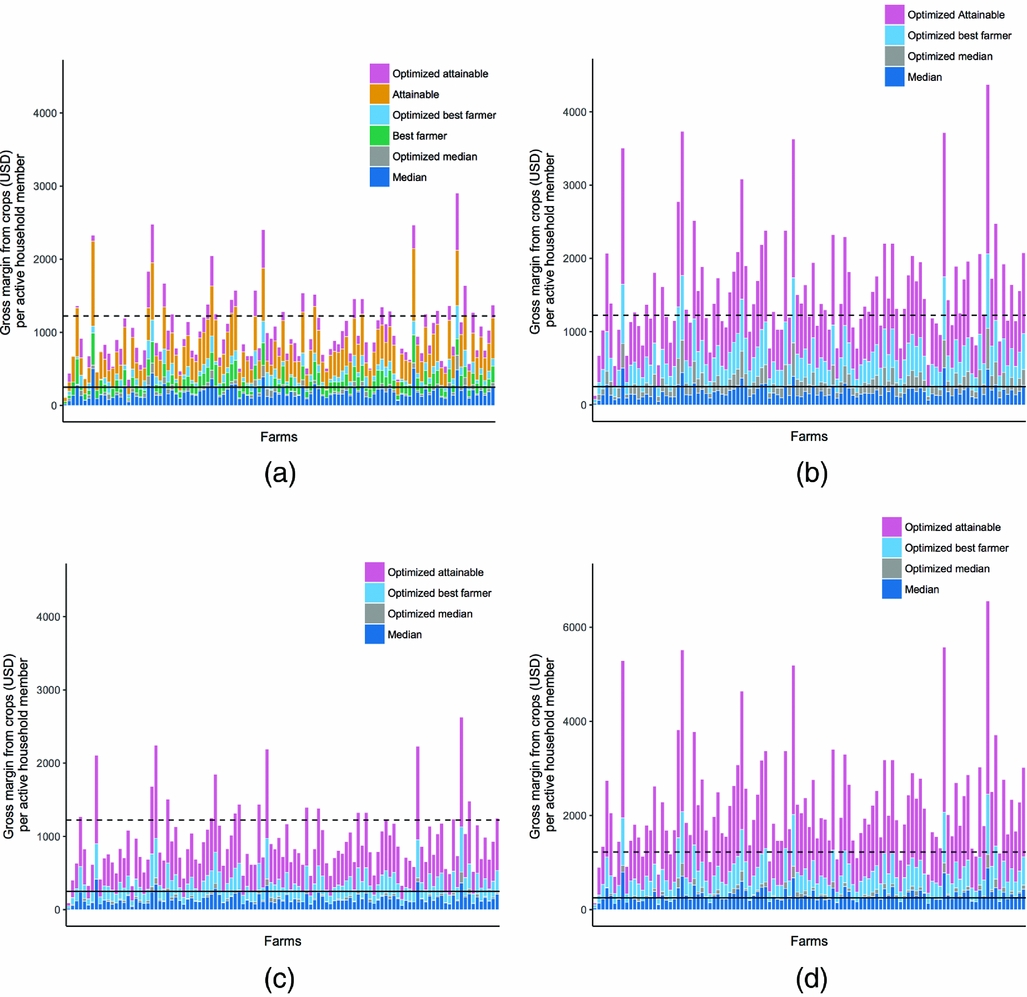
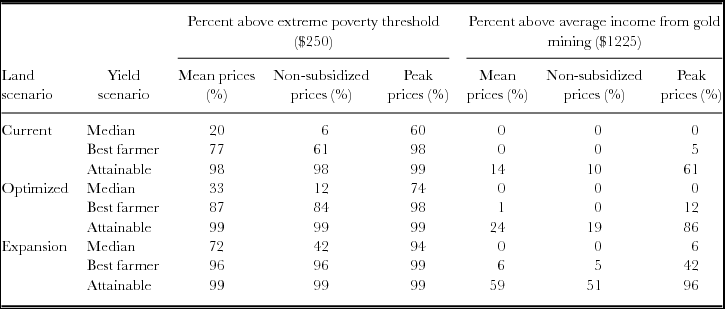
By contrast, incomes remain low. Gross margins per capita are not correlated with farm size (Figure 2), in large part because farm size is closely correlated with household size. Thus, while larger households have more total income, this income is divided among a large number of active household members. At median yields, gains from cropland optimization are minimal, indicating that farmers are operating near maximum profits. Gains from optimization increase with larger yields. At mean prices, attaining best farmer yields dramatically reduces the number of farms below the extreme poverty line, but cropland expansion has even greater benefits. Less than one quarter of farms have per capita gross margins higher than the US$1225 level attainable from gold mining until maximum attainable yields (Table 3). The farms that do best are largely the same in all yield, land and price scenarios, although differences in initial crop allocation explain some of the variation in the relative gain from optimizing crop area allocation. In general, households with larger landholdings per capita perform best, but the group of most profitable farm households is still diverse: household sizes range from 2 to 65 people, land sizes from 1.5 ha to 48.5 ha, and herd sizes from zero to 114 TLU. The effect of prices is notable. At median yields 20% of farmers earn enough to exceed the extreme poverty threshold at mean prices. This drops to only 6% if subsidies are removed. The impact is greater at lower yield levels; median gross margin at median yields drops from $195 per person in the mean price scenario to $149 without subsidies—a 24% drop from an already low baseline. In contrast, at peak prices 60% of farms exceed the extreme poverty threshold even at median yields. At peak prices and attainable yields, groundnut production can be highly profitable: 25% of farms have gross margins above $2600 per person per year.
Income from crop production, per active household member. Farms are ordered as in Figure 1; note that income per capita is not correlated with farm size. The solid line represents the World Bank's extreme poverty line of US$1.90 per person per day at purchasing power parity, equivalent to US$250 per person per year at market exchange rates. The dashed line is the average income from gold mining (US$1225/person/year), the most profitable off-farm activity reported in the area. (a) Profits with intensification and optimization on current land area. (b) Profits with intensification and optimization of land use on 150% of current cropped area. (c) Profits with intensification and optimization on current land area at non-subsidized input prices. (d) Profits with intensification and optimization on current land area when crops are sold at peak prices.

Percentage of households in three study villages meeting poverty thresholds (US$/person/year) in crop scenarios.

US$250 per person per year is equivalent, at market exchange rates, to the World Bank's extreme poverty line of US$1.90/person/day at purchasing power parity.
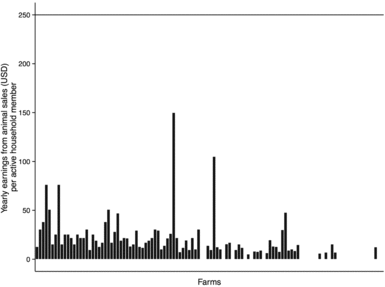
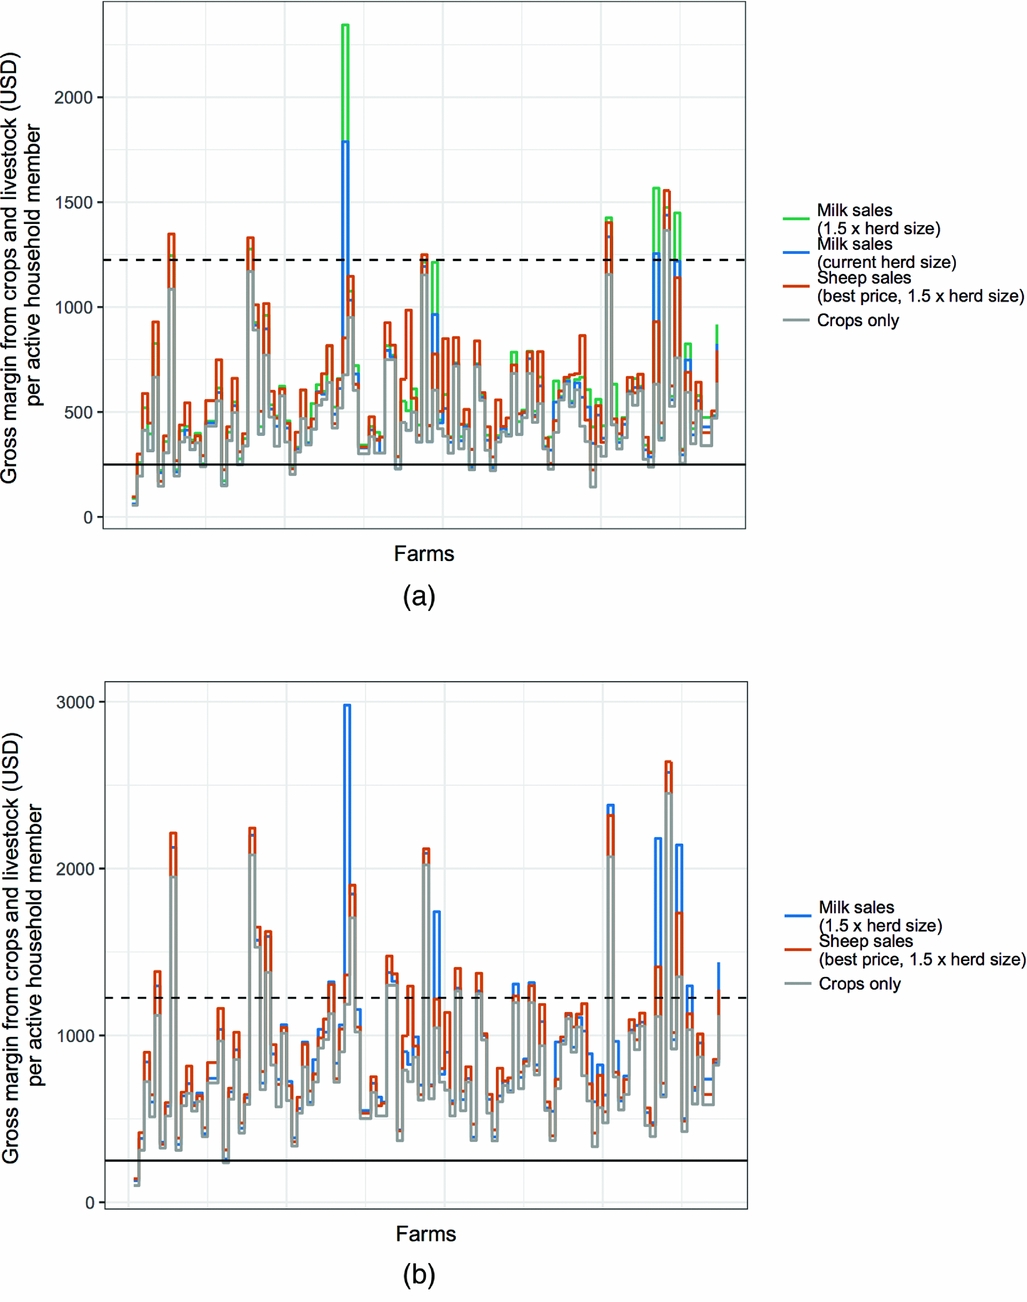
Current incomes from livestock are extremely small (Figure 3). While other areas in Mali count substantial populations of pastoralists, in the study villages all inhabitants are Bambara agriculturalists, whose animals are primarily for traction as well as investment and savings. Milk production is essentially zero: our survey results and focus group discussion revealed that herders may milk a few animals for their personal consumption, but milk is neither regularly consumed nor sold. Animal sales are rare, and most commonly heads are sold to cover either expected or emergency household expenses (ILRI, 2011). The combined crop-livestock production scenarios can, however, provide important sources of additional income. At current herd sizes and mean prices these contributions are small, except for a few households with large numbers of cattle (Figure 4a). However, because of strong demand around Tabaski, sales of sheep during this peak period can provide significant income. When herd sizes increase, this becomes an even more profitable option. Milk production, for those families with large herd sizes, can also be profitable, although at mean prices re-allocation of cotton to grow groundnut for fodder comes with substantial opportunity cost, reducing overall profits somewhat (Figure 4a). With peak prices land optimization already allocates land to groundnut, so that groundnut haulms can be used for dry season feeding at no additional monetary cost—though this requires labour for collection and proper storage. This scenario produces sufficient groundnut haulms for cattle feeding for all households in the case of current herd size, and all but one in the case of a 50% herd size increase (Figure 4b). The farms with highest profits from milk production tend to be those with large cattle herds, most over 30 animals, and large land areas, most over 10 ha. In comparison, less well-endowed farm households have few cattle beyond draft animals, but are more likely to have small ruminants, and thus a wider range of farms can benefit from intensification options based on these relatively inexpensive animals.
Income from reported sales of livestock, per active household member. Farms are ordered as in Figures 1 and 2. The solid line represents the World Bank's extreme poverty line of US$1.90 per person per day at purchasing power parity, equivalent to US$250 per person per year at market exchange rates.

Income from selected livestock scenarios, per active household member. Farms are ordered as in Figures 1 and 2. The solid line represents the World Bank's extreme poverty line of US$1.90 per person per day at purchasing power parity, equivalent to US$250 per person per year at market exchange rates. The dashed line is the average income from gold mining (US$1225/person/year), the most profitable off-farm activity reported in the area. (a) Livestock income plus crop income from the scenario with best farmer yields and mean prices. In this scenario, some cotton area is converted to groundnut to account for fodder needs for cattle feeding in milk production. (b) Livestock income plus crop income from the scenario with the best farmer yields and peak prices. In this crop scenario, the majority of land is planted to groundnut, and all households produce sufficient fodder for cattle feeding in milk production.

DISCUSSION
This simple scenario analysis allows us to define the boundaries of possibilities for intensification, or the ‘solution space’ within which farmers are working. We designed these scenarios to be as simple as possible, and to provide best-case estimates: they do not consider specific labour bottlenecks, risk, or farmers' preferences—for example, for specific crops, or crop diversity. What we describe here is in essence the maximum attainable gross margin in a given scenario, and farmers will, in all probability, continue to grow a variety of crops, resulting in lower profits while also reducing risk. We also do not consider differences in yield potential among farms, because relationships between farm characteristics and factors like labour productivity or fertilizer use efficiency that would affect farm incomes are not straightforward (Falconnier et al., Reference Falconnier, Descheemaeker, Van Mourik, Sanogo and Giller2015). Despite these simplifications, there is still much to be learned from the results. Given current technology and economic conditions, the potential gains from intensification of dryland agriculture—whether sustainable or not—are not competitive with off-farm options for most farming households. Farmers already obtain near-maximum profits given the options available to them: optimizing crop allocation provides few benefits in terms of income unless yields or prices change dramatically. Moving beyond intensification, many more farmers could move out of extreme poverty if they are able to expand the area they cultivate. Thus, as found by Harris and Orr (Reference Harris and Orr2014) for many other places, farmers in Bougouni may be able to move out of extreme poverty by intensifying crop production, but it is difficult for them to move much beyond that through intensification alone. Changes in price structures and/or increases in the amount of land per capita a household is able to cultivate—which in turn would require labour-saving technology such as increased mechanization and use of chemical herbicides—are needed in order to improve farmer incomes beyond the minimal requirements for survival.
In general, the scenarios that can compete with off-farm income options include drastic increases in yield, in cultivated area, in commodity prices, or some combination of these. Achieving high yields would require capital investments in seed, fertilizers, pesticides and herbicides, as well as labour for improved management. Cropland expansion would require increases in labour productivity. The widespread availability of draft animals in the study area is a result of targeted policy, including credit and subsidies to farmers: similar efforts could help farmers purchase tractors. However, either case raises questions around environmental trade-offs, from increased use of chemical inputs or from cropland expansion at the expense of natural fallows, and thus will not fit the standard definitions of sustainable intensification.
Where farmers can take advantage of peak off-season prices, they depend on secure storage facilities, transportation infrastructure, and access to markets, as well as the financial capacity to absorb the costs and risks of deferred sales. It is also important to note that should production of market crops like groundnut increase as dramatically as in these scenarios, prices would almost certainly fall, and if supply becomes more constant over the year, the annual variability will no longer exist as an opportunity to exploit. Conversely, current profitability is supported by subsidies to fertilizer and guaranteed prices for cotton—policies that have been criticized as economically unsustainable by international institutions (IMF, 2006).
Integrated crop-livestock scenarios are effective at reducing poverty at best farmer yields. Small ruminant scenarios are feasible given current infrastructure, so the positive results are encouraging, as is the fact that gains are obtained across the entire farm population (Figure 4). Farm size is not a good predictor of the potential impact, and sheep sales can substantially increase farm income for positions at both ends of the x-axis—very small and very large farms. The main constraints identified by farmers for increasing small ruminant production are veterinary care for animals and market access. Animals are currently sold to itinerant traders, who pay well below the market price, although direct sales to neighbours or in local markets do occur around Tabaski. Gains from milk production, in contrast, are concentrated among a few farms, namely those with large herds. Purchasing cattle is a much larger investment than purchasing small ruminants, making milk production a less feasible option for smaller farms. In addition, milk production for the market requires a cold chain from farm to consumer—expensive infrastructure that does not currently exist. The smallholder dairy sector in Mali as a whole is very small, and is constrained by low and fluctuating supply. In addition, local milk faces difficulty competing with imported milk powder, mainly from Europe (Rietveld, Reference Rietveld2009).
In Mali, where agricultural extension has centred on cotton since the colonial period, there are systemic barriers to the adoption of alternative cash crops by smallholder farmers. Farmers depend on access to credit and to subsidized inputs for maize, their key food crop. These inputs are contingent on cotton production, so farmers who wish to replace cotton with another cash crop must also find alternative sources of credit and inputs, usually at substantially higher prices if they are available. Extending provision of subsidized fertilizer and credit to crops beyond cotton is unattractive to the Malian state, for whom cotton income provides a key source of revenue. Because cotton sales are controlled by a monopoly purchaser, they are easily measured and taxed, while sales of other crops and livestock often move through informal channels, making them less amenable to state control and taxation (Koenig et al., Reference Koenig, Diarra and Sow1998). The CMDT, which once provided support to crops other than cotton, has withdrawn this support as well as other rural development activities due to financial problems and pressure from international financial institutions. While other rural development organizations once provided support to groundnut and other grain crops, these no longer exist. No other institutions have filled the resulting void (Serra, Reference Serra2014).
Our results raise important questions for the identified goals of reducing or ending hunger and poverty through improved agricultural production that form the basis for development programs like AGRA and Feed the Future (AGRA, 2015; USAID, 2011). Farmers in the area identify food self-sufficiency as their primary goal for agriculture (Ollenburger et al., Reference Ollenburger, Descheemaeker, Crane, Sanogo and Giller2016), and credit fertilized maize, which has largely replaced sorghum in the study site, for improving their food self-sufficiency (Laris and Foltz, Reference Laris and Foltz2014). However, for the majority of farming households who are currently at or near food self-sufficiency, there are few incentives to intensify grain production given current price regimes, particularly without cropland expansion, as is required by most definitions of sustainable intensification (e.g. Godfray et al., Reference Godfray, Beddington, Crute, Haddad, Lawrence, Muir, Pretty, Robinson, Thomas and Toulmin2010; Pretty et al., Reference Pretty, Toulmin and Williams2011). This indicates disconnection between current agricultural research and development priorities and the factors that make grain production profitable. If changes in prices and land expansion have the biggest impact on the profitability of agriculture, investments in storage facilities and mechanization are likely to be more effective in increasing agricultural productivity and in reducing poverty than the best management practices for crop production.
What then should be the focus of agricultural research? First, researchers should not limit themselves to a pre-defined pathway or set of technologies, such as sustainable intensification, but rather base their research priorities on what best fits existing socio-ecological niches. Second, one clear positive result that can be achieved with agricultural intensification is increased household level food self-sufficiency. This suggests that research on intensification of staple crops might best focus on food insecure households—the same households which are routinely under-represented in many research activities (Haile et al., Reference Haile, Azzarri, Roberts and Spielman2017; Chambers and Ghildyal, Reference Chambers and Ghildyal1985; Falconnier et al., Reference Falconnier, Descheemaeker, Van Mourik, Adam, Sogoba and Giller2017). Finally, for farm households which are already food self-sufficient, researchers may be able to suggest a variety of options, not limited to intensification, to meet farmers’ other objectives. Crop diversification options that provide additional sources of protein and micronutrients may improve the nutritional status of food self-sufficient farmers. Legumes can provide both high-quality food for farm households and improve soil fertility when grown in rotation (Giller et al., Reference Giller, Cadisch, Ehaliotis, Adams, Sakala, Mafongoya, Buresh, Sanchez and Calhoun1997). Given the effect of time of sale, groundnut storage and marketing clearly have the potential for high impact on household incomes. Farmers in these areas are already exploring tree crops like mango and cashew as high value cash crops with relatively low labour demands, and would likely benefit from additional research on these crops and their management. While data on tree crops were insufficient to include them in the current study, cashew production, for example, has been profitable for smallholders in northern Côte d'Ivoire, not far from our study site (Koné, Reference Koné2010).
Barriers to achieving higher yields are only partly based on non-adoption of already-available options, as evidenced by the large gaps between median and best farmer yields. The large gap between best farmer yields and attainable yields shows that improved technology can have an impact, however in this case the barriers to adoption are structural. Farmers’ main barrier to intensifying maize production, for example, is that fertilizer availability is limited by the amount of cotton that they grow and by the CMDT's inconsistently applied and changing policies on the provision of subsidized fertilizer for maize (Laris and Foltz, Reference Laris and Foltz2014). If farm households had access to credit and to subsidized fertilizer independent of cotton, some might want to expand land area or intensify production of other crops. But agriculture is only one way to earn income, and for many farmers other options are more attractive—livestock production, migration, work in small businesses, or gold mining. The design and promotion of technologies should thus be considered in their socio-ecological niche, where they compete not only with existing farming practices but also with other sources of income. Methods based on iterative cycles of farming system re-design and co-learning among farmers, researchers and other stakeholders can be a basis for a systems agronomy that identifies promising options (Descheemaeker et al., Reference Descheemaeker, Ronner, Ollenburger, Franke, Klapwijk, Falconnier, Wichern and Giller2016). The concept of a basket of multiple ‘best-fit’ technology options to answer co-defined research questions (Giller et al., Reference Giller, Tittonell, Rufino, van Wijk, Zingore, Mapfumo, Adjei-Nsiah, Herrero, Chikowo and Corbeels2011) is in contrast to the ‘best bet’ technological solutions promoted by large-scale development projects. It calls for differently organized research and extension processes, which are driven by the priorities identified by farmers, as opposed to the focus on technology transfer and capacity-building of many Green Revolution projects (Moseley, Reference Moseley and Sumberg2017). While farmers have shown considerable flexibility in adapting the products of current research and development projects to meet their goals, this is no substitute for a system actually designed to address their needs and aspirations.
Researchers can also function as a ‘bridge’ between farmers and policy makers. When working with development programs that have fixed goals and objectives, research can identify who would likely benefit from program outputs, and, just as importantly, who is left out (Carr and Onzere, Reference Carr and Onzere2017). If researchers take farmers’ goals and perceptions seriously, they can transmit those to policy makers, helping to expand the overlap between farmer and state or donor interests: either by changing policy so that state goals align more closely with farmer aspirations, or by helping state actors develop incentives that can help make state goals more attractive to farmers. In order to do this effectively, agricultural scientists must move beyond narrowly defined research questions and objectives to consider who is defining them, and even to challenge the framing and priorities of those funding their research. This, in turn, would require a substantial transformation of how the state and donor institutions define, fund and evaluate agronomic research.
CONCLUSIONS
Using a relatively limited set of data and simple models, we have been able to delineate a solution space for agricultural intensification in the district of Bougouni. Like rapid prototyping exercises in engineering or feasibility studies in business contexts, this exercise allows us to relatively quickly identify the scope of opportunities and constraints for intensification of rainfed agriculture. The limited benefits from intensification in this high-potential area lead us to question the technocratic narrative promoted by agricultural development programs promoting a Green Revolution for sub-Saharan Africa. Their narrative is based on three intertwining assumptions. First, ‘The low performance of agriculture in Africa is at the heart of its food insecurity and slow economic growth’ (Toenniessen et al., Reference Toenniessen, Adesina and DeVries2008, p. 1). Second, that improved agricultural productivity is a pathway out of poverty; and finally that low productivity is largely a technological problem requiring technical solutions (Toenniessen et al., Reference Toenniessen, Adesina and DeVries2008). We contest all of these assertions. First, while low yields may be a contributing factor to rural poverty, claiming that low productivity is the key component disregards historical factors (Bhattacharyya, Reference Bhattacharyya2009) and current political and economic issues including lack of investment in rural infrastructure, health and education (Acemoglu and Robinson, Reference Acemoglu and Robinson2010; Crook, Reference Crook2003; Hope, Reference Hope, Hope and Chikulo2000). Second, our analysis contributes to a growing body of literature showing that narrowing yield gaps in dryland agriculture alone is rarely a pathway out of poverty (Frelat et al., Reference Frelat, Lopez-Ridaura, Giller, Herrero, Douxchamps, Djurfeldt, Erenstein, Henderson, Kassie, Paul, Rigolot, Ritzema, Rodriguez, van Asten and van Wijk2015; Harris and Orr, Reference Harris and Orr2014). Finally, non-adoption of yield-improving technologies may be a rational decision by farmers given their limited impact, or a consequence of their lack of access to key components of those technologies. The existence of yield-increasing technology options in and of itself is not sufficient to improve actual farmer yields, or the gaps between current and attainable yield levels would not be so great. Farmers may see additional investments in crop production beyond those required for their own food self-sufficiency to be less attractive than focusing labour and capital investments on activities with higher profit-generating potential (Sumberg, Reference Sumberg2005).
To improve rural livelihoods while also increasing the production of staple foods to feed a growing population, it is vital that researchers, policy makers, development practitioners and other stakeholders find ways in which their goals can intersect with farmers’ priorities rather than simply imposing their own goals on rural communities. This may mean implementing agricultural support policies that challenge the neoliberal position for a declining role of government. If the goal is to improve smallholder livelihoods, agricultural interventions directly linked to food production must be accompanied by efforts to address the priorities rural people themselves identify—road infrastructure, health care, and education. If they do not take into account existing social and ecological conditions and respond to farmers’ priorities, the intensification practices proposed by many agricultural development institutions may simply be solutions in search of a problem.
Acknowledgements
We thank Dr Tom van Mourik, the CMDT Bougouni office and their field agents for facilitating the collection of village census data, and villagers for participation. Thanks to Dr D Hailemichael Shewayrga, Dr Bouba Traoré and Dr Krista Isaacs for assistance in estimating attainable yields, and Dr Ousmane Sanogo for market price data. We thank two anonymous reviewers for their helpful comments. We are grateful for funding from the McKnight Foundation through the project ‘Pathways to Agro-ecological Intensification of Sorghum and Millet Cropping Systems of Southern Mali’ (No. 12–108), and from the United States Agency for International Development (USAID) through the Africa Research in Sustainable Intensification for the Next Generation project.