1 Introduction
Development of vortex devices in chemical, biological and power technologies requires investigating the characteristics of confined vortex flows and defining the regimes of emergence and destruction of self-organized vortex structures to improve heat and mass transfer control. One of the key parameters influencing transfer processes is vortex breakdown phenomenon that appears in many engineering applications. Vortex breakdown is characterized by a structural change of the vortex core, associated with an abrupt deceleration of the axial velocity on the vortex axis, which sometimes develops to a recirculation zone (Faler & Leibovich Reference Faler and Leibovich1978).
A simple experimental means to study the appearance of vortex breakdown is creating swirling flow by rotating an end wall in a cylindrical enclosure. For this classical example of vortex flow induced by a rotating lid in a closed liquid-filled container, the flow mode parameters are as follows. The aspect ratio
 $h$
is the ratio of height to inner radius of the cylinder (
 $H/R$
) and the Reynolds number
 $Re=\unicode[STIX]{x1D6FA}R^{2}/\unicode[STIX]{x1D708}$
, where
 $\unicode[STIX]{x1D6FA}$
is the angular velocity of lid rotation and
 $\unicode[STIX]{x1D708}$
is the liquid kinematic viscosity. The rotating lid drives the fluid around the container axis. The non-uniform centrifugal force pushes the fluid adjacent to the lid away from the centre that results in a meridional circulation. The fluid then descends along the outer wall and turns to the axis near the bottom. Close to the axis it ascends vertically, forms a concentrated vortex structure due to the conservation of angular momentum and returns to the rotating lid. Depending on the rotation rate and aspect ratio, the flow may experience vortex breakdown in the form of recirculating bubbles, appearing on the cylinder axis (Escudier Reference Escudier1984; Lopez Reference Lopez1990). Interestingly, the development and the shape of the bubble breakdown are affected by circular waves (Lopez Reference Lopez2012) or rotating vortex multiplets (Sørensen, Naumov & Okulov Reference Sørensen, Naumov and Okulov2011) in a high cylinder, driven by a rotating end wall presented in the initial three-dimensional flow. Naumov, Mikkelsen & Okulov (Reference Naumov, Mikkelsen and Okulov2014) experimentally found that the scenario of developing the bubble-mode breakdown zone with counterflow generation is the same for cylinders with both low and high aspect ratio, and it remains independent of the stationary–non-stationary transition boundary for the main vortex flow for
 $h$
ranging from 1 to 6.
The description of the formation and control mechanism of the vortex breakdown in lid-driven cavity flows is important in a variety of technical areas such as vortex combustion (Shtern Reference Shtern2012), Czochralski oxide growth or cell growth in rotating disk bioreactors (Dusting, Sheridan & Hourigan Reference Dusting, Sheridan and Hourigan2006). It is discussed that the laminar flow inside a steady vortex breakdown bubble may constitute an ideal environment for these applications. According to recent works of Shtern, Torregrosa & Herrada (Reference Shtern, Torregrosa and Herrada2012) and Herrada, Shtern & Torregrosa (Reference Herrada, Shtern and Torregrosa2015), the swirl-decay mechanism causes counterflows in swirling motions and the emergence of breakdown bubbles. The shear-layer nature of the Vogel–Escudier flow instability was studied by numerical simulations, where it was found that the critical Reynolds number is independent of aspect ratio where the latter exceeds a value of 5.
Vortex breakdown control methods without the input of significant additional energy but with a change in container geometry are a very attractive way of manipulating the flow environment. The concept of using a partially rotating end wall, in which the central part consists of a rotating disk with a smaller radius, was considered by Yu et al. (Reference Yu, Lee, Zeng and Low2007). They showed that the aspect ratio has a dominant effect on the appearance of vortex breakdown, and that varying the size of the rotating disk one can control the vortex breakdown behaviour. A non-intrusive control method of vortex breakdown bubble (hereinafter VB), based on co-rotation and counter-rotation of a small disk embedded in the non-rotating end wall was successfully applied by Mununga et al. (Reference Mununga, Lo Jacono, Sørensen, Leweke, Thompson and Hourigan2014). They found that the co-rotating disk increases the swirl decay downstream. As a result the breakdown bubble onset occurs at a smaller Reynolds number than that with no control. By contrast, for the counter-rotating disc the bubble appears at larger
 $Re$
.
It is well know that the onset of vortex breakdown depends on Reynolds number, aspect ratio and boundary conditions. In addition, the chamber geometry may also have its influence. However, the majority of previous studies focused on the case of a closed cylindrical container. Other geometries have not been well explored experimentally, and only a few numerical studies have considered the problem where the container consists of an inclined side wall (Yu et al. Reference Yu, Lee, Zeng and Low2008) or wave side wall (Yu & Meguid Reference Yu and Meguid2009). In the meantime, these studies show that the inclined or wave side walls do play an important role in precipitating/suppressing the occurrence of the vortex breakdown. The effect of the lid shape on vortex breakdown in an enclosed chamber with a rotating end wall has also been studied by Yu et al. (Reference Yu, Lee, Zeng and Low2006). The concave-cone lid was found to delay or even completely suppress the vortex breakdown, while the convex-cone lid precipitates the onset of vortex breakdown.
Another approach to breakdown control is using the polygonal geometry of the closed container with a rotating disk embedded in the end wall. It should be noted that polygonal containers have practical relevance. In practice, power plant combustion chambers are designed with square, hexagonal and octagonal cross-sections (Zykova et al. Reference Zykova, Serant, Nozdrenko and Shchinnikov2003). Polygonal configuration has certain advantages over circular configuration, as it is cheaper and simpler if applied in large-scale chambers; besides, additional corner vortices in a polygonal geometry enhance mixing coefficients. Additionally, to reduce optical aberrations in optical diagnostics of vortical flows in tubes and chambers, non-cylindrical sections, e.g. hexagonal or square ones, are often applied (Dubnishev et al. Reference Dubnishev, Meledin, Pavlov and Yavorskiy2003).
No detailed analysis of the flow topology in the polygonal container geometry has been performed successfully. The main difficulty of numerical investigation, compared with the cylindrical axisymmetric configuration, is the dependence on the azimuthal coordinate. The flow evolution in a closed cubical container was experimentally studied at
 $Re\in [1000,5000]$
by Okulov, Meledin & Naumov (Reference Okulov, Meledin and Naumov2003) where only the spiral breakdown was observed at
 $Re>4000$
. At that, contrary to the flow in the closed cylinder, the steady vortex breakdown with a counterflow region did not occur. In the recent paper of Naumov et al. (Reference Naumov, Dvoynishnikov, Kabardin and Tsoy2015) the influence of polygonal geometry on vortex breakdown location was investigated for
 $h=2$
. The VB was found to migrate upstream, away from the rotating disk embedded in the top end wall as the number of angles increased from five to eight. For a cubical configuration, the steady vortex breakdown did not appear at all, whereas for octagonal configuration the location and Reynolds number of VB was in a very good agreement with that for cylindrical configuration.
The purpose of this work is to expand the range of the regime
 $h\in [0.5,3.0]$
and to reveal regularities of formation and the arrangement of VB. This investigation is accomplished by combining the numerical calculation and the experimental investigation by seeding particle visualization and laser Doppler anemometry (LDA) measurements, in which VB size and position are detected as a function of the container angles and Reynolds numbers.
2 Experimental set-up and data processing
2.1 Geometry of polygonal containers
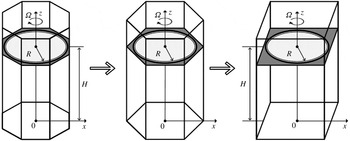
The topology of VB in the confined flow generated by a rotating disk in closed containers with polygonal cross-sections (square, pentagonal, hexagonal and octagonal) is analysed both experimentally and numerically. The schematic of the problem geometry is presented in figure 1. The reference point of the coordinate system is set in the centre of each polygon bottom. The
 $x$
-axis passes through the non-rotating bottom plane. The
 $z$
-axis coincides with the vertical container axis. The vortex structure in a closed polygonal container was generated by rotation of the disc embedded on the upper lid of the container and driven by a stepping motor. Contrary to the cylindrical geometry, where the rotating lid is also an upper end wall of the container, in the polygonal geometry, the rotating disk is embedded in the upper end wall since its rotation is impossible due to the non-circular geometry.
Schematic of the problem.

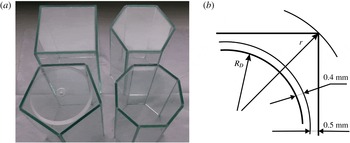
The geometrical details of glass containers with polygonal cross-sections used in the experiment are presented in figure 2. Aspect ratio
 $h$
is changed in the range from 0.5 to 3.0. The rotating disk radius is
 $R_{D}=49.6~\text{mm}$
. The gap between the rotating disk and the hole in the upper end wall is 0.4 mm. This hole with radius
 $R=50~\text{mm}$
represents an inner circle in the upper lid of the polygonal containers. The minimal width of the lid near the flat vertical edge of the polygon is 0.5 mm (figure 2
b). Thus,
 $L$
, i.e. the side length of a regular polygon with a number of angles
 $N$
, is determined on the inner circle with radius 50.5 mm. The gap between the rotating disk and the container side wall is negligibly small, not more than 2 % of the disk size, and has no noticeable effect on the vortex breakdown phenomenon.
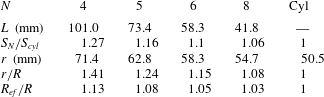
The volume of the container increases with a decrease in the cross-section angle at the same aspect ratio. The side length for all container configurations, where
 $r$
is the radius of a circle circumscribing the polygon, and the ratio of the polygon areas to the area of a cylinder with radius 50.5 mm are presented in table 1.
 $S_{N}$
and
 $S_{cyl}$
are the areas of the polygonal and cylindrical containers, respectively. In addition, based on the ratio of the areas of the regular polygon, it was possible to determine the effective radius of the conventional container
 $R_{ef}=R_{D}\sqrt{S_{N}/S_{cyl}}$
, which will be further used for generalizing results and finding regularities.
Photo of glass containers with polygonal cross-sections (a) and schematic of the rotated disk and upper stationary end wall (b).

Geometrical details of containers with polygonal cross-sections.

2.2 Description of experiments
During the experiments, each container was placed inside a rectangular box with dimensions of
 $200\times 200\times 200~\text{mm}$
that was made of glass and filled with tap water in order to minimize optical aberrations and temperature fluctuations. A 70 % glycerine–water mixture was used as a working fluid. The temperature dependence of viscosity was approximated by a second-order polynomial, with reference points equal to 26.82 cSt at
 $20~^{\circ }\text{C}$
and 19.95 cSt at
 $26~^{\circ }\text{C}$
. As the viscosity of the working fluid was very sensitive to temperature changes, the temperature dependence of liquid viscosity was carefully controlled during the experiments. The fluid temperature was measured with an accuracy of
 $0.1\,^{\circ }\text{C}$
, thus reducing the uncertainty of viscosity determination to 0.2 %. The total error of
 $Re$
did not exceed
 $\pm 10$
in the range of Reynolds numbers from 500 to 3000.
Flow visualization was performed using a laser (laser power of 250 mW and wavelength of 684 nm) and a digital camera. The laser radiation, used for the laser sheet, was continuous. A laser sheet with thickness of approximately 1 mm was formed by a combination of spherical and cylindrical lenses. In the experiments, the laser sheet illuminated a vertical plane along the cavity axis. The digital camera was focused on that plane.
The flow patterns were observed by seeding particle visualization (polyamide beads with mean size of 10 microns). Images of seeding particles were acquired with a high-resolution SPOT INSIGHT-4M digital camera with
 $15.2\times 15.2~\text{mm}$
, 4.0 Megapixel progressive scan charge-coupled device (CCD) image sensor Kodak KAI-4021-M. Acquired images had resolution of
 $2048\times 2048$
pixels. The exposure time may be adjusted from
 $40~\unicode[STIX]{x03BC}\text{s}$
to 600 s. A lens with focal length of 60 mm fitted with an optical narrowband filter (685 nm) was used with the camera. The flow visualization photographs taken during the experiments were analysed in the Matlab environment with an accuracy of at least 3 % to determine the position of upstream and downstream stagnation points of the vortex breakdown bubble (Naumov et al.
Reference Naumov, Dvoynishnikov, Kabardin and Tsoy2015).
The obtained results were adjusted by more accurate LDA measurements of the axial velocity along the container
 $z$
-axis. Polyamide beads with an average diameter of
 $10~\unicode[STIX]{x03BC}\text{m}$
and density close to the solution density were employed as seeding light-scattering particles for both the LDA and the visualization measurements. The axial velocity component at various points on axis cavities was measured by a two-dimensional LDA, developed at the Institute of Thermophysics SB RAS on the basis of a Mitsubishi ML1013R semiconductor laser (with power of 70 mW and wavelength of 684 nm). In the LDA, a two-frequency differential optical configuration with a frequency shift of 80 MHz was applied. Thus, combining the two techniques allows determining the positioning of a breakdown bubble as a function of control parameters (number of container angles,
 $Re$
and
 $h$
).
2.3 Numerical technique
The locations of stagnation points of VB emergence and corresponding marginal Reynolds numbers were determined experimentally and numerically by STAR-CCM+ computational fluid dynamics software. The assumption that the flow was incompressible and steady was made to compute the three-dimensional flow field in the containers with rotating end walls. The well-established STAR CCM+ commercial package is based on the finite volume method. In numerical calculation, the rotating disk radius was
 $R=50~\text{mm}$
; there was no gap between the rotating disk and the upper end wall; other parameters, including the geometry of the polygonal containers, were the same as in the experimental part.
The pressure-based segregated flow model was employed to solve the governing equations. To all surfaces, the standard no-slip boundary condition was imposed. The linkage between the momentum and continuity equations was achieved using a predictor–corrector approach. The second-order upwind scheme was applied to the convective term. The SIMPLE solver algorithm was used to couple the continuity and momentum equations. To neglect total diffusion at flow boundaries near the container walls, the flow boundary diffusion property of segregated flows was used. Double precision (15 d.p.) was used for all the calculations to neglect round-off errors.
The main difficulty of numerical investigation of this configuration, compared with cylindrical axisymmetric one, is that there is a dependence on the azimuthal coordinate. For Reynolds numbers over 2200, the steady-state flow in closed containers loses its stability, i.e. unsteadiness develops. The study of the topology of vortex breakdown in closed polygonal containers is carried out in the vicinity of the unsteady boundary, when at the polygon angles unsteadiness develops at smaller
 $Re$
. Therefore, the numerical modelling should be based on parameters that allow detection of the unsteadiness. In our previous work (Naumov et al.
Reference Naumov, Dvoynishnikov, Kabardin and Tsoy2015), the attempt to obtain the stationary laminar solution at a real unsteady flow in a polygonal geometry resulted in a discrepancy of in the numerical modelling solution; for this reason, to obtain the averaged velocity field in the axial region in the regime of unsteady flow, a turbulence model was used. Turbulence modelling was done with Menter shear stress transport (SST) formulation of the K-Omega model and hybrid all
 $y^{+}$
wall treatment. The application of a turbulence model allows us to avoid the special condition of grid thickening at the container walls and near the rotating disc. We are not proposing a complete substantiation of the use of this turbulence model for the studied range of Reynolds numbers, but we achieved solution stability and quick convergence. This numerical technique was applied to simulate swirling flows in polygonal containers for aspect ratio
 $h=2.0$
(Naumov et al.
Reference Naumov, Dvoynishnikov, Kabardin and Tsoy2015). The overall discrepancy of experimental data (LDA measurements) and computational analysis did not exceed 2 %–3 %, when accounting of imperfections in the experimental set-up.
Note that there is a discontinuity in the boundary conditions at the outer edge of the embedded disk and at the corner between the disk and stationary side walls. As was found in numerical simulation by Yu et al. (Reference Yu, Lee, Zeng and Low2006, Reference Yu, Lee, Zeng and Low2008) the increase in the grid size parameter from 1/60 to 1/100 or 1/200 allows automatic avoiding of the problem of discontinuity. In our new simulation, a stationary laminar solution was used; and a polyhedral mesh with additional prism layers for resolving the boundary layer was generated using the mesher provided by STAR-CCM+. The number of prismatic layers on the boundary was equal to 8. Polyhedral meshes provide a balanced solution for complex mesh generation problems. They are relatively easy and efficient to build, requiring no more surface preparation. They also contain approximately five times fewer cells than a tetrahedral mesh for the given starting surface.
The calculated velocity was qualitatively compared with experimental visualizations of Escudier’s experimental results. Our mesh was tested on a cylinder configuration at
 $Re=1500$
and
 $Re=1850$
. As is obvious, the simulation predicted both the occurrence of primary and secondary recirculation bubbles at
 $Re=1854$
and their size and location along the centreline according to Escudier’s visualizations. Each generated mesh contained approximately 1 million cells for
 $h=2.0$
. At a mesh size up to 500 thousand grid points, there was no second recirculation bubble at
 $Re=1850$
. With further increase in mesh size up to 800 000 grid points, the computation predicted the second breakdown bubble with 10 % error in its size and axial location compared to experimental data. The current results on the positions of upstream and downstream stagnation points, obtained using 1 million grid point mesh, agreed within 2 % with the ones obtained for a cylindrical cavity with
 $h=2.0$
and without control (Mununga et al.
Reference Mununga, Lo Jacono, Sørensen, Leweke, Thompson and Hourigan2014).
It may be stated that the mesh with 1 million cells is sufficient to simulate the process of VB in the configuration of regular polygons at
 $h=2.0$
. Finding optimal mesh parameters for this configuration served to register the average cell size of 0.8 mm with the number of prismatic layers at the boundaries equal to 8 and size of 0.2 mm. With an increase of the container height these parameters remained unchanged and the number of cells in the grid increased in accordance with an increase in the container height. For example, in the container with
 $h=2.5$
, the number of cells was approximately 1.25 million, and with
 $h=3.0$
it was 1.5 million. This provided simulations which were grid independent. Computing time increased proportionally therefore it was not necessary to increase the mesh resolution further.
Excluding the turbulence model from the numerical simulation we slightly increased the solution convergence time. So, the influence of the turbulent viscosity was neglected that resulted in better compliance with the experimental data (less than 2 %). In addition, the onset of vortex breakdown was estimated in a wide range of parameters for the cylindrical cavity and compared with Escudier’s experimental results for aspect ratios from 1.0 to 3.0 (dashed line in figure 7, part 3.2). The obtained good agreement indicates that our simulation is valid for detecting the appearance and disappearance of the vortex breakdown bubbles. Despite small deviations, these comparisons prove the correctness of the conducted simulations when investigating steady regimes.
3 Results and discussion
3.1 Behaviour of the breakdown bubble in a non-axisymmetric geometry
The visualization, numerical study and LDA measurements along the container axis were systematically realized for container configuration angles equal to 4, 5, 6 and 8 and aspect ratios from 0.5 to 3.0. The vortex breakdown size and position on the container axis were identified for Reynolds numbers in the range from 500 to 2800.
The disk rotation velocity was steadily increased starting from
 $Re=500$
to approximately
 $Re=2800$
and with an increment
 $\unicode[STIX]{x0394}Re=100$
for experimental investigation and
 $\unicode[STIX]{x0394}Re=50$
for numerical simulation. At each step, after equilibrium was re-established, digital photographs were taken and LDA velocity measurements were performed. The range of Reynolds numbers was limited by critical values because, as shown in papers by Sørensen, Naumov & Mikkelsen (Reference Sørensen, Naumov and Mikkelsen2006), for the cylindrical cavity configuration the onset of non-axisymmetric instability may appear for a tall cylinder. The asymmetrical configuration of the multi-angle container can also cause non-axisymmetric fluctuations of the breakdown bubble and, as is shown in papers by Okulov et al. (Reference Okulov, Meledin and Naumov2003), Naumov et al. (Reference Naumov, Dvoynishnikov, Kabardin and Tsoy2015), the unsteady flow regimes for a cubical configuration may start much earlier in comparison with that in a cylinder. Thus, the instability was considered to be three-dimensional. For this reason, we investigated only steady flow regimes in near-axis areas of confined flow.
Both the experimental and numerical study showed that, for all investigated configurations, at increasing Reynolds number the stagnation points moved down along the
 $z$
axis until
 $Re$
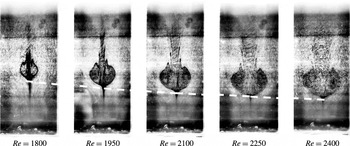
reached a critical value. An example of the flow comparison for
 $h=2.25$
and different
 $Re$
for a hexagonal configuration is presented in figure 3 which corresponds to the behaviour of breakdown bubble for
 $h=2.0$
(Naumov et al. (Reference Naumov, Dvoynishnikov, Kabardin and Tsoy2015, figure 6)).
The flow with VB regime at
 $h=2.25$
and different
 $Re$
for hexagonal configuration.

The dashed line in figure 3 represents the stagnation point location, which shifts upstream away from the rotating disk, embedded in the upper end wall, at increasing Reynolds number. The results, depicted in figure 3, can be explained by the swirl-decay mechanism (Shtern et al.
Reference Shtern, Torregrosa and Herrada2012; Herrada et al.
Reference Herrada, Shtern and Torregrosa2015). As
 $Re$
increases, the flow convergence to the axis intensifies near the bottom, decreasing pressure there, whose stronger suction shifts VB downward.
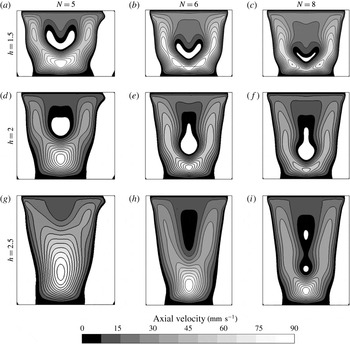
Numerical calculation of
 $V_{z}$
velocity component in vertical cross-section at different aspect ratios and
 $Re=2000$
. (a,d,g) Represent pentagonal, (b,e,h) show hexagonal and (c,f,i) display octagonal cross-section. The areas marked in white colour correspond to the negative direction of axial velocity.

The visualization shows that in all investigated cases the steady vortex breakdown was not perfectly axisymmetric and had an outflow asymmetry at the downstream region, even for low Reynolds number. For cylindrical axisymmetric geometry the non-axisymmetric open vortex breakdown may result from the very slight misalignment between the axis of the rotating end wall and the cylinder axis, which is unlikely to be measurable experimentally (Thompson & Hourigan Reference Thompson and Hourigan2003). It was suggested theoretically (Brøns, Voigt & Sørensen Reference Brøns, Voigt and Sørensen1999; Brøns, Shen & Sørensen Reference Brøns, Shen and Sørensen2007) that this three-dimensional behaviour can be explained by structurally unstable axisymmetric bubbles, implying that trajectories of particle tracers always tend to asymmetric behaviour near one of the interior stagnation points. As a consequence, visualizations using flow tracers give the impression of asymmetric flow behaviour near the breakdown bubbles. With an increase in the Reynolds number, the swirling flow in the enclosed container may become unsteady and/or non-axisymmetric (Gelfgat, Bar-Yoseph & Solan Reference Gelfgat, Bar-Yoseph and Solan2001; Sørensen et al. Reference Sørensen, Naumov and Mikkelsen2006, Reference Sørensen, Gelfgat, Naumov and Mikkelsen2009). It would seem therefore that there are two sources of asymmetry. First, there are the asymmetries resulting from even the smallest and yet inevitable ‘external’ imperfections in an experimental rig; these stationary asymmetries appear at all Reynolds numbers, including those below the Reynolds critical number at which the flow becomes unsteady. Second, there are the ‘inherent’ transitions to asymmetry resulting in the normally rotating azimuthal modes, which are found both experimentally and numerically.
Polygonal container geometry a priori assumes a dependence on the azimuthal coordinate compared to cylindrical configuration. It is obvious that the polygonal container shape seems beneficial in terms of the loss of flow axial symmetry. The initial axisymmetry-breaking instability of the flow in closed containers with polygonal geometry for different aspect ratios was investigated for steady flow conditions. The flow topologies in a vertical plane of the polygonal containers may be compared for different aspect ratios
 $h=1.5,2.0$
and 2.5 at
 $Re=2000$
in figure 4, where the images represent positive values of axial velocities. The areas marked in white colour in the central part and near the side walls correspond to the negative direction of axial velocity. Panels (a,d,g) are for pentagonal, (b,e,h) for hexagonal and (c,f,i) for octagonal cross-section configurations. It is clear that, depending on regular polygon cross-section and at increasing number of angles from five to eight, the area of vortex breakdown shifts upstream. At that, the reverse flow area is symmetrical to the vertical axis of the container even in the case of pentagonal configurations. The reverse flow area at given parameters in the square configuration is not found (see Naumov et al. (Reference Naumov, Dvoynishnikov, Kabardin and Tsoy2015, figure 4)). It should be noted that the shape of VB in figure 4 for
 $h=1.5$
is significantly different from the spherical one. The shape of VB at this aspect ratio is very similar to the one in the cylinder (Escudier Reference Escudier1984).
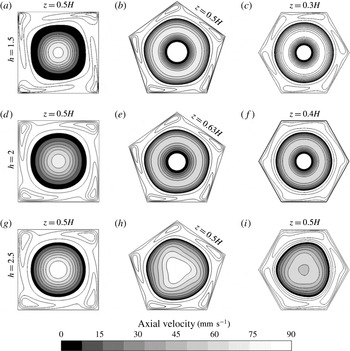
Numerical calculation of axial velocity component for horizontal cross-section at different
 $z$
for
 $N=4$
, 5 and 6;
 $Re=2000$
for different aspect ratios. Positive values of axial velocity are shown in grey scale. The areas marked in white colour correspond to the negative direction of axial velocity.

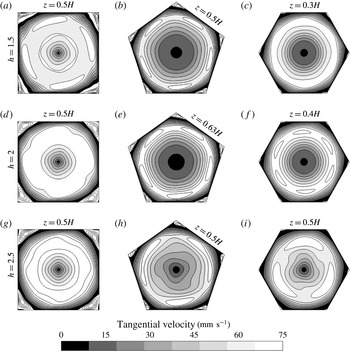
Numerical calculation of tangential velocity components for horizontal cross-section at different
 $z$
for
 $N=4$
, 5 and 6;
 $Re=2000$
for different aspect ratios. Positive values of azimuthal velocity are shown in grey scale. The areas marked in white colour in the corners correspond to the negative direction of velocity.

Figures 5 and 6 show numerical calculation of axial and tangential velocity components in horizontal plane for square, pentagonal and hexagonal cross-section configurations. Axial position of the plane corresponds to maximum breakdown bubble diameters for pentagonal and hexagonal configurations and to maximum axial velocity
 $(z=0.5H)$
for square configuration and for other configurations at
 $h=2.5$
where the VB does not appear. One can see that the breakdown bubble diameter is smaller than
 $R/4$
. From figures 5 and 6 it is seen that the flow loses axial symmetry near the side wall. However, near the axis in the VB area the flow structure may be considered axisymmetric for both pentagonal and hexagonal configurations, and even for square configurations for the axial velocity components, but it has insignificant distortions in the distribution of the azimuthal velocity components. With a decreasing number of angles the intensity of the corner vortices increases (the negative velocity values in the angles are shown in white colour). Investigation of asymmetrical structures in the near-wall region extends beyond the current study. Figures 4, 5 and 6 show that for
 $h=2.5$
at
 $Re=2000$
in the lower part of the polygonal containers a deviation from a rotational symmetry of the axial and tangential velocity components was observed for all cross-section configurations. A similar distribution of tangential velocity components, but for larger Reynolds numbers, was observed also in the cylindrical container (Sørensen et al.
Reference Sørensen, Naumov and Mikkelsen2006, Reference Sørensen, Naumov and Okulov2011; Lopez Reference Lopez2012) within the range
 $3.0<h<3.5$
. We can assume that the onset of the three-dimensional instability in pentagonal, hexagonal and octagonal configurations is similar to that in the cylinder at increasing Reynolds number. For octagonal configuration at
 $h=2.5$
there are two VBs with the shape and location very close to cylinder (Escudier Reference Escudier1984). In contrast to other polygons, the flow condition for the octagonal configuration was very close to that for cylindrical geometry.
The results show that, at steady conditions, there are no asymmetric distortions of the flow topology in the VB area due to the non-axisymmetric effect of the polygonal geometry of the used containers (neither in horizontal nor in vertical cross-section). However, according to Naumov et al. (Reference Naumov, Dvoynishnikov, Kabardin and Tsoy2015) for
 $h=2$
, the critical Reynolds numbers at which the flow becomes unsteady are reduced in comparison with a cylindrical configuration that is most likely connected with the non-axisymmetric configuration of polygonal containers.
3.2 Onset of breakdown bubble
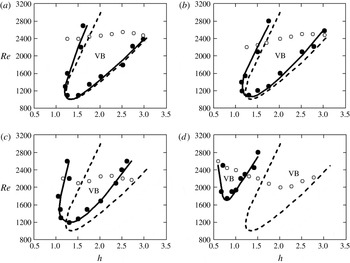
Reynolds numbers corresponding to VB emergence were computed numerically and measured experimentally for different aspect ratios
 $h$
and are summarized in the diagrams presented in figure 7. Dashed curves represent the VB diagram obtained by Escudier (Reference Escudier1984) for the cylinder, solid curves show numerical simulations for the polygonal containers, solid circles are experimental visualizations and LDA measurements of breakdown bubble onset and open circles indicate Reynolds numbers where unsteadiness appears. The transition from a steady to an unsteady state was found to occur within the range
 $2000<Re<2550$
at
 $0.5<h<3.0$
for all investigated geometries. The critical Reynolds numbers are slowly reduced compared with the ones in a cylindrical configuration. Numerical simulations show that in a quadrangle configuration, the first pulsation has an azimuthal wavenumber of 4. At
 $0.5<h<1.5$
and at the onset of vortex breakdown, an insignificant stabilization of the flow and a small rise of the unsteadiness boundary are observed. The polygonal shape should cause the growth of disturbances with the same azimuthal wavenumber but this turns out to be true only for the quadrangle one. The first pulsation in the pentagonal configuration has an azimuthal wavenumber of 3, and in the hexagonal and octagonal configurations, the behaviour of the transition boundary was similar to the one in the cylinder (Sørensen et al.
Reference Sørensen, Naumov and Mikkelsen2006).
The panels in figure 7 clearly show that reducing the number of cross-section angles from a cylinder to a square shifts the vortex breakdown region to higher Reynolds numbers and smaller aspect ratios,
 $h$
. The boundary of the breakdown region is found to change depending on the number of angles in the container cross-section within the range from four to eight. Although for the octagonal flow configuration the condition was very close to that for the cylindrical geometry. Thus it appears that the effect of the cross-section configuration where the number of angles exceeds eight may be neglected (figure 7
a). After the analysis of these diagrams it became clear why the steady vortex breakdown bubble was not detected previously in the cubical container (Okulov et al.
Reference Okulov, Meledin and Naumov2003; Naumov et al.
Reference Naumov, Dvoynishnikov, Kabardin and Tsoy2015) at aspect ratio
 $h=2$
(figure 7
d). The previous experiments did not cover the range
 $0.5\leqslant h\leqslant 1.2$
at which the steady VB occurs in the container with square cross-section. The obtained results prove that VB does not appear in steady flow regimes below
 $Re=3000$
for
 $h=2.0$
. It may be concluded that the VB areas do not overlap for square and cylindrical containers in the entire range of parameters in the
 $(Re,h)$
diagram.
Boundaries of VB location in the cylinder (dashed line) and containers with octagonal (a), hexagonal (b), pentagonal (c) and square (d) cross-sections in the (
 $Re,h$
) plane (solid line). Solid circles – LDA experimental points of the breakdown onset, and open circles – critical Reynolds numbers where unsteadiness appears.

The flow comparison for
 $h=0.8$
and different
 $Re$
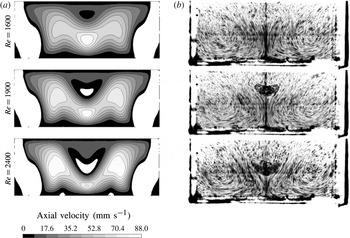
for the container with square cross-section is presented in figure 8, where white areas in the central part of the numerical calculation indicate the negative values of axial velocities corresponding to the steady breakdown bubble. The scenario of the VB formation and evolution for a rectangular container with
 $0.5\leqslant h\leqslant 1.2$
is basically the same as for other investigated configurations. First, there is a slowdown in the axial velocity component (figure 8 for
 $Re=1600$
)
 $V_{z}$
near a rotating lid similar to the cylinder (Naumov et al.
Reference Naumov, Mikkelsen and Okulov2014). Then, the stagnation points are formed on the container axis, and with further increase in
 $Re$
the breakdown bubble increases in size and shifts toward the fixed bottom. At
 $Re>2400$
, the VB begins to oscillate along the axis and its boundaries are blurred.
Experimentally measured (by LDA) marginal Reynolds numbers and axial location of breakdown
 $z/H$
, corresponding to the onset of bubble breakdown, depending on the number of cross-section angles
 $N$
for different aspect ratios
 $h$
.
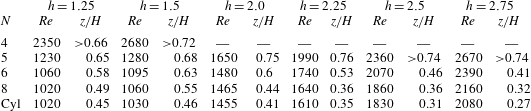
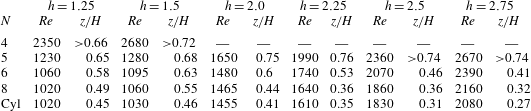
Table 2 shows experimentally measured (by LDA) Reynolds numbers and the axial location of breakdown,
 $z/H$
, corresponding to the onset of bubble breakdown, depending on the number of cross-section angles
 $N$
for different aspect ratios. The results show that the location of the stagnation point on the container axis moves toward the rotating disk, and the marginal Reynolds number increases with decreasing
 $N$
. Italics in the table show the Reynolds numbers, corresponding to the onset of VB in the unsteady flow regime, for square cross-section (
 $h=1.25$
and 1.5) and pentagonal cross-section (
 $h=2.5$
and 2.75). For the square cross-section configuration of a closed container the VB is not detected at
 $h>1.5$
and
 $Re<2800$
. The data of table 2 confirm that when the number of angles in the polygon cross-section is reduced, the main fluid flow interacts not only with the container walls, as in the case of the cylinder, but with peripheral corner vortices. At a result a significant part of the energy dissipates to corner vortices. This leads to a significant increase in the angular velocity of the disk, generating the main vortex structure, and further appearance of VB at a significant increase in the swirling flow.
Flow structures in the square container at
 $h=0.8$
and different
 $Re=1600$
, 1900 and 2400. The images in (a) represent numerical calculation of the axial velocity component. (b) Shows visualization by seeding particles in a vertical plane.

In a rapidly rotating flow, the centrifugal force induces a radial gradient of pressure
 $p$
. According to the cyclostrophic balance (Shtern et al.
Reference Shtern, Torregrosa and Herrada2012)
 $\unicode[STIX]{x2202}p/\unicode[STIX]{x2202}r=\unicode[STIX]{x1D70C}\unicode[STIX]{x1D714}^{2}/r$
, where
 $\unicode[STIX]{x1D70C}$
is the fluid density,
 $\unicode[STIX]{x1D714}$
is the swirl velocity and
 $r$
is the distance from the rotation axis. Therefore,
 $p$
increases with
 $r$
. The reduction of pressure near the axis, compared with the periphery, is smaller downstream from the swirl source (rotating disc) due to friction at the wall. Therefore, the near-axis pressure is smaller near the swirl source. This pressure difference drives the backflow near the axis. When a swirling flow converges to the axis, the near-axis pressure reduces, decelerating and reversing the downstream flow, i.e. a breakdown bubble develops (Shtern et al.
Reference Shtern, Torregrosa and Herrada2012; Herrada et al.
Reference Herrada, Shtern and Torregrosa2015). For the cylinder-shaped case, the swirling flow, directed away from the core, has direct contact with the wall. The flow in the multi-angle container is smoothed along the vertical ribs by angle vortices. Therefore, the main flow has less friction with the wall. In the case of a square configuration, this contact is minimal. Because of different energy losses due to friction at the wall, the axial vortices in various types of containers have different axial pressure gradients between the bottom and the rotating lid. In this case, there is extra energy loss from dissipation to angle vortices, which is maximal for the square container geometry. This creates different scenarios of breakdown bubble development.
Distribution of axial velocity component
 $V_{z}$
along the vertical axis for different polygonal container geometries at
 $h=2$
.

Analysis of the panels in figure 7 allows us to assume that the vortex breakdown onset in a triangular configuration may appear only at an extremely high Reynolds number. Numerical simulation has shown that VB onset becomes possible at
 $Re$
over 3000 for an aspect ratio
 $h<1.0$
. Thus, it may be concluded that steady VB does not occur in a triangular configuration since the flow becomes unsteady before the appearance of VB. However, the trend of vortex breakdown onset remains: with a decrease in the number of angles in the cross-section the vortex breakdown area shifts toward the larger
 $Re$
and smaller aspect ratio.
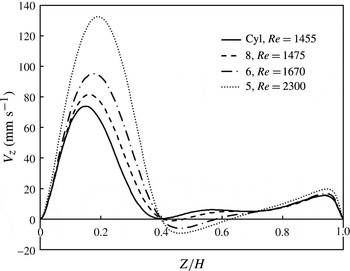
The distribution of the axial velocity component
 $V_{z}$
along the vertical axis for different polygonal geometries at
 $h=2$
is presented in figure 9. The solid line shows the velocity profile for the cylinder, where the vortex breakdown bubble emerges at
 $Re=1455$
and location
 $z/H=0.41$
. The conditions for positioning of the upstream stagnation point of the breakdown bubble at
 $z/H=0.41$
are executed at
 $Re=1475$
for octagonal,
 $Re=1670$
for hexagonal and
 $Re=2300$
for pentagonal configuration of the closed container. Consequently, the ratio of angular velocities of the rotation disk with polygonal and cylindrical configurations varies from 1.58 for pentagonal to 1.02 for octagonal configuration.
Considering the energy loss by the criterion of the onset of VB, regardless of the location of the stagnation point on the
 $z$
axis, the increase in the supplied energy may be found from table 2 for different aspect ratios
 $h$
. Since
 $Re\approx \unicode[STIX]{x1D6FA}$
and kinematic energy
 $E\approx \unicode[STIX]{x1D6FA}^{2}$
, the energy loss for repeatability of the conditions of VB emergence may be evaluated as
 $\unicode[STIX]{x0394}E(N)\approx Re_{m}^{2}(N)/Re_{cyl}^{2}$
, where
 $Re_{m}$
is the marginal Reynolds number for the polygonal container and
 $Re_{cyl}$
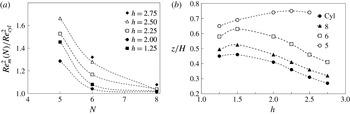
is the marginal Reynolds number for the cylindrical geometry. The duplicate ratio of marginal Reynolds numbers and stagnation point location
 $z/H$
at VB emergence for the polygonal geometry at different aspect ratios is presented in figure 10.
There are differences peculiar to the swirling flow in the polygonal geometry that play an important role when interpreting the obtained results. An increase in the energy input for repeatability of conditions of the VB emergence may make up to 30 %–40 % (of the energy in the cylinder) for the pentagonal configuration and increases with an increase of the aspect ratio
 $h$
. For the hexagonal configuration it is from 10 % at
 $h=2.0$
to 35 % at
 $h=2.5$
(figure 10
a). At that, the VB is not formed in the cylinder at
 $h<1.25$
. However, for the hexagonal container due to energy dissipation the location of the steady VB shifts to the aspect ratio
 $1.0<h<2.5$
, and for the rectangular one to
 $0.5<h<1.2$
(figure 7). The flow condition for the octagonal configuration was very close to that for cylindrical geometry. The increase in the energy input does not exceed 2 %–4 %, which is within the measurement accuracy.
This research has revealed that the increase in Reynolds number and aspect ratio
 $h>1.5$
creates different scenarios of the swirling flow development in closed polygonal containers (
 $N<6$
) and a cylindrical geometry. For the cylinder, octagon and hexagon the VB emergence occurs according to one scenario: with an increase in the aspect ratio the stagnation point location shifts towards the fixed bottom. In the pentagon, on the contrary, with increasing
 $h>1.5$
the stagnation point location shifts towards the rotating lid (figure 10
b), and for the square, the steady VB at
 $h>1.2$
is not formed at all. The influence of the rotating disk generating the vortex structure is substantial at
 $h<1.5$
, which leads to the decrease in the counterflow region and the location of the stagnation point on the container axis (inflection point in figure 10
b).
Duplicate ratio of marginal Reynolds numbers (a) and axial stagnation point location (b) for the polygonal container geometry at different
 $h$
.

3.3 Effect of container volume
The relationship between the volume of the container and the VB behaviour is now discussed. The new insight into some practical aspects of container flows enables a more detailed investigation.
Table 1 (§ 2.2) presented geometrical information for the used containers with polygonal cross-sections. It is obvious that the volume of the container increases with a decrease in the cross-section angle at the same aspect ratio. The ratio of the area of a square container to the area of a cylinder is maximal for the cases considered and equal to 1.27. For example, for a triangular cross-section configuration, where the numerical calculations showed the absence of VB under the steady flow, the ratio was significantly higher and amounted to 1.57. Extrapolating the data from figure 10(b), it may be assumed that a much larger input energy is required to form the reverse flow on the container axis, and steady VB is not possible in a triangular configuration.
Ratio of marginal Reynolds numbers, depending on the number of cross-section angles
 $N$
for different aspect ratio
 $h$
.
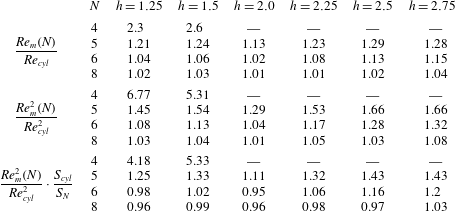
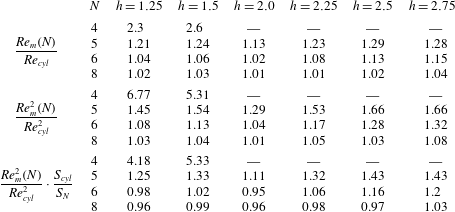
Table 3 shows the ratio of Reynolds numbers corresponding to the onset of VB in the upper part, the duplicate ratio of Reynolds numbers in the middle part (figure 10
a) and the duplicate ratio of Reynolds numbers normalized by the volume of the container, depending on the number of cross-section angles
 $N$
for different aspect ratios. It may be seen that the normalized energy loss for repeatability of the conditions of VB emergence is less or approximately equal to 1 for the octagonal configuration for the whole range of the aspect ratios and for the hexagonal container in the range of aspect ratio
 $1.25\leqslant h\leqslant 2.0.$
This means that the effect of increasing container volume, especially for small aspect ratios, does not play a decisive role for octagonal and hexagonal container configurations, i.e. energy dissipation in the corner eddies is not a determinant, while losses and reduced angular momentum on the container walls play the key role. With the increase in aspect ratio due to the increase of the path and larger contact with the walls when fluid flow tends to the fixed bottom, this ratio becomes balanced, and the dissipation effect becomes dominant.
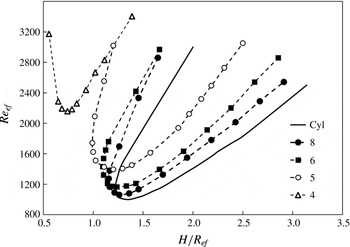
Boundaries of breakdown bubble location in the cylinder (solid line) and containers with different cross-sections in the
 $(Re_{ef},H/R_{ef})$
plane with
 $N$
as a parameter.

This conclusion may be confirm by comparing the present study and the previous works by Yu et al. (Reference Yu, Lee, Zeng and Low2008), Yu & Meguid (Reference Yu and Meguid2009) where the volume of the cylindrical container changes due to inclined or wavy side walls. The swirling velocity grows with the decrease in cavity radius when the swirling flow along the non-rotated lid converges toward the axis. However, if the container volume increases near the area of the non-rotated lid, the swirling velocity decreases. Thus, the adverse pressure gradient is also decreased and the vortex breakdown onset is slowed. On the other hand, the side wall serves to dissipate the angular momentum of the fluid when the fluid moves along it. When both the divergence and dissipation have the same effect on the adverse pressure gradient the vortex breakdown is suppressed (see Yu & Meguid (Reference Yu and Meguid2009, figure 5) and Yu et al. (Reference Yu, Lee, Zeng and Low2008, figure 8)). The results in figure 7 show similar behaviour for polygonal containers, but the considered polygonal geometry is a more complicated case due to non-axisymmetric container configuration. The resultant effect depends on the competition between these two opposite influences when dissipation due to friction at the side wall decreases with a decrease in the cross-section angle, but the volume of the container increases.
To avoid the volume influence on the vortex breakdown phenomena the effective radius
 $R_{ef}$
(table 1) is used as a scaling parameter. Thus, the effective Reynolds number becomes
 $Re_{ef}=\unicode[STIX]{x1D6FA}R_{ef}^{2}/\unicode[STIX]{x1D708}$
. In figure 11, the VB boundary curves are plotted in terms of
 $Re_{ef}$
versus
 $H/R_{ef}$
with
 $N$
as a parameter.
As can be seen in figure 11, the boundary curve for
 $N=5$
is not so close to
 $N=6,8$
and the curve for
 $N=4$
does not intersect other curves. This means that the present modified parameters are not suitable for the polygonal containers with
 $N<6$
. However, the effect that dominates in these polygonal configurations results in similar trends in the VB boundary curves. The smaller
 $H/R_{ef}$
at which the VB onset takes place for
 $N=5,6,8$
is located in the range 1.2–1.3 and corresponds to the results of Yu et al. (Reference Yu, Lee, Zeng and Low2007) showing that for aspect ratios below 1.3 the side wall effect on vortex breakdown behaviour may be neglected if the length of the stationary bottom wall is more than three times of that of the rotating bottom wall. They showed that the aspect ratio has a dominant effect on the appearance of VB, and that cylinder-to-disk ratio
 $(\unicode[STIX]{x0394}R)$
is beyond 2.6, the flow structure is not affected by a further increase of this parameter.
The vortex breakdown curve for the square cross-section (figures 7 and 11) is somewhat similar to that in the limiting case of the cylindrical container with the partially rotating end wall e.g. in the no side wall effect region (see Yu et al. (Reference Yu, Lee, Zeng and Low2007, figure 3)) with
 $\unicode[STIX]{x0394}R>1.6$
. Here the vortex breakdown boundary curves exhibit a new regime and in the range
 $1.8<\unicode[STIX]{x0394}R<2.6$
a corner vortex appears in the bottom corner region at
 $Re=2000$
. In our case for the square cross-section
 $r_{4}/R=1.41$
and
 $R_{ef(4)}/R=1.13$
, the influence of the bottom corner vortex is insignificant. This is a more complicated case due to dissipation effect on the swirling velocity that causes a decrease in angular momentum in the near-axis region.
It is of particular interest to note that the characteristics of the vortex breakdown boundary in the ‘no side wall effect’ region (Yu et al.
Reference Yu, Lee, Zeng and Low2007) are analogous to those in the square cross-section (figure 7
d). However, the two boundary curves also demonstrate obvious differences. For example, the smallest Reynolds number (around 1700 at
 $h=0.8$
) for the onset of vortex breakdown in the square cross-section container is higher than that (at approximately 1000) for the onset of VB in the ‘no side wall effect’ case. The critical
 $h$
, below which there is no VB, is lower for the square (approximately 0.6 compared to 0.95) container. Finally, the Reynolds number for the onset of VB increases more rapidly with aspect ratio increasing in the ‘no side wall effect’ region compared with that for the square cross-section.
4 Conclusions
The VB in the confined flow generated by a rotating disk, embedded in the upper lid of closed containers with different cross-section geometries has been analysed experimentally and numerically for different aspect ratios
 $h$
. The experimental and numerical results for the upstream and downstream stagnation point locations are found to be in a good agreement. This research has revealed that the increase in Reynolds number creates different scenarios of the swirling flow development in closed containers with polygonal cross-sections and cylindrical configurations.
The vortex breakdown boundary curves for the onset of VB have been summarized over a wide range of parameters. The new insight into some practical aspects of container flows enabled a more detailed investigation of the flow structure for non-axisymmetric geometry of a closed container. In contrast to the cylindrical configuration, the polygonal container geometry a priori assumes a dependence on the azimuthal coordinate. Both the experimental and numerical studies reveal that the VB position changes when decreasing the number of cross-section angles at the same aspect ratio. These studies show that at the same Reynolds number, when decreasing the number of angles in the cross-section ranging from eight to five, the stagnation point shifts towards the rotating disk.
The obtained results are compared with the flow structure in the closed cylindrical container. The results allow revealing regularities of formation of the VB depending on
 $Re$
,
 $h$
and cross-section geometry of the closed container. It is found that reducing the number of cross-section angles from eight to four shifts the breakdown bubble onset to higher Reynolds numbers and smaller aspect ratios. The VB region for the octagonal cross-section was detected to almost correspond to the one for cylindrical container but these areas for square and cylindrical containers do not overlap in entire range of aspect ratios. Since the flow condition for the octagonal configuration is very close to that for cylindrical geometry the effect of cross-section for geometries with more than eight angles may be neglected.
The effects of corner vortex have been found and analysed. The aspect ratio was found to have a dominant effect on the appearance of vortex breakdown. The resultant effect depends on the competition of two opposite influences where dissipation due to friction at the side wall decreases with a decrease in the cross-section angle, but the volume of the container increases. Presumably, to produce vortex breakdown in a triangular configuration there is a need for an extremely high Reynolds number. Thus, it could be concluded that steady vortex breakdown does not occur in a triangular configuration because the flow may become unsteady before vortex breakdown appears.
It is necessary to consider these scenarios in the design of industrial vortex combustion chambers, often shaped as polygonal containers, since chambers with cylindrical cross-section are much more expensive. Thus, varying the number of angles in the chamber while designing, one can create operating regimes in which it is impossible for vortex breakdown bubble to occur, thus creating conditions necessary for heat and mass transfer. The obtained results are also important for the development of vortex technology in biochemical reactors, etc. where heat and mass transfer significantly depend on the flow instability and vortex breakdown phenomena. In future works it may be interesting to investigate the time-dependent flow behaviour for such a flow problem.
Acknowledgement
This work was supported by the Russian Foundation for Basic Research (grants nos 15-08-00186 and 15-08-05220).