Alcoholism is a heterogeneous disorder, and many typologies have been proposed over the past 150 years to describe its multiple forms (Babor, Reference Babor1996; Leggio, Kenna, Fenton, Bonenfant, & Swift, Reference Leggio, Kenna, Fenton, Bonenfant and Swift2009). All have a common goal: to characterize the heterogeneity of symptomatology and alcoholic course so as to more accurately identify the phenotypes and differentiate their multiple etiologies. Such activity is not just a theoretical exercise; it has profoundly practical consequences. One of the most useful would be clinical, namely, the ability to differentiate prognosis, and potentially also develop more etiologically differentiated treatments simply on the basis of differentiating characteristics observed at an earlier point in the clinical course (Kranzler, Pierucci-Lagha, Feinn, & Hernandez-Avila, Reference Kranzler, Pierucci-Lagha, Feinn and Hernandez-Avila2003; Leggio et al., Reference Leggio, Kenna, Fenton, Bonenfant and Swift2009). The work of the last 30 years, based primarily on observations of the clustering of clinical symptomatology, has described two subtypes, with different ages of onset, levels of antisocial symptomatology and other psychiatric comorbidity, and different levels of heritability (Babor, Reference Babor1996). However, more recent studies (Bucholz et al., Reference Bucholz, Heath, Reich, Hesselbrock, Kramer and Nurnberger1996; Moss, Chen, & Yi, Reference Moss, Chen and Yi2007; Windle & Scheidt, Reference Windle and Scheidt2004) using newer cluster analytic techniques have suggested that more than two classes are needed to adequately capture the heterogeneity.
Within the past 15 years, several longitudinal studies have examined trajectories of binge and/or heavy drinking (Capaldi, Feingold, Kim, Yoerger, & Washburn, Reference Capaldi, Feingold, Kim, Yoerger and Washburn2013; Casswell, Pledger, & Pratap, Reference Casswell, Pledger and Pratap2002; Chassin, Pitts, & Prost, Reference Chassin, Pitts and Prost2002; Hill, White, Chung, Hawkins, & Catalano, Reference Hill, White, Chung, Hawkins and Catalano2000; Oesterle et al., Reference Oesterle, Hill, Hawkins, Guo, Catalano and Abbott2004; Schulenberg, O'Malley, Bachman, Wadsworth, & Johnston, Reference Schulenberg, O'Malley, Bachman, Wadsworth and Johnston1996; Windle, Mun, & Windle, Reference Windle, Mun and Windle2005) over 6 to 13 years, extending into the late 20s. Others (Capaldi et al., Reference Capaldi, Feingold, Kim, Yoerger and Washburn2013; Jackson & Sher, Reference Jackson and Sher2005; Lee et al., Reference Lee, Hill, Guttmannova, Bailey, Hartigan and Hawkins2012; Meier et al., Reference Meier, Caspi, Houts, Slutske, Harrington and Jackson2013) examined course heterogeneity for diagnosis and/or level of alcoholic symptoms, with the longest studies extending into the early 30s (Lee et al., Reference Lee, Hill, Guttmannova, Bailey, Hartigan and Hawkins2012; Meier et al., Reference Meier, Caspi, Houts, Slutske, Harrington and Jackson2013).
To date, only one project has longitudinally examined heterogeneity of course for alcoholic symptomatology well into adulthood, the time frame that is of most use for clinical practice. That work, by Jacob and colleagues (Jacob, Blonigen, Koenig, Wachsmuth, & Price, Reference Jacob, Blonigen, Koenig, Wachsmuth and Price2010; Jacob, Bucholz, Sartor, Howell, & Wood, Reference Jacob, Bucholz, Sartor, Howell and Wood2005; Jacob, Koenig, Howell, Wood, & Haber, Reference Jacob, Koenig, Howell, Wood and Haber2009), used growth mixture modeling (GMM) to map latent trajectory class membership for past-year DSM-IV alcohol dependence diagnosis over the interval between ages 15 and 56 (Jacob et al., Reference Jacob, Koenig, Howell, Wood and Haber2009). Diagnoses were coded from symptom reports obtained from retrospective timeline follow-back interviews that defined the occurrence of symptoms, year by year, between middle adolescence and middle adulthood. In analyses from two all-male veteran samples, a four-class model was the best fitting solution. Trajectory shapes and ages of peak problems mapped well onto subtypes of alcoholism previously described in the literature (Zucker, Reference Zucker, Zucker, Howard and Boyd1994, Reference Zucker, Cicchetti and Cohen2006). Precursive predictors of trajectory class membership also were generally consistent with earlier characterizations. However, the primary limitation of this work is that it used entirely retrospective data, basing results on the memories of alcohol dependent men over a 40-year interval.
The present study represents an effort to get closer to the actual experience of the symptoms. It utilized a combined retrospective and prospective assessment strategy to get closer to the actual point of symptom occurrence. Symptoms from age 15 to baseline were assessed retrospectively; the prospective part of the study started at mean age 30 and continued for 15 years, and was able to assess symptom reports much closer to time of occurrence (past 3 years) rather than requiring an anamnesis of events that occurred as much as 37 years earlier. As in the Jacob work, a methodology that integrates person-centered and variable-centered analysis, GMM (Muthén & Muthén, Reference Muthén and Muthén2000), was used to characterize individual variations in level of alcoholic symptomatology across time. In contrast to variable-centered research, which investigates the extent to which variables change together, person-centered methodology groups individuals by similarity of some trait. In the case of latent growth modeling, this is by way of similarity in trajectories (Muthén, Reference Muthén and Kaplan2004). In the variable-centered aspect of the GMM, the groups are then examined for similarities and differences. An essential feature of this work is that the shape of the individual trajectories does not resemble the shape of the mean trajectory (Maggs & Schulenberg, Reference Maggs and Schulenberg2005). Subsets of individuals have different developmental courses for problem alcohol use, but possibly none of them is described by the statistical artifact that is usually regarded as the course of the disorder. Moreover, in contrast to cross-sectional studies, prospective studies also identify the variety of different time courses of offset of symptomatology, an equally critical feature of the clinical picture. Most previous studies have used binary classifications, such as diagnosis, to define trajectories. However, given the statistically more powerful properties of dimensional over binary classification, the present work classifies variations in course by way of number of alcoholic symptoms occurring across time.
Finally, if different course trajectories reflect different etiologic pathways, then potentially there will be precursive life-course manifestations that reflect such differences. These would be of considerable clinical importance as signals that focused preventive programming needs to take place. Moreover, given that symptom trajectories in adulthood may be overlapping at specific developmental periods, life adaptation differences in addition to symptom level would also have utility in evaluating whether individuals with the same level of symptomatology may be on different addictive pathways.
With these issues in mind, our study had three goals: (a) to describe the number and shape of different trajectories of alcoholic symptomatology over the developmental interval between middle adolescence and middle adulthood, (b) to compare trajectories of symptomatology for men and women, and (c) to identify developmentally early predictors of trajectory class membership as well as concurrent factors that distinguish among the pathways in adulthood. Based on our own and others' previous work (see Zucker, Reference Zucker, Cicchetti and Cohen2006, for a review), at the least we anticipated finding a high trajectory class, with members whose nondrinking behavior both historically and in adulthood contained a significant antisocial component; a low symptom trajectory class, possibly with symptomatology increasing slowly over time in adulthood; and a group whose symptomatology accelerated rapidly to a high level in late adolescence/early adulthood, followed by a dropoff in symptomatology as adulthood progressed. Because of conflicting evidence in the literature, we felt a prediction of differences in male and female trajectory class composition was not possible.
Methods
Sample
This study examines symptomatic course in a high-risk but population-based sample of families, the Michigan Longitudinal Study (Zucker et al., Reference Zucker, Fitzgerald, Refior, Puttler, Pallas, Ellis, Fitzgerald, Lester and Zuckerman2000). The study recruited high-risk individuals and a contrast sample, both from the same neighborhoods. All men living in a four-county wide area in mid-Michigan who had been convicted of drunk driving with a blood alcohol level of 0.15% for first offense, or 0.12% for repeat offenders, were identified from court records. Initial recruitment blanketed an interval within approximately 2 years since the time of the offense. Recruitment continued sequentially thereafter until the necessary sample size was obtained; this procedure insured that the sample was one that had recently experienced significant alcohol problems. This selection procedure yielded a set of 173 men with Feighner diagnosis for probable or definite alcoholism (Feighner et al., Reference Feighner, Robins, Guze, Woodruff, Winokur and Munoz1972). (Later assessment also showed that all of the court-recruited subjects also met DSM-IV alcohol use disorder [AUD] diagnosis.) The sample was restricted to men at approximately the same life stage, by recruiting fathers who had at least one young (preschool age) male child. This recruitment strategy helps to limit developmental variations that would contribute to accumulation and subsidence of alcohol symptoms. The wives of these men were also recruited, so that female variation in alcohol symptom course could also be evaluated (173 court-recruited families). Wives' level of alcohol involvement was free to vary, but because of assortative mating, this procedure also accessed a heavy alcohol using subset of the population, among whom 19.4% also made diagnosis. A low alcohol involved but otherwise ecologically comparable set of men and women was ascertained by recruiting families with an identical family structure who resided in the same neighborhoods as the court-recruited men and women but who had no lifetime substance abuse history (102 contrast families). These participants were identified via door-to-door canvass in the “alcoholic family” neighborhoods. The procedure concurrently uncovered a population-based (but not currently court-involved) AUD sample of men and their wives (61 community alcoholic families). For these participants, the level of AUD was overall less severe than that of the court-involved group. The combined sample thus involved a set of families that were ecologically comparable and subject to the same stresses and pressures that their neighborhoods provided, but who differed in severity and currency of their alcohol involvement. This procedure is well suited to study the development of alcoholism, and in particular, to be able to examine how its onset and course vary in relation to other risk factors. The design is highly efficient in overcoming the problem with general population studies that the variables of interest are represented with such low frequency that the ability to detect interactions is compromised.
The current study focuses only on the men and their partners. A total of 336 families were involved (332 men, 336 women; mean age at baseline = 32.3 (SD = 4.8, range = 22–46). For a more detailed description, see Zucker et al. (2000). Participants were assessed extensively in their homes following the initial recruitment, with assessment repeated every 3 years for a total of five waves. The protocol included measures of substance use and abuse, psychiatric symptomatology and history, demographics, temperament, and family relationships.
Measures
Precursive childhood and adolescent information was collected retrospectively at baseline. Childhood predictors included family expression of alcoholism, child abuse, socioeconomic status, and childhood antisocial behavior.
Drinking and Drug History
The Drinking and Drug History (Zucker, Fitzgerald, & Noll, Reference Zucker, Fitzgerald and Noll1990) assessed onset of drinking and drunkenness as well as symptoms covering all DSM-III-R AUD criteria. This instrument incorporates items from national epidemiologic studies of drugs and alcohol (Calahan, Cisin, & Crossley, Reference Calahan, Cisin and Crossley1969; Johnston, Bachman, & O'Malley, Reference Johnston, Bachman and O'Malley1979), as well as from a structured clinical symptom questionnaire (Schuckit, Reference Schuckit1978). All of the items have been extensively used in a variety of survey and clinical settings. At baseline, participants were asked about 22 current problems/symptoms due to drinking, the first time the problem occurred, and the most recent occurrence. These retrospective reports were combined with the prospective assessments, carried out every 3 years for 15 years. The total number of symptoms was calculated at 3-year intervals, from age 15 to age 45. The onset of symptoms was defined as the youngest age of any reported symptom. Because there is no theoretically sound way to quantify symptoms that can vary widely in both frequency and impact (e.g., restricted my drinking to certain times of day vs. loss of job), each endorsed symptom was counted as occurring only one time at each interval.
Treatment, both formal and self-help, were also assessed on the Drinking and Drug History with a series of questions including when treatment was started, number of times attended, and most recent attendance.
Family expression of alcoholism
The subject created a family tree that indicated alcoholism of any relatives within two generations. Family expression of alcoholism reflected the percentage of the subject's relatives with an AUD diagnosis, weighted by their genetic relatedness to the subject (Zucker, Ellis, Fitzgerald, Bingham, & Sanford, Reference Zucker, Ellis, Fitzgerald, Bingham and Sanford1996).
Conflict Tactic Scales: Retrospective reports
History of child abuse, a predictor of adult alcohol problem outcomes (Langeland & Hartgers, Reference Langeland and Hartgers1998; Miller & Mancuso, Reference Miller and Mancuso2004; Simpson & Miller, Reference Simpson and Miller2002; Widom & Hiller-Sturmhöfel, Reference Widom and Hiller-Sturmhöfel2001), was assessed by asking the subject to describe the worst incident of physical punishment or abuse from their childhood (1 = spanked with hand; 4 = kicked, punched, hit with fist, beat up, threw child [e.g., threw across room], pushed or threw child into something [e.g., pushed into wall]; 5 = bruises left on body, or Child Protective Services involvement). Scores of 4 or 5 were counted as severe abuse; this was coded as a binary variable.
Demographic questionnaire
Educational attainment in adulthood was asked on a demographics questionnaire. In addition, family of origin socioeconomic status was operationalized as maximum occupational rating for mother or father, using the Duncan TSEI2 Socioeconomic Index (Stevens & Featherman, Reference Stevens and Featherman1981).
Antisocial Behavior Checklist
Adult symptoms and retrospective reports of childhood antisocial behavior, a precursor to substance use and abuse (Zucker, Heitzeg, & Nigg, Reference Zucker, Heitzeg and Nigg2011), were assessed via self-report on the Antisocial Behavior Checklist (Zucker et al., Reference Zucker, Ellis, Fitzgerald, Bingham and Sanford1996). A series of reliability and validity studies with populations has shown adequate test-retest reliability (0.91 over 4 weeks) and internal consistency (α = 0.67 to 0.93; Ham, Zucker, & Fitzgerald, Reference Ham, Zucker and Fitzgerald1993). The instrument differentiates between individuals with histories of antisocial behavior (e.g., convicted felons) versus individuals with minor offenses, versus university students (Ham et al., Reference Ham, Zucker and Fitzgerald1993; Zucker, Ellis, & Fitzgerald, Reference Zucker, Ellis and Fitzgerald1994). The instrument also discriminates alcoholic from nonalcoholic adults (Fitzgerald, Jones, Maguin, Zucker, & Noll, Reference Fitzgerald, Jones, Maguin, Zucker and Noll1991).
Diagnostic Interview Schedule (DIS)
Retrospective reports of childhood attention-deficit/hyperactivity disorder (ADHD) were assessed with the DIS Lifetime version (Robins, Helzer, Croughan, & Ratcliff, Reference Robins, Helzer, Croughan and Ratcliff1980), administered by a clinician. This is a well-validated and widely used diagnostic instrument that allows trained interviewers to gather extensive information about psychiatric, physical, alcohol-related, and drug-related symptoms. For substance use disorders, the test–retest reliability ranged from 0.53 to 0.86, and the validity related to the criterion, the World Health Organization Schedules for Clinical Assessment in Neuropsychiatry (Wing et al., Reference Wing, Babor, Brugha, Burke, Cooper and Giel1990), ranged from 0.45 to 0.71.
Dimensions of Temperament Scale (DOTS)
Temperament at baseline was measured via the attention span/distractibility and activity level scales of the DOTS Revised (DOTS-R; Windle & Lerner, Reference Windle and Lerner1986). Across factors, the Cronbach coefficient α ranged from 0.70 to 0.91 for preschoolers, 0.54 to 0.81 for elementary age children, and 0.62 to 0.89 for young adults. Windle and Lerner (Reference Windle and Lerner1986) report multiple Rs between the DOTS-R and measures of cognitive competence, social competence, and general self-worth to be .61, .40, and .38, respectively, for early adolescents, and .49, .54, and .41 for late adolescents. In addition, the multiple Rs between the DOTS-R attributes and a measure of depression was .40 for late adolescents.
Hamilton Rating Scale for Depression
Measures of psychopathology were also obtained at baseline. Depression, which has been repeatedly related to alcoholism (Schuckit, Reference Schuckit1994), was measured by two instruments. The clinician who administered the DIS later administered the Hamilton Rating Scale for Depression (Hamilton, Reference Hamilton1960), which yields a current level of depression and worst ever in lifetime. This scale has been shown to have adequate reliability (Bagby, Ryder, Schuller, & Marshall, Reference Bagby, Ryder, Schuller and Marshall2004). Interrater reliability in the current study was found to be 0.78 for current depression and 0.80 for worst ever depression.
Beck Depression Inventory (BDI)
The self-report BDI (Beck & Steer, Reference Beck and Steer1993) inquires about depressive symptoms over the past week. In a meta-analysis, this instrument has been shown to have adequate reliability (coefficient α = 0.81 for nonpsychiatric subjects; Beck, Steer, & Carbin, Reference Beck, Steer and Carbin1988).
Suicidality
Suicidal ideation or attempts were assessed on the Hamilton, the BDI, and the DIS. Suicidality was coded positively for any suicidal ideation or attempt throughout the lifetime, assessed at baseline.
I. Because insomnia has been related to alcoholism (Brower & Hall, Reference Brower and Hall2001), a Sleep Problems Index at baseline was derived from the question “How often do you get a restful night's sleep?”; responses of either not too often or hardly ever were the indicators of poor sleep quality.
Data analysis
GMM
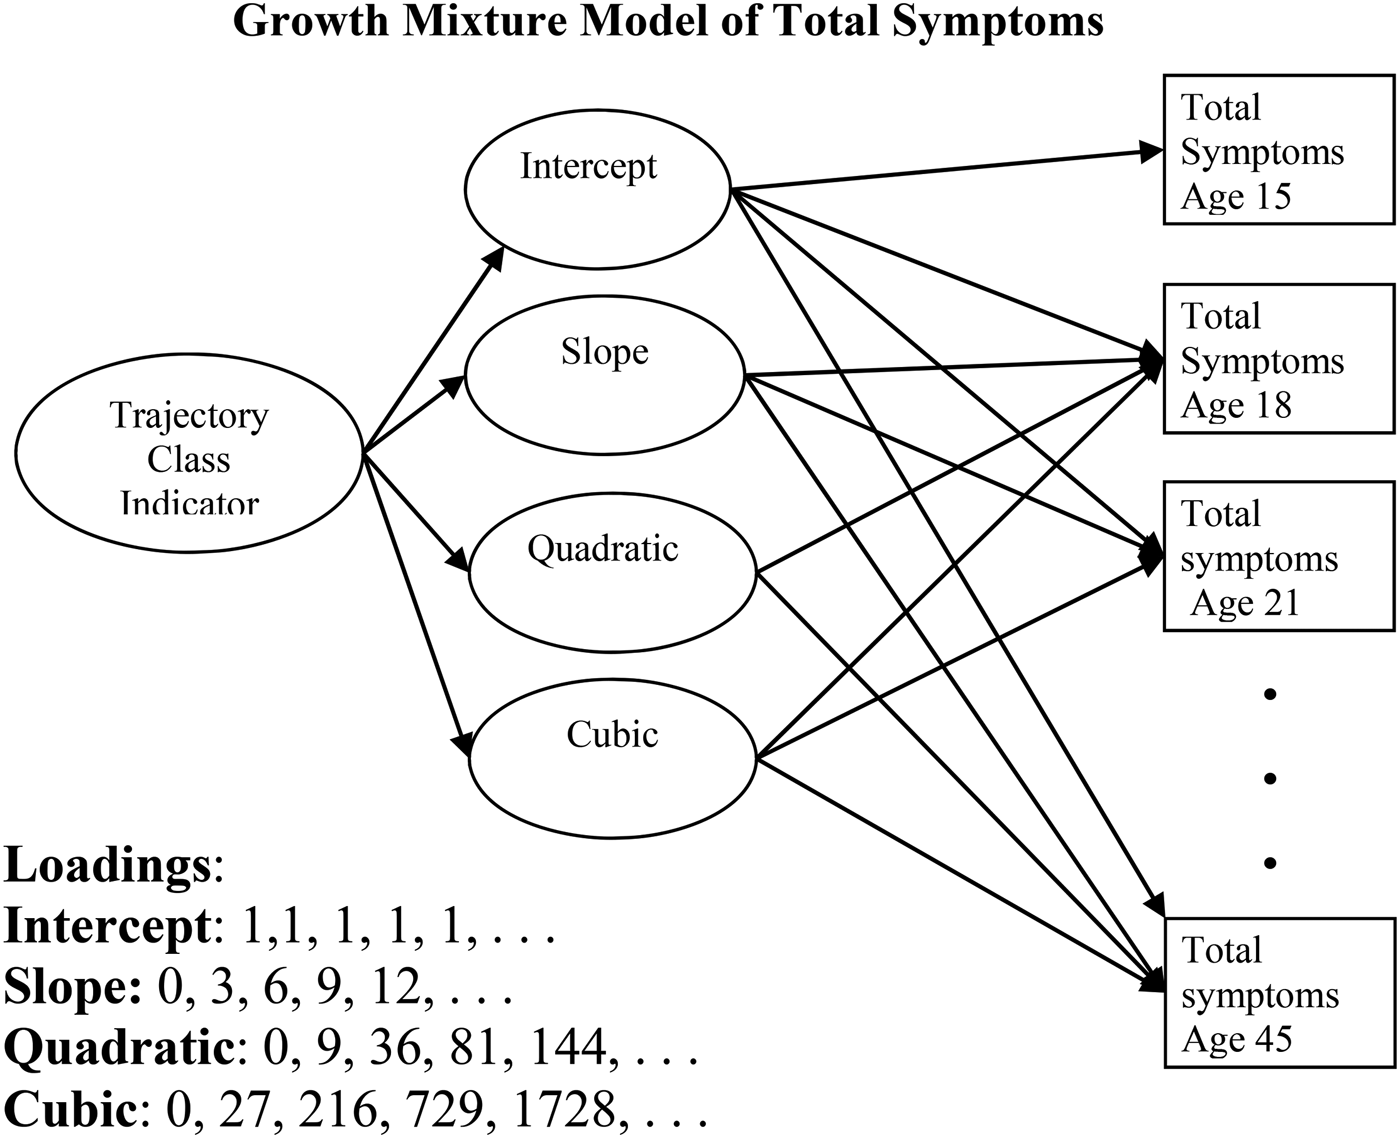
GMM was used to classify subjects into alcohol symptom trajectory categories, for all subjects who reached the threshold of at least two alcoholic symptoms at any time point (n = 253 men, 169 women). This threshold provided a sufficient level of symptomatology to allow categorization using GMM and also to parallel the work of Jacob et al. (Reference Jacob, Koenig, Howell, Wood and Haber2009). Mplus, Version 4.2 (Muthén, Reference Muthén, Marcoulides and Schumacker2001), was used to fit the growth mixture model shown in Figure 1, with number of symptoms at each age reported on the Drinking and Drug History, described above. Stable solutions were found using a latent class growth model, in which variance of growth parameters (intercept, slope, and quadratic and cubic parameters) is set to zero within a class (Nagin, Reference Nagin1999). Consequently, covariances between latent variables were also set to zero. The optimization technique was rectangular numerical integration with 15 integration points per dimension. The estimator was robust maximum likelihood (MLR in Mplus). The distribution was best fit by zero-inflated Poisson, as described in Results. The number of initial stage random sets of starting values was increased until the best loglikelihood was replicated (up to 2,000 starts, typically 500 were sufficient); 20 final-stage optimizations were used to insure that the global maximum was found.
Growth mixture model of symptoms of alcoholism. The continuous latent variables defining growth parameters are indicated by total symptoms of alcoholism at 3-year intervals from age 15 to age 45. The loadings are indicated in the bottom of the figure and create intercept, slope, quadratic, and cubic growth parameters. The four growth parameters are indicators for the latent categorical variable “trajectory class indicator.” To avoid figure clutter, indicators of total symptoms between ages 21 and 45 have been omitted.

The relationships between class membership and precursive as well as concurrent variables were then tested. Each person was assigned to the class for which he or she had the highest probability of membership according to the trajectory class analysis. The 79 men and 167 women who did not meet the two-symptom threshold were included as a “low symptoms” class (LO). For categorical variables, class membership was used as the independent variable in ordinal logistic regression with the LO class as the reference class, using PROC LOGISTIC. Class membership was used as the independent variable for analysis of variance, implemented with SAS PROC GLM, for continuous variables. Post hoc analyses were conducted if the omnibus F showed a significant relationship. If boxplots showed evidence of heterogeneity of variance, the omnibus F was derived from Welch analyses of variance, and differences in classes were found using PROC MIXED to allow for estimating variances separately for each class.
Missing data
The retention rate for families in the study has been very high. As of the fourth wave of data collection, out of an original 336 families, only 27 families declined to participate (8.0%). However, due to various issues related to funding across the 15 years, some families were not assessed at each wave. This explains the fact that we report follow-up rates of 56%–71% across the five waves of data for this manuscript. Because the nature of this missingness is “missing by design,” this satisfies the requirements for missing at random. The missing data algorithm implemented in Mplus was full information maximum likelihood, which uses all observations in the data set. Covariance coverage showed that no values were less than 10%, and 77% of values were greater than 0.49 (values > 0.50 are preferable; Schafer, Reference Schafer1997). At the baseline, there were 668 men and women in the study: at Wave 2, 426 (64%); Wave 3, 451 (68%); Wave 4, 475 (71%); and Wave 5, 367 (56%).
Results
Latent growth models
Figure 1, omitting the trajectory class indicator, illustrates the latent growth model, which determined the average trajectory shape for men. A quadratic model fit better than a linear model, MLR-adjusted Δχ2 (1) = 31.4, p < .0001, and a cubic model provided a better fit yet, Δχ2 (1) = 11.7, p < .001. Cubic models were used for each class in the growth mixture model analysis, for both men's and women's models. A cubic model that employed the zero-inflated Poisson distribution for the outcome, which reflects an excess of zeroes in the variable, was found to have a smaller Bayesian information criterion (BIC) than the Poisson model (11,213.99 vs. 13,757.76. for men; 5,870.38 vs. 7,287.58 for women). Therefore, zero-inflated Poisson was used as the outcome variable distribution.
Growth mixture models
The number of classes was determined by substantive as well as statistical considerations. Tables 1 (men) and 2 (women) show the fit indices, entropy, and number in the smallest class for solutions with two, three, four, and five classes. The six-class solution for both men and women was unable to replicate the best log likelihood with 2,000 starts, so it was not considered. For both men and women, the solutions with increasing number of classes produced lower BIC and Akaike information criterion (AIC) scores, which indicated better fit for higher number of classes. However, for men, the Vuong–Lo–Mendell–Rubin (VLMR) likelihood ratio test was significant for the three-class solution, indicating a better fit than for two classes. For the four-class solution, the likelihood ratio test was not significant, suggesting that the four-class solution was not a better fit than the three-class solution. In order to integrate the information provided by the three fit statistics, the decision on number of classes was made as a compromise between the BIC/Akaike information criterion and the VLMR criteria. This was carried out by selecting one higher number of classes than was indicated by the VLMR for both men (four-class solution) and women (three-class solution). We also visually inspected the four-class solution for men and the three-class solution for women and found that each class had a substantially different trajectory and there was at least 10% of the sample in each class.
Comparison of fit indices for solutions with different number of classes for men

Note: BIC, Bayesian information criterion; AIC, Akaike information criterion; VLMR, Vuong–Lo–Mendel–Rubin likelihood ratio test.
Comparison of fit indices for solutions with different number of classes for women

Note: BIC, Bayesian information criterion; AIC, Akaike information criterion; VLMR, Vuong–Lo–Mendel–Rubin likelihood ratio test.
Clinical and theoretical information from the literature also pointed to the appropriateness of selecting the number of classes we did. For men, the four-class solution mapped very closely onto the pattern of heterogeneity of clinical symptomatology, described by Zucker (Reference Zucker and Rivers1987) and others (see Zucker, Hicks, & Heitzeg, Reference Zucker, Hicks, Heitzeg and Cicchettiin press). When examining the four-class solution for women, we observed that three of the classes were similar to the three-class solution. The additional class that was derived in this solution was a late-onset class that comprised 21% of the sample. This class had a gradual increase in symptoms across the 30s, peaking around age 37–38 at around 2.5 symptoms. The trajectory then had a more abrupt recovery phase with a level of symptoms around 0.5 by age 45. There has been no evidence in the literature for this “fling” pattern. Given that this class included 20% of the sample, its appearance in the literature would have been expected. In light of this apparent anomaly, and the statistical evidence, we decided the most conservative resolution was to adopt the three-class solution.
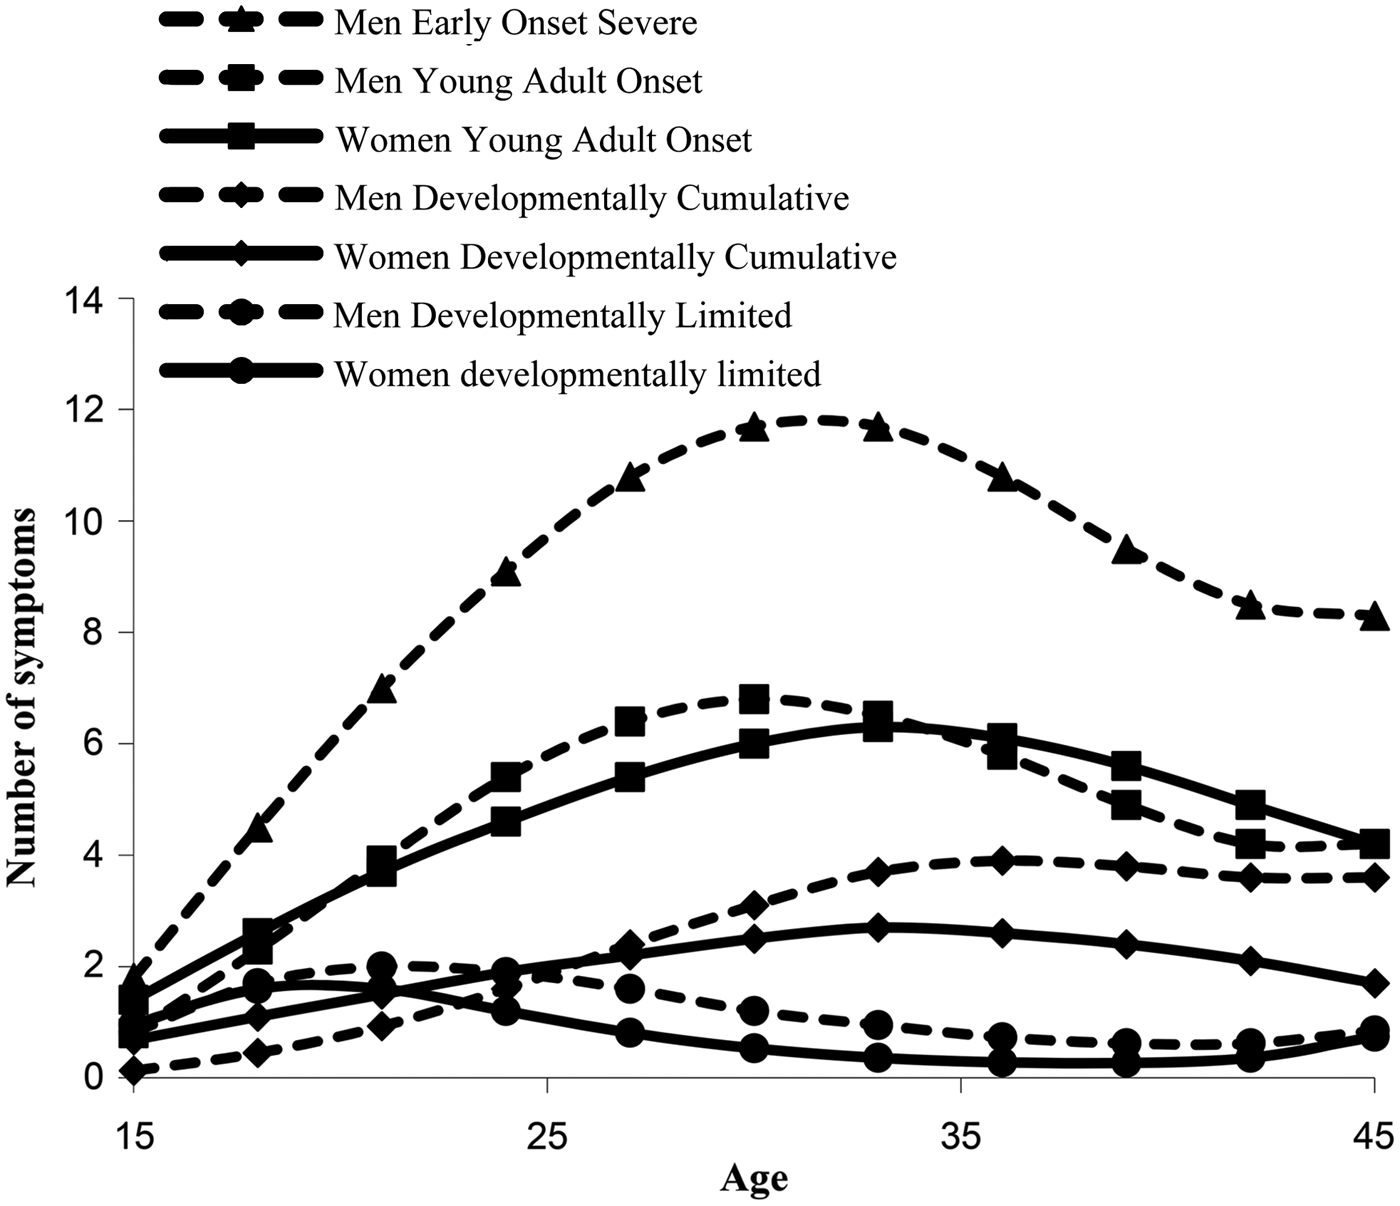
The accepted solutions for men and women are shown in Figure 2a and b. Thirteen percent of men (33) but no women, fell into an early onset severe (EOS) group (peak 13 symptoms); 31% men (78) and 20% of women (34) were in a young adult onset (YAO) group (peak 7 symptoms); and 29% of men (75) and 43% of women (73) were in a developmentally limited (DL) class that peaked at about 2 symptoms in the early 20s and fell off rapidly. Twenty-six percent of men (67) and 37% of women (62) were in a developmentally cumulative (CUML) class, which increased in a nearly linear fashion from the teens until leveling off at around 4 symptoms in the early 40s for the men, and leveling off at around 2–3 symptoms in the middle 30s for the women. Figure 3 illustrates the similarity in the shapes of the trajectories between genders. The average latent class probabilities for the men's solution were 0.90, 0.93, 0.96, and 0.92 for Classes 1–4, respectively. For women, they were 0.91, 0.91, and 0.96 for Classes 1–3, respectively.
(a) Trajectories of development of alcoholism symptomatology over age 15 to 45, for men. The smooth lines marked by triangles are the predicted trajectories from the model, and the lines marked by circles are the actual number of symptoms at each time point for the group. (b) Trajectories of development of alcoholism symptomatology over age 15 to 45, for women. The smooth lines marked by triangles are the predicted trajectories from the model, and the lines marked by circles are the actual number of symptoms at each time point for the group. YAO, Young adult onset; CUML, developmentally cumulative; DL, developmentally limited.

Comparison of men's and women's trajectories of alcoholism. The women's trajectories are depicted with solid lines and the men's with dotted lines.

Key points within trajectories appear to represent different levels of symptoms (i.e., beginning point, peak, and end point), and trajectory class names were selected to reflect these parameters. To test whether these key points are actually associated with significant differences in problems, we compared levels of problems within classes across key time points in the trajectories. We used data points from age 18 as the beginning and age 42 as the end of the time range for this analysis, because there were fewer cases that reported numbers of symptoms at ages 15 and 45. Peak points were chosen by visual inspection. Men in the EOS class showed significant increases in symptoms across the total range of the study from age 18 to age 42 (paired t test, p = .004), whereas there was no significant change for men in this class from the peak of the trajectory at age 30 to age 42 (men paired t test, p = .62). In contrast, the YAO class showed significant increases (men, paired t test, p < .001; women, paired t test, p = .01) from age 18 to the peak level at age 30 and significant decreases for men (paired t test, p = .002) from age 30 to 42. The CUML class showed significant increases from age 18 to 30 (men, paired t test, p < .0001; women, paired t test, p < .01) and was then stable from age 30 to 42 (men, paired t test, p = .73; women paired t test, p = .75). The DL class showed a significant decrease from its peak at age 21 to age 42 (men, paired t test, p < .0001; women, paired t test, p < .001).
Moreover, there were differences between classes that upheld the patterns seen in the trajectory diagrams. We tested this by comparing levels of symptoms across classes for all ages within the ranges that we report. The YAO class had greater numbers of symptoms than the CUML class at ages 30–36 (for men and women, all t tests, p < .005) and at ages 33–42 for women (all t tests, p < .05); however, for men at ages 39–45, the YAO class and the CUML class were not different (p > .28). The DL class had a higher number of symptoms than the CUML class at age 18 (men, p < .0001; women, p < .05); they were equivalent at age 24 for men and 21 for women, and this is reversed at ages 24–42 for women and ages 27–42 for men (p < .0001 for each age).
Predictors of class membership
Choices of predictors were driven by three considerations. First, the theoretical basis of the trajectory class categories dictated some of the variables we used for comparisons (e.g., CUML and DL trajectory classes are posited to be driven by different phenomena, and the EOS class similarly shows very distinct parallels to the theoretical writing about antisocial alcoholism.). Second, the focus of this work is to define trajectory pathway variations across developmental time. We explicitly therefore selected other variables to contrast that had received significant interest and support in the literature as predictors of pathway variation (e.g., precursive characteristics and correlates that predicted pathway variation at a developmentally later point, e.g., age of onset, speed of transition from one phase of drinking to the next, level of sleep problems, etc.). Third, another of the motivators for attacking this problem was the awareness that, if there were pathway differences over the course of development, then they should have indicators, comorbid characteristics, and so on, that marked pathway waypoint differences. If these could be demonstrated, then these would potentially serve as clinical indicators of future course, even before the pathway footprint was evident. This would have powerful clinical utility because it would allow the clinician to anticipate what lay ahead, and institute interventions that would head it off. In addition to the indicators already noted, we included here a number of symptomatologies known to be comorbid with alcoholism (e.g., depressive symptoms, suicidality, and smoking) and also known to be associated with more serious outcomes.
Men's predictors
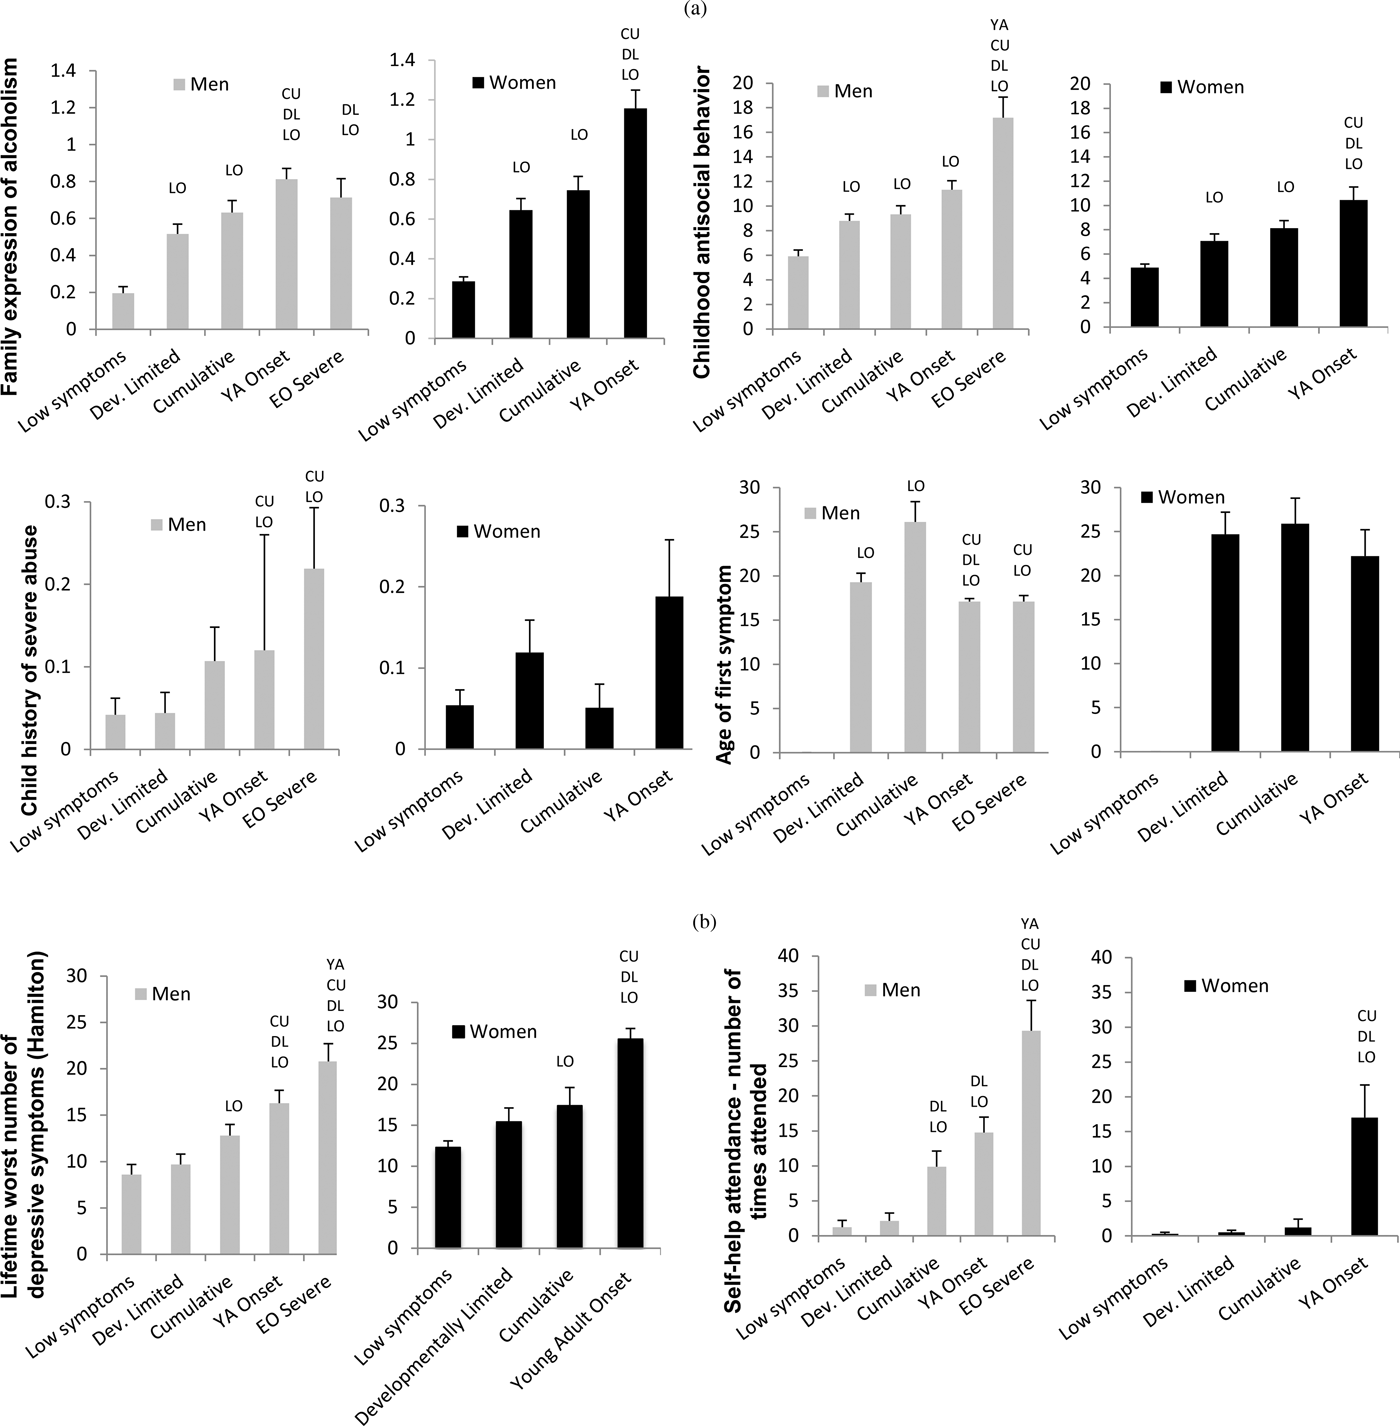
Selected class membership predictor variable differences are shown in Figure 4a (with significant differences in pairwise comparisons indicated). For men, the EOS class demonstrates the highest level of problematic predictors in most categories, including childhood antisocial behavior, child abuse history, and earlier onset of problems. The YAO class also shows deficits in almost all categories, but at a lower level than the EOC. In addition, this class has the highest family expression of alcoholism, suggesting it may be the most genetically influenced class. The YAO class shows earlier onset of symptoms than the CUML, DL, and LO classes and has significantly higher history of child abuse than the CUML and the LO.
(a) Precursive predictors of trajectory classes for men and women. (b) Contemporaneous covariates of trajectory classes for men and women. Depressive symptoms are from the Hamilton, worst ever symptoms. All significant pairwise differences are indicated. LO, Significantly different from low symptom class; DL, significantly different from developmentally limited class; CU, significantly different from cumulative class; YA, significantly different from young adult onset class.

The CUML class has a slower progression to problems, with the latest onset of first symptom and the longest interval between first drink and first symptom (not shown). This class has intermediate levels of problems across the board, with the exception of showing fewer than expected childhood ADHD symptoms (not shown). The DL class has fewer problems overall; however, there are more members in this class that have early onset drinking (onset by age 14, not shown), and problem drinking onset is earlier than the CUML class. In addition, early indicators of problems, including childhood antisocial behavior and family expression of alcoholism, are higher than in the low symptom group.
Women's predictors
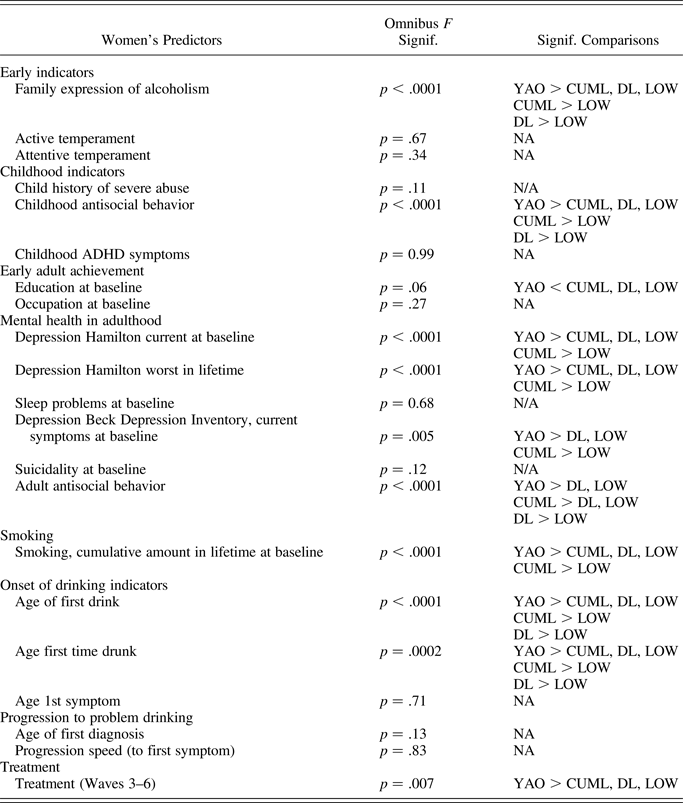
Women show similar patterns, although there are fewer significantly different pairwise comparisons. The YAO class has the highest deficits in each category, except for ADHD symptoms (not shown). The CUML class has the second highest level of deficits throughout, except that this class shows the highest level of ADHD symptoms (not shown). The DL class generally has the lowest levels of problems and, similar to the men, only differs from the low-symptom group on childhood antisocial behavior and family expression of alcoholism. For women, the age of onset of problem drinking is later than for men. However, the progression to problem drinking is at the same rate across all classes for women and happens as quickly as the fastest development shown by men (figure not shown).
Adult indicators of problems associated with symptom class membership are shown in Figure 4b. For men, the EOS class had the most severe levels of depression (worst ever in lifetime) and more than twice as much self-help attendance as the next lower class. For women, there was very little self-help attendance, except in the YAO class.
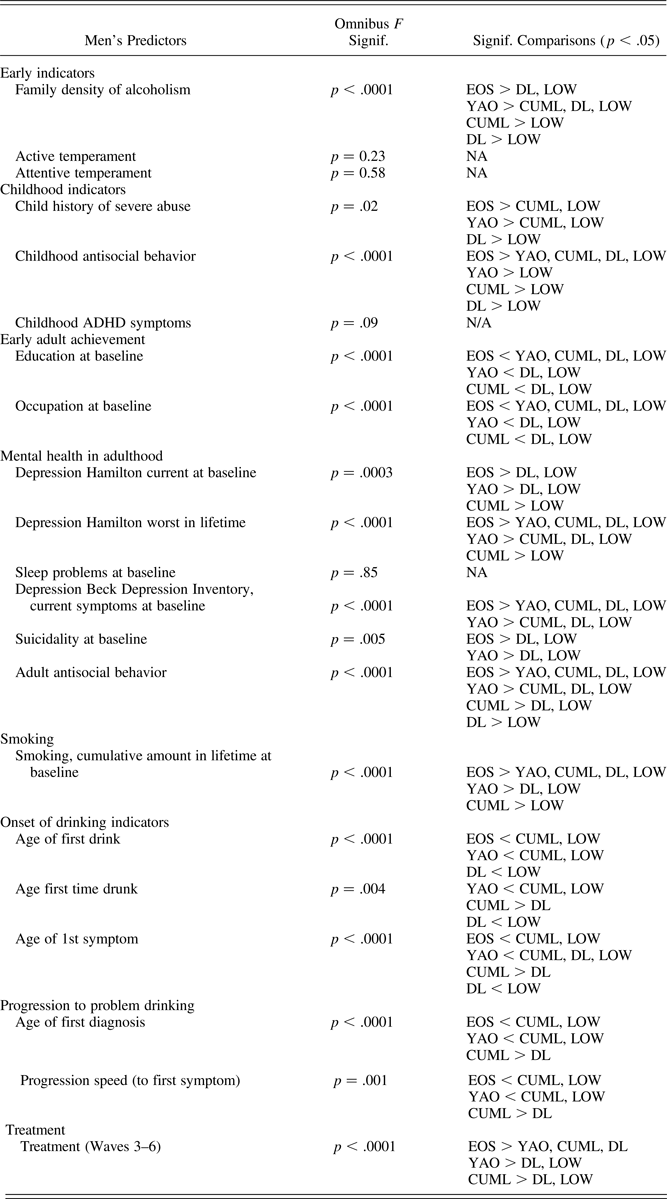
Differences between classes are shown in more detail in Table 3 for men and Table 4 for women. Here we report all of the pairwise comparisons for the predictors that had significant overall differences (omnibus F for continuous predictors and Wald chi-square for dichotomous predictors), including those presented in Figure 4a and 4b. The effect sizes for pairwise comparisons were small for most of the DL and CUML comparisons with the LO class and moderate to high for comparisons of YAO and EOS with the LO class. The men's most severe class, EOS, displays more problematic values than all of the other classes for a wide variety of predictors and covariates, indicating many problems both in childhood and in adulthood. The YAO class had the second highest level of problems for many predictors and had as many problems as EOS on two early indicators, family density of alcoholism and history of child abuse, as well as for current depression and suicidality at baseline. The CUML class was next highest on problems and differed significantly from the DL class in education, occupation, adult antisocial behavior and lifetime smoking. The DL class only showed differences from the low-symptom class on two early predictors, family density of alcoholism and childhood antisocial behavior, and on adult antisocial behavior. The patterns of predictors for women (Table 4) were quite similar.
Comparison of predictors and correlates of trajectory class membership for men

Note: EOS, Early onset severe; DL, developmentally limited; YAO, young adult onset; CUML, developmentally cumulative; ADHD, attention-deficit/hyperactivity disorder.
Comparison of predictors and correlates of trajectory class membership for women

Note: YAO, Young adult onset; CUML, developmentally cumulative; DL, developmentally limited; ADHD, attention-deficit/hyperactivity disorder.
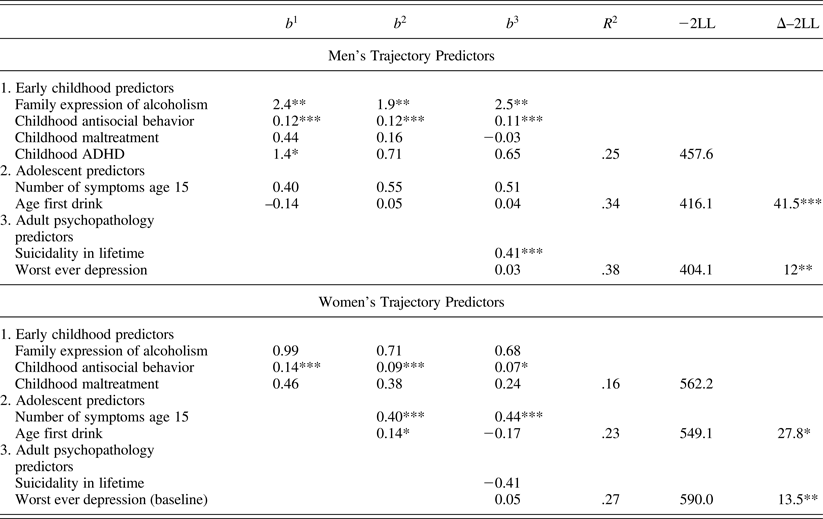
Stepwise logistic regression, with class membership as the dependent variable, was used to examine the contribution of predictors at different developmental stages. Table 5 shows that, for men, the block of predictors from early childhood had an R 2 of .25; adding predictors from around age 15 significantly (p < .001) increased the R 2 to .34, and adding the psychopathology variables evaluated around age 30 further significantly (p < .01) increased the R 2 to .38. For women, the block of predictors from early childhood had an R 2 of .16; adding predictors from around age 15 significantly (p < .05) increased the R 2 to .23, and adding the psychopathology variables evaluated around age 30 further significantly (p < .01) increased the R 2 to .27.
Predictors of trajectory class membership for men and women, based on stepwise logistic regression

Note: –2LL, –2 Log likelihood; ADHD, attention-deficit/hyperactivity disorder.
*p < .05. **p < .01. ***p < .001.
Discussion
Three main points have surfaced in this work. First, using current trajectory classification methodology, it is apparent that variations in level of alcohol symptomatology across the interval from adolescence to middle adulthood follow different trajectories of course for different subsets of individuals, and these trajectories map well onto the earlier typological literature. Second, those differentiated by class membership have different levels of functioning as adults. Third, it is possible to predict trajectory class membership by way of early indicators of risk. These findings may indicate different causal structures for each type of alcoholism.
We found four trajectory classes for men and three for women. The categorization for the men shows considerable parallels with the work carried out by Jacob et al. (Reference Jacob, Bucholz, Sartor, Howell and Wood2005, Reference Jacob, Koenig, Howell, Wood and Haber2009), even though those studies were based entirely on retrospective data. In three separate GMM analyses, their best fitting models for variation in alcohol dependence diagnosis over ages 15–56 also produced four trajectory classes. Their severe chronic class increased in probability of diagnosis from age 21 up to around age 27 and then remained elevated, a trajectory very similar to our EOS class. Their late-onset trajectory class increased from the early 20s through age 40, and was similar in time course to our CUML class. Their young adult alcoholics class decreased from the early 20s to age 40, like our DL class. They also found a class of severe nonchronic alcoholics, which was very high in probability of diagnosis from age 21 to 30 and then decreased substantially to age 40. Our YAO class is closest to this, albeit showing much less of a decrease in trajectory elevation across the same age range, perhaps reflecting a more severely troubled group in our study. Nevertheless, the agreement between our trajectory class shapes and the Jacob results is striking, although the relative levels of the measured variable between the classes is somewhat different. This may very well be due to the different metric used in defining trajectories, because in our analysis the measured variable was a continuous measure of number of symptoms, whereas the Jacob modeling was based on probability of dependence diagnosis, a categorical measure. Our study showed more differentiation between classes when examining predictors than did the Jacob studies; this is probably also due to the use in the current study of continuous measures of alcohol symptoms.
Two other studies have carried out trajectory analyses of drinking that bear some relevance to the present work. In a prospective study of those at high risk for substance abuse conducted from early adolescence to early adulthood (ages 12–23), Chassin et al. (Reference Chassin, Pitts and Prost2002) also found four developmental classes of binge drinking. While not using a direct measure of symptomatology as was done here, their binge drinking indicator has a strong association with problem (symptomatic) alcohol use (Amundsen & Ravndal, Reference Amundsen and Ravndal2010). The shapes of the developmental trajectories they found also map quite well onto the trajectory classes we observed. In another study, also of a high-risk sample (youth from high-crime neighborhoods), Oesterle et al. (Reference Oesterle, Hill, Hawkins, Guo, Catalano and Abbott2004) used semiparametric group-based modeling to assess trajectories of binge drinking across ages 13–18. They found four trajectory classes that also map well onto the current findings. Although they had more detail with which to characterize trajectories throughout adolescence, the project had not yet followed the children into adulthood, so it remains unclear whether their initial trajectories would have mapped onto the later variations in outcome that we observed. At the same time, the parallelism of the trajectory class solutions of these two studies with ours is confirmatory of the present findings, within the limits of their data. Moreover, because they both involved prospective assessments of the developmental interval where we had relied on retrospective data, they provide external validation of the retrospective measurements we depended upon to characterize the adolescent to young adult developmental trajectory component.
Differences in adult functioning by trajectory class membership were reflected in lower levels of education and occupational prestige, more frequent self-help attendance, and higher levels of depression for all except the DL class. This differentiation itself is confirmatory of the distinction between the DL adaptation and that found among all the others. That is, it is the only class where problems of drinking appear to be transitory, without consequences for later functioning.
The highest levels of comorbid symptomatology (suicidal ideation and depressive symptomatology on the Beck as well as the Hamilton) were in the highest symptom trajectory classes, suggesting a parallel to the symptomatology of Type II alcoholism observed in other studies (Babor, Reference Babor1996).
We also examined the relationships of trajectory class membership to developmental patterning of the problem indicators, comparing the level of contribution of early problem indicators, achievement in adulthood, and mental health indicators to class membership. The patterns for the most part showed that level of problems was ordered the same as the level of symptomatology in middle adulthood, across each of the types of problem indicators. This was a somewhat surprising result, because we had expected to find different patterns of predictors. The qualitative differences in the classes are in the shapes of the trajectories. In the same way, the patterns of predictors might look different if measured at different times in the trajectories. Our measurements of predictors were either in childhood or at baseline, around age 30. The trajectory shapes are accompanied by significant differences in variability of symptom level across time (e.g., there were significant increases for the EOS and YAO classes over age 18 to 30 and significant decreases for the DL class over the same period). Ultimately, in probing these differences, the question is why the trajectory shapes are different when the patterning of predictors appears to be the same, albeit different in level. One hypothesis is that contextual/cultural factors, in interaction with risk level and timing of developmental expectations, leads to differences in pressure for heavy use for the two sexes, thus producing the differences in shape. Another not necessarily mutually exclusive hypothesis is that some underlying diathesis, again in interaction with the environment, creates the differences. The recent literature on Gene × Environment × Development effects is demonstrating that such relationships are substantial, but they require a multilevel methodology to be able to demonstrate the effects. To provide but one example, Trucco, Villafuerte, Heitzeg, Burmeister, and Zucker (Reference Trucco, Villafuerte, Heitzeg, Burmeister and Zucker2014) found that genetic effects, in this case GABA receptor subunit alpha-2 gene (GABRA2), had different relationships to substance abuse symptomatology in late adolescence largely through the effects on (high) rule breaking and its concomitant peer group associations in middle adolescence. Such effects were only present for males, and for individuals who were G-allele carriers. They were not operative for those with the AA-allele variant. That is, the differentiated symptomatology in late adolescence is indicative of a differentiated etiology that had its effects earlier in the developmental process.
Trajectory class membership, indicative primarily of patterning differences in symptomatology in adulthood, was predicted by childhood indicators of risk. This is potentially clinically useful in helping to identify those at early risk for later serious problems with alcohol use, and it is also suggestive of the presence of different causal structures for the development of alcohol use disorder. These results map onto the four alcoholism subtype trajectories described by Zucker (Reference Zucker and Rivers1987, Reference Zucker, Zucker, Howard and Boyd1994, Reference Zucker, Cicchetti and Cohen2006) based on analysis of population epidemiologic and comorbidity data. His antisocial alcoholism, developmentally cumulative alcoholism, and developmentally limited alcoholism map easily onto our EOS, CUML, and DL trajectories. The antisocial alcoholic subtype is most likely to manifest child behavior problems, seen in our EOS class, which had the highest level of child antisocial behavior of all the groups. The higher level of heritability described for this subtype is also consistent with the EOS class having a high family expression of alcoholism.
In addition, although they employed very different statistical strategies, it is also useful to compare our findings with classification schemes developed by Windle and Scheidt (Reference Windle and Scheidt2004) and Zucker (Reference Zucker and Rivers1987). Using cross-sectional data from a large (n = 802) sample of inpatients, Windle and Scheidt performed cluster analysis of a variety of precursive and concurrent risk indicators of alcoholism, including measures of early risk factors, frequency of alcohol and other substance use, chronicity, consequences, and comorbid psychopathology. Their subtype solutions had very substantial correspondence with our findings, with one exception: they identified a polydrug class for which we found no parallel. The chronicity and poly drug use to be found in an inpatient substance abuse treatment population probably accounts for the difference with the Windle and Scheidt study.
In addition to the sex differences already noted, no EOS class was found among the women. The most plausible explanation for this finding is that sampling protocol differences intrinsic to the study, that is, that alcoholism was a requirement for the enrollment of males but was not for females in the court-recruited sample, led to a much denser and more severe level of alcoholism among the men. This would create a higher probability that the more extreme forms of the disorder would be present within the male subsample, but not in the female one, and would make the presence of an EOS severe female subgroup considerably more unlikely.
The main constraint on these findings is that the first 15 years of data on alcoholism symptomatology were retrospective, leading to the proposition that findings from age 15 to baseline age (average age 32) would be more subject to error. Only the older half of the study's age span would be free from this retrospective bias. Although this is a clear limitation, the previously noted parallelism with studies characterizing early symptomatology prospectively suggests that this is not a large issue. The trajectories all tend to peak around age 30, which is approximately the age at which the data began to be collected prospectively. While this may seem to indicate a difference between retrospective and prospective data, we do not believe this is the case. Rather, the inclusion criteria for the study included a precipitating event, which was being arrested for drunk driving with a high (0.15%) blood alcohol count. While some of the participants had experienced this in the past and would do so in the future, we know, on the basis of our prospective data, that this was an important event for many in terms of their drinking history, and this event persuaded some of the men to make changes in their drinking behavior (and their spouses as well, by association). We believe the difference between retrospective and prospective data in the trajectories reported here would be more likely to manifest in increased nuance in the reporting of alcohol symptoms. This might help explain why studies that collected prospective data on earlier life periods may have reported a higher number of trajectory classes within these times (Chassin et al., Reference Chassin, Pitts and Prost2002; Hill et al., Reference Hill, White, Chung, Hawkins and Catalano2000; Windle et al., Reference Windle, Mun and Windle2005).
Conclusions and commentary
The present work is part of a mounting body of longitudinal evidence which has systematically, over an interval of more than 25 years, reaffirmed the developmental heterogeneity of the alcoholic phenotype. Equally important, the work suggests that the most appropriate way to categorize these phenotypes is as trajectories of varying severity and course, which characterize patterns of symptomatic variation (or problem drinking) that can be identified considerably earlier than the life phase where the symptomatology is at its peak. These findings also lead to a challenge: whether cross-sectional (i.e., clinical) assessments can be crafted where the profile of current and historical information is able to predict not only severity of prognosis but also life course variation and/or remission later in time. To the extent that persons can be reliably classified by trajectory class membership, this becomes a clinical possibility. In addition to the prospective analyses carried out by Moss, Chen, and Yi (Reference Moss, Chen and Yi2010), our analyses to predict class membership using factors in place by age 15 is the beginning of such a strategy.