Implications
The study broaches the effects of farm origin and transport duration on physiological responses and meat quality parameters in suckling goat kids. Blood parameters, as well as carcass and Longissimus dorsi (LD) muscle quality parameters were measured. Results indicate that both farm origin and transport caused significant effects on most blood parameters, but minor changes on carcasses or on LD muscle. Although stress status owing to transport was found, this condition did not end up in clear effects on muscle quality parameters. Consequently, doubts arise about the suitability of meat quality parameters as stress indicator in young goat kids.
Introduction
Stress in farm animals is currently conceived as a reaction that occurs ineluctably when animals are exposed to adverse environmental conditions, which is the cause of many unfavourable consequences, ranging from discomfort to death (Etim et al., Reference Etim, Williams, Evans and Offiong2013). Pre-slaughtering handling and transport of animals is known as a major source of stress (Knowles and Warris, Reference Knowles, Brown, Warris, Phillips, Dolan, Hunt, Ford, Edwards and Watkins2000). Stress can affect both animal welfare and meat quality. In this regard, it is known that metabolic changes caused by stress can alter meat quality also in small ruminants (Apple et al., Reference Apple, Dikeman, Minton, McMurphy, Fedde, Leith and Unruh1995; Kannan et al., Reference Kannan, Terrill, Kouakou, Gazal, Gelaye, Amoah and Samake2000 and Reference Kannan, Kouakou, Terrill and Gelaye2003).
Many of the rearing systems carried out in sheep (especially those of dairy breeds), and practically all in goats in the Mediterranean countries are characterized by feeding goat kids exclusively on milk, and then being slaughtered at the age of 4 to 6 weeks (live weight (LW) about 10 kg, Marichal et al., Reference Marichal, Castro, Capote, Zamorano and Argüello2003). Some literature is available related to the effects of transport on heavier goat kids (e.g. from 21 to 29 kg in Nwe et al., Reference Nwe, Hori, Manda and Watanabe1996; 26 kg LW in Kannan et al., Reference Kannan, Terrill, Kouakou, Gazal, Gelaye, Amoah and Samake2000; 35 kg LW in Kannan et al., Reference Kannan, Terrill, Kouakou, Gelaye and Amoah2002; e.g. 22 to 54 kg LW in Kannan et al., Reference Kannan, Kouakou, Terrill and Gelaye2003; 29.6 kg in Kadim et al., Reference Kadim, Mahgoub, Al-Kindi, Al-Marzooqi and Al-Saqri2006; 24 kg in Zimerman et al., Reference Zimerman, Grigioni, Taddeo and Domingo2011), but there is a lack of studies assessing the effects of on-farm management and transport duration on physiological parameters and meat quality of young suckling goat kids. It is necessary to quantify the effect of on-farm factors on animal physiology during the rearing period in order to promote farm practices aiming a decreasing stress in goat kids. It has been described that goats are generally very susceptible to stress, as suggested by high ultimate pH values in goat muscle, compared for instance, with lamb muscle, and by the low concentrations of glycolytic metabolites in goat muscle and blood (Kannan et al., Reference Kannan, Terrill, Kouakou, Gelaye and Amoah2002 and Reference Kannan, Kouakou, Terrill and Gelaye2003; Webb et al., Reference Webb, Casey and Simela2005).
The aim of the study was to evaluate the effects of farming practices (high or low welfare-friendly management), and transport duration (2 or 6 h) on blood physiological stress response variables and meat quality traits of young goat kids. Studies of meat quality were carried out up to 8 days postmortem (dpm), with the purpose of assessing possible influences of such factors on meat ageing process as well.
Material and methods
Animals and farms
A total of 64 male single-born suckling goat kids from Spanish Blanca Celtibérica breed (meat aptitude; FEAGAS, 2015) in Andalusia, North of Granada (37°48'N 2°32'W and ~953 m above sea level) were used. This semi-arid Mediterranean region is characterized by irregular rainfall (370 mm average annual), and 15°C average annual air temperature.
Goat kids (average live BW 10.05±1.21, 30 to 36 days old) were reared in traditional Mediterranean semi-extensive system (Castel et al., Reference Castel, Mena, Delgado-Pertíñez, Camúñez, Basulto, Caravaca, Guzmán-Guerrero and Alcalde2003): the animals were suckled by their mothers, and they were kept permanently indoors, whereas the dams grazed some hours per day, depending on farmers’ facilities. Goat kids had no access to concentrates, hay, forages or other supplements. Dams received feed supplementation in sheds depending on the characteristics of the farm.
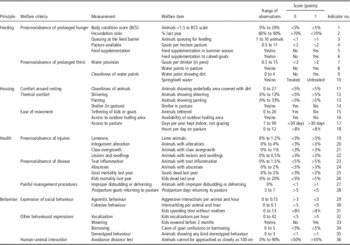
As no specific protocols were available for goats reared under extensive systems, welfare was evaluated in all the farms studied by means of a 36-item survey elaborated based on Welfare Quality® assessment protocol for cattle (Welfare Quality, 2009), and the animal-based indicators of goat on-farm welfare reviewed by Battini et al. (Reference Battini, Vieira, Barbieri, Ajuda, Stilwell and Mattiello2014), both of them adapted to meat goats in extensive systems. The average number of reproductive females per farm was 210. Some parameters were obtained from farm records (e.g. mortality or fecundation rate), whereas those related to health status and behavioural expressions were observed on individual animals. Given the small number of animals per farm, the amount of individual animals observed was 20% of adult animals, with a minimum of 25 animals/farm. Some parameters were recorded in goat kids (40 animals/farm), as mentioned in Table 1, in whichit is also indicated the score considered, together with their principles and criteria. A total of 51 farms were scored in a range between 0 and 14 points (the higher the score, the worse the welfare level) out of the 36 maximum score possible. Farms were finally classified within three categories, designed as good (GW: good welfare level farm, from 0 to 4 points), average (ranging from 5 to 8) and deficient welfare level (DW, over 9 points). Finally, two farms were selected for the study, belonging either to good (GW; 2 points) or deficient (DW; 11 points) category.
Criteria and indicators used to assess animal welfare in goat farms selected in the study, classified according to Welfare Quality® specifications with modifications

Experimental design
Goat kids after reaching the target LW were routinely kept with their mothers in the conditions of each farm overnight before experiment. In the morning (0830 h), animals randomly selected from both farms (64 goat kids) were distributed in four lots of 16 goat kids each (corresponding to two farms×two transport duration×eight animals×two repetitions). Animals were loaded at 0900 h in a livestock lorry with tailgate loading ramps (20° angle), and with natural ventilation (manual sidewall curtains). The vehicle was conditioned for goat kids with a density of 0.2 m2/animal, according to European Council Regulation 1/2005, on animal welfare during transport.
Transport duration (2 and 6 h) represented average and maximum distances, respectively, from farms to the slaughterhouse in the area of study. The lorry travelled through a two-lane, asphalted surface mountain road (altitude range from 950 to 1100 m), at an average speed of 40 km/h. In total, 32 animals were loaded and after 2 h (short road transport (ST) group), 16 of them were unloaded at the slaughterhouse, whereas the remaining goat kids continued the route for 4 additional hours (6-h transport, long road transport (LT)) until arriving to the slaughterhouse. The stocking density was kept by placing straw packs in substitution of the unloaded goat kids. The complete process was repeated the next day.
The study was carried out in summer, and air temperature (°C), relative humidity (%) and dew point (°C) were recorded every 5 min throughout transport using data logger (LOG32) positioned at goat kids height (average values for such parameters were 35.9±0.99°C, 24.8±1.22% and 11.8±0.50°C, respectively). Heat stress was estimated by means of the temperature–humidity index (THI), according to the equation proposed by Kliber (Reference Kliber1964). Minimum THI throughout the experimental period was 72.5, corresponding to the initial point (early morning), and maximum values for this parameter were 80.8 and 85.2, corresponding to the end point of short (2 h) and long (6 h) transport, respectively. Differences were not found between the 2 consecutive days in which the transport assays were carried out. After transport, animals were unloaded, slaughter live weight (SLW) was recorder again in order to assess possible weight loss. No differences in LW could be attributable to transport (GW: 9.84±1.03 initial weight on-farm and 9.77±0.98 final weight at slaughterhouse; DW: 10.26±1.36 initial weight on-farm and 10.19±1.02 final SLW after 6-h transport in all cases, P=0.618). Animals were slaughtered without lairage period. Manual electrical stunning was performed following standard commercial procedures according to Council Regulation EC 1099/2009 (250 V 1.0 A for 1 to 3 s, stunning tongs applied on both sides of the head).
Blood biochemistry and blood cell counts
Two blood samples were collected from each animal. The first one was taken at the farm the day before transport (about 0730 h) in order to determine basal status, and the second one, in the slaughterhouse, during the bleeding phase immediately after unloading, weighing and stunning (about 30 min after the end of each transport).
Blood samples were collected using disposable Vacutainer needles and duplicate tubes containing potassium ethylenediamine tetraacetic acid as anticoagulant. Serum biochemistry parameters analysed were as follows: glucose, non-esterified fatty acids (NEFA), cortisol, creatine kinase (CK) and lactate dehydrogenase (LDH). Glucose (mg/dl) was determined by an enzymatic capillary glucometer (Glucocar G+; Menarini Diagnostics, Shiga, Japan). NEFA (μmol/l) were determined by the ACS-ACOD spectrophotometric method (Wako Chemicals GmbH, Neuss, Germany). Plasma cortisol (ng/ml) was determined with a commercial ELISA kit (DRG Instruments, Marburg, Germany), and quantified in 96-well microplates. Creatine kinase and LDH activities (UI/l) were measured by an UV-kinetic method, using an Olympus AU 400 auto-analyzer with original reagents (Olympus, Tokyo, Japan).
Haematological parameters (i.e. erythrocytes, leucocytes, haematocrit, haemoglobin) were assessed by using a semiautomatic electronic blood cell counter, Sysmex F-800 (Sysmex; Toa Medical Electronics, Kobe, Japan) according to the protocol of the International Committee for Standardization in Haematology (1984). Subsamples of blood were smeared onto microscope glasses and, after staining with May–Grunwald–Giemsa according to standard procedures, differential white blood cells (monocytes, lymphocytes, segmented and eosinophils as percentages of different cell populations) were counted. Haemoglobin concentration was expressed as g/dl.
Carcass characteristics
Carcass bruises were evaluated visually and classified according to a four-point scale (0 – lack to 3 – high bruising). Afterwards carcasses were hung by the Achilles tendon and chilled for 24 h at 4°C, and then cold carcasses including head and kidneys were weighted. Carcass yield was calculated as CCW×100/SLW, in which CCW and SLW indicate cold carcass weight and slaughter live weight, respectively. Carcass conformation and subcutaneous fat cover were valued according to the Commission Regulation 22/2008 and Colomer-Rocher et al. (Reference Colomer-Rocher, Morand-Fehr and Kirton1987), respectively. The thickness of the subcutaneous fat was measured at 13th rib level with a digital calliper. Kidney knob fat depot (kidney and surrounding fat) was measured with a scale from 0 (no fat) to 5 (kidney completely covered with fat).
Finally, LD muscle (pars thoracii and pars lumborum of both sides of carcasses) was obtained, vacuum packed and refrigerated for further determinations.
Meat quality characteristics
Muscle determinations were carried out up to 8 dpm, with the purpose of assessing meat ageing processes.
The pH of LD muscle was determined by using a hand-held pH-meter equipped with a penetrating glass electrode (Crison 507; Crison Instruments, Barcelona, Spain, 0.01 pH unit accuracy). Values were measured on carcasses at the 9th to 13th rib level at 45 min, 10 and 24 hours postmortem (hpm) and then on excised LD muscle at 3 and 8 dpm.
Meat colour was measured by L*, a* and b* system (CIE, 1986) using a Konica-Minolta CM-700d colorimeter (Konica Minolta Inc., Tokyo, Japan) (space CIELAB, D65, 10°, or % UV, SCI). The lightness (L*), redness (a*) and yellowness (b*) were recorded, and the Hue angle (h°) was calculated as tan−1(b*/a*), whereas the parameter chroma (C*) was calculated as [(a*2+b*2)1/2]. Colour at 24 h was measured on LD (pars thoracii) after 1-h blooming time on the surface of a cut performed about 5 cm of the cranial side of LD muscle. A new cutting surface was assessed in each measurement time (3 and 8 days), about 5 cm caudal to the previous cut measured.
Water holding capacity of LD was expressed as the percentage of expelled juice after compression, according to Grau and Ham (Reference Grau and Hamm1953), at 3 and 8 dpm. Samples of ~5 g of raw meat were minced into small pieces, then covered with two filter papers (Albet 238 paper, Albet LabScience, Dassel, Germany; 12.5 cm diameter) and two thin plates of glass material and pressed with a weight of 2500 g for 5 min. The meat samples were then removed from the filter paper. The water holding capacity was reported as the weight lost during sample pressing and was expressed as a percentage.
Warner–Brätzler (WB) meat texture was performed by using a TA-XT2 texture analyzer (Stable Micro Systems, Surrey, UK) equipped with a WB device, as described in Díaz et al. (Reference Díaz, Vieira, Pérez, Lauzurica, González de Chávarri, Sánchez and De la Fuente2014). For each animal, three samples of 2.5-cm thick×10-cm long were cut in parallel to LD (part lumborum) muscle fibres, and then the meat pieces were heated in a water bath at 75°C for 30 min. Maximum shear force (kg/cm2) was assessed in 1×1 cm cross-section samples withdrawn from heated meat pieces in parallel to the muscle fibres, shearing until the samples broke, at 3 and 8 days after slaughtering.
Statistical analysis
The effect of the categorical variables ‘farm origin’, ‘transport duration’, ‘sampling time’ and ‘ageing time’ and their interactions were determined for each numeric parameter studied by fitting a mixed lineal model for repeated measures analysis (SPSS mixed procedure for repeated measures, SPSS 22; SPSS Inc. 2015). Data for blood parameters were analysed according to a design in which farm origin (two levels – DW and GW), transport duration (two levels – ST and LT) were included as fixed factors and sampling time (two levels – at farm and at exsanguination) as a repeated measure within animals. Similar design was carried out for meat quality characteristics, although considering three levels for sampling time (1, 3 and 8 dpm). Least squares means were tested for differences using LSD procedure. A significance level of 95% was considered to indicate statistical differences (P<0.05).
The lineal relationship between pairs of blood biochemistry variables was carried out by conducting a Pearson’s bivariate correlation analysis module (SPSS 22).
Results
Blood biochemistry
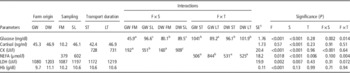
The results obtained for serological biochemistry are summarized in Table 2. The interaction between farm origin and sampling time (F×S) was significant for glucose and CK, showing lower glucose values in GW animals in farm than in the other groups, and lower increase in CK due to transport in GW than in DW animals. The interaction between F and transport duration (T) was also significant for glucose and NEFA. Values of glucose were lower in GW LT animals, whereas NEFA values were significantly higher in these animals. Glucose, cortisol, CK, NEFA and LDH concentrations measured at the slaughterhouse were significantly higher than those measured on-farm. The duration of transport (ST v. LT) increased significantly NEFA in GW animals submitted to longer road transport, but not in DW animals, with the highest values found in animals subjected to longer road transport. However, the rest of blood parameters measured did not differ owing to transport duration.
Effect of farm origin (F), sampling time (S) and transport duration (T) on blood biochemistry parameters of goat kids

CK=creatine kinase; NEFA=non-esterified fatty acids; LDH=lactate dehydrogenase; Hb=haemoglobin.
Data of main effects and interactions are expressed as least squares means. Farm origin: GW and DW stand for good and deficient welfare farms, respectively, classified according to their welfare-friendly practices. Sampling time: FM and SL stand for on-farm and at slaughterhouse, respectively. Transport duration: ST=short road transport (2 h); LT=long road transport (6 h).
a,b,cDifferent superscripts in the same row within each interaction considered indicate significant differences (P<0.05).
1 Pooled standard error.
Positive Pearson’s correlation was observed among CK values and cortisol (r=0.51, P<0.01), glucose (r=0.43, P<0.01), LDH (r=0.38, P<0.01) and NEFA (r=0.28, P<0.01). Positive correlation was also found between cortisol and NEFA (r=0.47, P<0.01) or glucose (r=0.28, P<0.01). Values of LDH were also significantly correlated with glucose measurements (r=0.43, P<0.01).
Blood cells
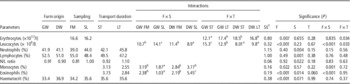
The results shown in Table 3 indicate the interaction between farm origin, sampling time and transport duration for blood cell parameters. Leucocytes number was higher in GW than DW animals, and increased between farm and slaughter sampling in GW animals, but decreased in DW animals. Monocyte and eosinophil counts were significantly lower in GW SL than in the other groups, especially the DW SL animals. Neutrophils and lymphocytes counts as well as neutrophil/lymphocyte (N/L) ratio did not differ according to farm origin, but were influenced by sampling time with higher neutrophil count and N/L ratio, and lower lymphocyte count after transport compared with initial values. The interaction F×T was significant for erythrocytes and leucocytes, also antagonistic tendency was observed between these parameters, with lower values for erythrocytes in GW ST and higher for leucocytes in this group, compared with GW LT, DW ST and DW LT groups. With regard to haematocrit, only the farm origin caused significant differences, with animals from DW showing higher values than GW animals for this parameter.
Effect of farm origin (F), sampling time (S) and transport duration (T) on blood cell parameters of goat kids

Data of main effects and interactions are expressed as least squares means. Farm origin: GW and DW stand for good and deficient welfare farms, respectively, classified according to their welfare-friendly practices. Sampling time: FM and SL stand for on-farm and at slaughterhouse, respectively. Transport duration: ST=short road transport (2 h); LT=long road transport (6 h).
a,b,cDifferent superscripts in the same row within each interaction considered indicate significant differences (P<0.05).
1 Pooled standard error.
Carcass and meat quality parameters
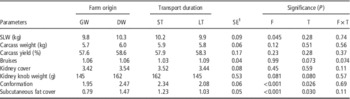
Farm origin slightly influenced SLW with greater weight for DW than GW animals (Table 4). However, when SLW was included as covariate in the statistical model, farm origin had no significant effect on carcass weight or carcass yield. Both farm origin and transport duration contributed to differences in carcass conformation and subcutaneous fat cover, with greater conformation and subcutaneous fat scores in DW than in GW animals, and in ST than LT animals to a lesser extent.
Effect of farm origin (F) and transport duration (T) on some carcass characteristics of goat kids

SLW=slaughter live weight.
Data of main effects and interactions are expressed as least squares means. Farm origin: GW and DW stand for good and deficient welfare farms, respectively, classified according to their welfare-friendly practices. Transport duration: ST=short road transport (2 h); LT=long road transport (6 h).
1 Pooled standard error.
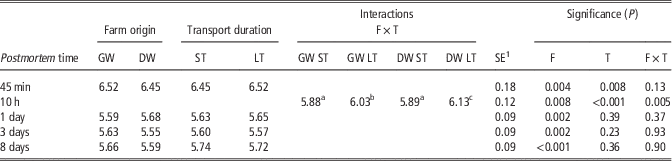
Regarding pH (Table 5), both farm origin and transport duration contributed significantly to differences in this parameter at initial stages of ageing. Values for pH at 45 min were lower in DW than in GW animals, and in ST than LT animals. Carcasses of LT animals showed higher pH10 compared with ST animals, and no differences were observed between GW ST and DW ST animals, nevertheless, values were significantly higher for DW LT than for GW LT animals. At 1 dpm farm origin significantly influenced pH values, with lower pH in GW than DW animals, whereas no differences were observed in LD pH values due to transport duration. Farm origin also accounted for the differences observed at 3 and 8 dpm, with higher values for GW than DW animals, whereas transport duration had no effect on pH values at these stages.
Effect of farm origin (F) and transport duration (T) on carcass pH of goat kids

Data of main effects and interactions are expressed as least squares means. Farm origin: GW and DW stand for good and deficient welfare farms, respectively, classified according to their welfare-friendly practices. Transport duration: ST=short road transport (2 h); LT=long road transport (6 h).
a,b,cDifferent superscripts in the same row indicate significant differences (P<0.05).
1 Pooled standard error.
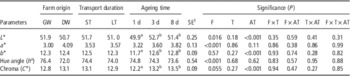
The results of muscle colour at 1, 3 and 8 dpm are shown in Table 6. Farm origin was responsible for differences in L*, redness (a*) and Hue angle (h°). Meat from DW was darker (lower L* value) and redder (higher a*) and showed lower h° angle compared with GW. Transport duration did not influence any colour parameter. Overall, ageing caused significant variation in lightness (L*), yellowness (b*) and chroma (C*) of LD muscle, parameters that increased significantly at 3 and 8 dpm compared with 1 dpm. Interactions between the main factors were not significant for any parameter.
Effect of farm origin (F), transport duration (T) and ageing time (AT) on muscle colour parameters measured at 24 h (1 d), 3 days (3 d) and 8 days (8 d) after slaughtering

Data of main effects and interactions are expressed as least squares means. Farm origin: GW and DW stand for good and deficient welfare farms, respectively, classified according to their welfare-friendly practices. Transport duration: ST=short road transport (2 h); LT=long road transport (6 h).
a,bDifferent letters in the same row indicate significant differences (P<0.05).
1 Pooled standard error.
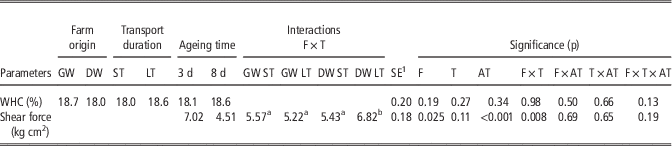
None of the factors studied caused differences in water holding capacity (Table 7). Regarding shear force, overall data indicated that ageing time, farm origin and the interaction F×T were responsible for significant differences in this parameter. Values were higher in DW LT animals than in the three other F×T groups. Ageing time clearly decreased shear force from 3 to 8 dpm.
Effect of farm origin (F), transport duration (T) and ageing time (AT) on muscle water holding capacity (WHC) and shear force measured at 3 days (3 d) and 8 days (8 d) after slaughtering

Data of main effects and interactions are expressed as least squares means. Farm origin: GW and DW stand for good and deficient welfare farms, respectively, classified according to their welfare-friendly practices. Transport duration: ST=short road transport (2 h); LT=long road transport (6 h).
a,bDifferent superscripts in the same row indicate significant differences (P<0.05).
1 Pooled standard error.
Discussion
Blood biochemistry
Among the procedures available to assess stress in farm animals, blood metabolites, hormones and enzymes (such as cortisol, catecholamines and CK) have been widely used as indicators of stress in small ruminants (Kannan et al., Reference Kannan, Terrill, Kouakou, Gazal, Gelaye, Amoah and Samake2000; Rajion et al., Reference Rajion, Saat, Zulkigli and Goh2001; Miranda de la Lama et al., Reference Miranda de la Lama, Villarroel, Liste, Escós and María2010; Ergul- Ekiz and Yalcintan, Reference Ergul-Ekiz and Yalcintan2013; Teke et al., Reference Teke, Ekiz, Akdag, Ugurlu, Ciftci and Senturk2014). Blood levels of glucose, cortisol, CK, NEFA and LDH increased in transported animals in this study, likely associated with increased muscle activity and liver glycogen and body fat mobilization as a consequence of stress, in agreement with previous studies in goats (Knowles et al., Reference Knowles and Warris1995; Kannan et al., Reference Kannan, Terrill, Kouakou, Gazal, Gelaye, Amoah and Samake2000; Alcalde et al., Reference Alcalde, Alvarez, Pérez-Almero, Cruz and Rodero2011). The significant positive Pearson’s correlation observed among glucose, cortisol, CK and NEFA suggests that all of them might be used as indicators of stress response due to transport in suckling goat kids. Most of these parameters were higher in DW animals compared with GW, a fact that might suggest greater susceptibility to stress in animals reared under poor farm management. Only cortisol was not influenced by farm origin, which suggests its role as indicator of acute stress.
Blood CK is an indicator of physical stress, and consequently, it is a valuable parameter in the assessment of muscular damage during transport. In this regard, increased blood CK after 2- and 6-h transport was detected, compared with initial levels on-farm, as might be expected in animals transported under high summer temperatures. Moreover, significantly higher CK after any transport was measured in DW animals compared with GW animals, which is in agreement with Kannan et al. (Reference Kannan, Terrill, Kouakou, Gelaye and Amoah2002) and Zimerman et al. (Reference Zimerman, Grigioni, Taddeo and Domingo2011), who found that pre- and post-transport operations, such as herding, loading and unloading procedures, influenced plasma CK even more than transport itself or food deprivation. The extremely high values of CK in animals from DW after transport also suggest increased sensitivity of these goat kids to stress, which might also be linked to higher reactivity to human and environmental factors involved in animal transport operations. LDH also has been considered as an indicator of muscular fatigue owing to transport in small ruminants (Ergul-Ekiz and Yalcintan, Reference Ergul-Ekiz and Yalcintan2013; Teke et al., Reference Teke, Ekiz, Akdag, Ugurlu, Ciftci and Senturk2014). In our study, both farm management and transport influenced this parameter, whereas no differences owing to transport duration were noticed.
Blood cells
Blood cells are sensitive indicators of the physiological or patho-physiological responses of small ruminants to stress (Yates et al., Reference Yates, Otis, Warner, Yates, Halalsheh, Horvath, Hallford and Ross2010), and leucocytes in particular reveal prolonged effects of stress (Kannan et al., Reference Kannan, Terrill, Kouakou, Gazal, Gelaye, Amoah and Samake2000). In this regard, leucopenia observed in DW animals after transport could be associated with pre-existing poor status that might have conditioned such differences in haematological values. Overall, our results agree with a typical haemogram of adaptive responses in ruminants owing to transport, characterized by neutrophilia and lymphopenia, in accordance to previous studies broaching the effects of transport on goats (Ali et al., Reference Ali, Al-Qarawi and Mousa2006; Minka et al., Reference Minka, Ayo, Sackey and Adelaiye2009; Miranda de la Lama et al., Reference Miranda de la Lama, Villarroel, Liste, Escós and María2010). N/L ratio increased due to transport, although changes could not be attributable to farm origin. Erythrocyte counts were, overall, higher in DW, what might possibly reflect certain negative response associated with bad management related to water supply or heat stress in summer season. Previous studies have pointed out this fact (Jaber et al., Reference Jaber, Chedid and Hamadeh2013).
Carcass and meat characteristics
Besides the effects on blood physiology, stress might well cause alterations on meat quality. In this study, some effects on carcass characteristics (conformation and dorsal fat cover) could be attributed to farm origin. The scarce presence of bruises suggests acceptable handling and transport conditions.
Values for pH at 45 min were significantly lower in DW compared with GW, a fact that again might suggest a higher susceptibility of DW animals to stress. In this regard, it would be possible that a higher perception of stress could induce an acceleration of the metabolism that could cause a faster postmortem pH decrease. Transport duration can alter muscle pH, although in our study the influence of this factor was evident just at initial stages of the postmortem period (first 10 hpm), whereas only farm origin was responsible for pH changes thereafter. Early differences in LD pH due to transport duration could be explained by muscle glycogen depletion due to transport stress, although this effect was expected to continue further throughout meat ageing. On the contrary, differences attributable to transport duration did not persist, and the influence of farm origin became evident after 24 hpm.
High ultimate pH for goat meat is prevalent in the literature (Webb et al., Reference Webb, Casey and Simela2005), and despite the fact that the relationship between meat pH and texture is not linear (Ferguson and Warner, Reference Ferguson and Warner2008), it is generally accepted that meat with high ultimate pH (over 6.0 at 24 hpm) tends to be more tender in this species (Kannan et al., Reference Kannan, Kouakou, Terrill and Gelaye2003). However, it also known that prolonged stress in animals induces dark-cutting meat, that clearly deteriorates meat quality. In this study, pH at 24 hpm (pH24) was not particularly high independently of the factor considered, and it was comparable with values reported previously (Marichal et al., Reference Marichal, Castro, Capote, Zamorano and Argüello2003; Santos et al., Reference Santos, Silva and Azevedo2008). The lack of differences in pH after 24 hpm found here according to transport duration is in agreement with Kannan et al. (Reference Kannan, Kouakou, Terrill and Gelaye2003), who reported limited effects of transport stress (after 2 h) on ultimate pH in goats. These authors reported lower muscle glycogen content in goat kids compared with adult goats, although glycogen mobilization due to transport occurred, even if this was not finally reflected in final pH values. As in our study muscle glycogen was not measured, it was not possible to ascertain whether pre-slaughtering low glycogen content or limited glycogen mobilization were responsible for the lack of effect of transport duration on pH at 24 hpm.
Regarding meat colour parameters, slight modifications found did not reflect the marked physiological changes occurring in live animals owing to transport. In fact, the factors that explained most of the differences found regarding colour parameters were farm origin and postmortem time, instead of transport. Colour parameters in this study are within the range of values reported by Ripoll et al. (Reference Ripoll, Alcalde, Horcada and Panea2011) for suckling goat kids of seven Spanish breeds (Blanca Celtibérica included). On the other hand, noticeable differences in L* and a* among our results and those of Kannan et al. (Reference Kannan, Kouakou, Terrill and Gelaye2003) and Kadim et al. (Reference Kadim, Mahgoub, Al-Kindi, Al-Marzooqi and Al-Saqri2006) might be explained by kid’s age and size. Santos et al. (Reference Santos, Silva and Azevedo2008) found L* values comparable with ours in 10 kg LW Portuguese goat kids, although a* and b* values were considerably different from ours, likely owing to dissimilar feeding management (their animals were raised on pasture). To our knowledge, not many studies have broached the effect of transport on meat colour in goat kids. Kannan et al. (Reference Kannan, Kouakou, Terrill and Gelaye2003) suggested that young animals might be more susceptible to changes leading to lower meat quality due to transport stress, given that transport did not modify colour attributes of LD in large-size goat kids (54 kg LW), whereas in younger animals (22 kg LW) both a* and C* decreased. However, our results agree with those found in sheep (Bray et al., Reference Bray, Graafhuis and Crystall1989) and suckling lambs (De la Fuente et al., Reference De la Fuente, Sánchez, Pérez, Lauzurica, Vieira, González de Chávarri and Díaz2010), pointing to a lack of colour alterations owing to short-term transport stress.
The influence of transport duration or farm origin on water holding capacity was not relevant, in agreement with the results of Kannan et al. (Reference Kannan, Kouakou, Terrill and Gelaye2003). Values measured here were slightly higher than those reported by Marichal et al. (Reference Marichal, Castro, Capote, Zamorano and Argüello2003) for suckling goat kids. Regarding tenderness, WB shear force values were similar to those found in previous studies (Kadim et al., Reference Kadim, Mahgoub, Al-Kindi, Al-Marzooqi and Al-Saqri2006). It is noticeable that long transport of animals with deficient previous on-farm management could alter meat tenderness, this suggesting a synergic effect of both factors. Disparate results have been reported in previous studies. Kannan et al. (Reference Kannan, Kouakou, Terrill and Gelaye2003) did not find differences in shear force due to transport, whereas Kadim et al. (Reference Kadim, Mahgoub, Al-Kindi, Al-Marzooqi and Al-Saqri2006) reported tougher meat in transported goat kids. According to Webb et al. (Reference Webb, Casey and Simela2005), lamb meat with WB shear force values over 5.5 kg/cm2 might be considered as objectionably tough; in this regard, our results indicate that meat was excessively tough at 3 dpm, although values at 8 dpm were acceptable. Consequently, ageing time seems to be the most decisive factor in goat kid meat tenderness. According to our results, ageing periods beyond 3 days would be recommendable in this breed in order to obtain tender meat. However, no standard practice is well established for carcasses of this breed, and frequently they are commercialized before ageing is fully completed.
Roughly, our study agree with Zimerman et al. (Reference Zimerman, Grigioni, Taddeo and Domingo2011), who reported little differences in meat quality parameters of goat kids (6 months old, 24 kg BW) subjected to diverse stress sources of different intensity and duration. In any case, it seems that goat kids from DW responded worst to stressors associated with pre-slaughter handling than those animals coming from more favourable farming systems, probably due to the effect of chronic stressors on-farm that jeopardize the capacity of young animals to deal with acute stress during pre-slaughter handling and transport.
Overall, the results suggest that, despite noticeable influence of transport on blood parameters indicating stress in live animals, this status did not alter decisively meat quality parameters of goat suckling goat kids, besides slight modifications affecting muscle colour and tenderness. The results also point out that postmortem processes throughout ageing period were more influential than antemortem management practices in terms of meat quality. Consequently, it is doubtful that meat quality parameters in very young goat kids are valid indicators of animal welfare, compared with non-meat indicators (namely blood parameters), in opposition to what is generally accepted in adult animals. Nevertheless, from an ethical point of view, on-farm management and transport should be performed under animal welfare standards such that the physiology of goat kids is altered to the lesser extent, regardless of the consequences on meat quality.
Acknowledgements
This work was part of the research project RTA2007-00-011-00-00-INIA, Spanish Government, co-financed with FEDER funds.
Supplementary material
To view supplementary material for this article, please visit https:/doi.org/10.1017/S1751731116002858