Introduction
Cook et al. (Reference Cook, Fox, Vaughan and Ferrigno2005) state that 87% of 244 marine glacier fronts along the Antarctic Peninsula have retreated between 1940 and 2001. A study from King George Island (Simões et al. Reference Simões, Bremer, Aquino and Ferron1999) also reported glacier termini retreat of hundreds of metres to one kilometre during the second half of the 20th century. While direct observations revealed glacial retreat covering the second half of the previous century, the deglaciation history of King George Island has been investigated by several recent studies based on marine sediment records and seismic analyses (e.g. Milliken et al. Reference Milliken, Anderson, Wellner, Bohaty and Manley2009, Simms et al. Reference Simms, Milliken, Anderson and Wellner2011). Multibeam datasets have been used to investigate palaeo-ice streams and associated dynamics around the northern Antarctic Peninsula (Lavoie et al. Reference Lavoie, Domack, Pettit, Scambos, Larter, Schenke, Yoo, Gutt, Wellner, Canals, Anderson and Amblas2015).
King George Island with its several scientific stations stands representative for similar coastal systems. Ease of access, long time series and high research activity make this region a valuable study site. In this study, a high-resolution multibeam bathymetric map, sub-bottom profiles and one sediment core were used to reconstruct glacial dynamics in Potter Cove. The formation of submarine landforms and deposition trends are discussed in the context of the late Holocene deglaciation history. Furthermore, the position of the Fourcade Glacier during the Little Ice Age (LIA) is broadly defined.
Study area
Regional setting
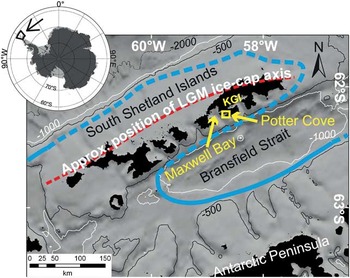
The South Shetland Islands are a 550 km long mostly ice-capped archipelago that is separated from the Antarctic Peninsula by the Bransfield Strait (Fig. 1). King George Island (62°23'S, 58°23'W) is the largest of the South Shetland Islands. Potter Cove is a small tributary inlet to Maxwell Bay, which is a large fjord system located between King George Island and Nelson Island. Maxwell Bay is c. 17 km long and up to 12 km wide with a maximum water depth of 550 m. It opens towards Bransfield Strait in the south-east, where water depths increase to over 1000 m within 10 km of the coast. Potter Cove is c. 4 km long and c. 2.5 km wide (Fig. 2).
Location of the study area. KGI =King George Island. Bathymetry: International Bathymetric Chart of the Southern Ocean (Arndt et al. Reference Arndt, Schenke, Jakobsson, Nitsche, Buys, Goleby, Rebesco, Bohoyo, Hong, Black, Greku, Udintsev, Barrios, Reynoso-Peralta, Taisei and Wigley2013), blue line: reconstructed ice grounding line during the Last Glacial Maximum (LGM), dashed blue line: inferred LGM grounding line modified after John & Sugden (Reference John and Sugden1971) and Davies et al. (Reference Davies, Hambrey, Smellie, Carrivick and Glasser2012).

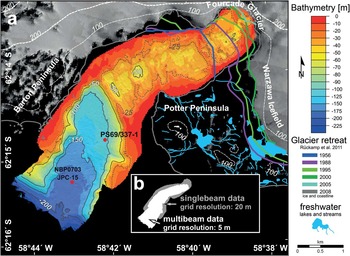
Bathymetry map of Potter Cove including an overview of the bathymetric grid showing where single or multibeam data was used. Glacial retreat fronts and coastline from Rückamp et al. (Reference Rückamp, Braun, Suckro and Blindow2011). The Landsat Image Mosaic of Antarctica (LIMA) and topographical elevation contours at 100 and 200 m are downloaded from the Antarctic Digital Database. Sediment core positions and contour lines at -25, -50, -100, -150 and -200 m are indicated. Lakes and temporary creeks were digitized from the geological map of Potter Peninsula (Kraus & Del Valle Reference Kraus and del Valle2008).

The ice cap of King George Island, which is mostly ocean terminating, is c. 100 km long and 25 km wide with a maximum elevation of c. 700 m a.s.l. (Osmanoğlu et al. Reference Osmanoğlu, Braun, Hock and Navarro2013). The Fourcade Glacier that descends from the Warzawa Ice Field drains from the north-east into the head of Potter Cove. The northern coast in the inner cove is rimmed by ice cliffs. The southern coast is occupied by a prograding strand plain with gravel beach ridges developed on top (Lindhorst & Schutter Reference Lindhorst and Schutter2014) that are occasionally intersected by meltwater streams that drain the Warzawa Ice Field and its proglacial lakes. Surface ice flow velocities reach up to c. 25 cm per day at the glacier terminus (Moll & Braun Reference Moll and Braun2006).
Deglaciation history
During the Pleistocene, the Antarctic Peninsula region was characterized by extending ice advances during glacial episodes. The Last Glacial Maximum took place from 25–20 cal kyr bp, when the Antarctic Peninsula was covered by an ice sheet that extended towards the shelf edge (Ó Cofaigh et al. Reference Ó Cofaigh, Davies, Livingstone, Smith, Johnson, Hocking, Hodgson, Anderson, Bentley, Canals, Domack, Dowdeswell, Evans, Glasser, Hillenbrand, Larter, Roberts and Simms2014). North-west of the ice sheet, a smaller ice cap covered the South Shetland Islands according to John & Sugden (Reference John and Sugden1971), a hypothesis that has recently been confirmed by Fretwell et al. (Reference Fretwell, Hodgson, Watcham, Bentley and Roberts2010). Initial deglaciation of Maxwell Bay associated with decoupling of the ice sheet from the sea floor occurred c. 14 cal kyr bp (Simms et al. Reference Simms, Milliken, Anderson and Wellner2011).
The timing for the mid-Holocene Climatic Optimum varies along the western Antarctic Peninsula. Heroy et al. (Reference Heroy, Sjunneskog and Anderson2008) identify this period in Bransfield Strait between 6.8–5.9 cal kyr bp, whereas a study from the Antarctic Peninsula region reveals a slightly different time span from 4.5–2.8 cal kyr bp (Bentley et al. Reference Bentley, Hodgson, Smith, Ó Cofaigh, Domack, Larter, Roberts, Brachfeld, Leventer, Hjort, Hillenbrand and Evans2009). However, Milliken et al. (Reference Milliken, Anderson, Wellner, Bohaty and Manley2009) report decreasing sea surface temperatures and an increasing sea ice cover in Maxwell Bay from 5.9 cal kyr bp until the neoglacial period that began at 2.6 cal kyr bp. This period ended c. 1.7 cal kyr bp according to Simms et al. Reference Simms, Milliken, Anderson and Wellner2011. They further state that the small coves, including Potter Cove, were still or again occupied by ice prior to 1.7 cal kyr bp. Barnard et al. (Reference Barnard, Wellner and Anderson2014) also report neoglacial conditions between 2.6 cal kyr bp and 1.6 cal kyr bp in Bransfield Strait. Therefore, it is assumed the latest retreat from the mouth of Potter Cove took place at the end of the neoglacial period.
Little is known about subsequent climate fluctuations after c. 1.6 cal kyr bp. Indications of minor cooling events have been reported by Milliken et al. (Reference Milliken, Anderson, Wellner, Bohaty and Manley2009). The most recent cooling period was the LIA, which has been proposed by Bertler et al. (Reference Bertler, Mayewski and Carter2011) for the whole of Antarctica. Understanding glacial retreat dynamics before and after the LIA might provide significant insights into current trends. Evidence for the LIA (500–100 cal yr bp/1450–1850 ad; Stocker et al. Reference Stocker, Qin, Plattner, Tignor, Allen, Boschung, Nauels, Xia, Bex and Midgley2013) is mainly described from the Northern Hemisphere, but is also provided by several studies from the South Shetland Islands and surrounding regions. Yoo et al. (Reference Yoo, Yoon, Kim and Khim2009) report an increase in sea ice extent during the LIA (330 cal yr bp) along the continental shelf north of the South Shetland Islands. A study from Hass et al. (Reference Hass, Kuhn, Monien, Brumsack and Forwick2010) places the LIA with winter-dominated conditions between 550 and 50 cal yr bp in Maxwell Bay. A novel approach using optically stimulated luminescence was used by Simms et al. (Reference Simms, Ivins, DeWitt, Kouremenos and Simkins2012), where they report a neoglacial advance on King George Island between 450–250 cal yr bp (1500–1700 ad).
Material and methods
Swath bathymetry: collection and processing
Swath bathymetry of the sea floor in Potter Cove was collected between January and February 2012 by the United Kingdom Hydrographic Office (United Kingdom Hydrographic Office data © Crown copyright and database right), using a Kongsberg Maritime EM 3002 multibeam echosounder. This system uses frequencies in the 300 kHz band and has an electronic pitch compensation system as well as roll stabilized beams. The total survey area sums up to c. 7 km2. Data were processed using Fledermaus 7.3 (QPS) to remove erroneous depth values and subsequently gridded to a horizontal resolution of 5 m. Visualization was performed using ArcGIS 10.1 (ESRI). Multibeam data was further complemented in the shallow areas by a single-beam dataset provided by Gabriela Tosonotto from the IAA (Instituto Antártico Argentino, Buenos Aires, Argentina) published in Wölfl et al. (Reference Wölfl, Lim, Hass, Lindhorst, Tosonotto, Lettmann, Kuhn, Wolff and Abele2014) (Fig. 2).
Sub-bottom profiling
Sub-bottom data were obtained over two days during the IMCOAST Project field campaign in December 2010. The parametric sub-bottom profiler sediment echosounder (SES) light (Innomar) was operated from a zodiac. The transducer was mounted on a specially designed float, which was towed several metres behind the boat and at least one metre beside the track of the air bubbles produced by the engine of the zodiac. The profiles were recorded during a calm sea state. A sound velocity of 1500 m s-1 was used to convert the two-way travel time into water depth. A GPS antenna was deployed on top of the float above the transducer. During the recording, the frequencies were switched between 4 kHz and 15 kHz depending on the need for deeper penetration or higher resolution. The processing was carried out using ISE software (Innomar). Acoustic facies types were visually determined and presented in the sub-bottom classification map. The frequency variation is assumed to have a negligible effect on the categorization used in this study. Additionally, parasound profiles recorded with 4 kHz during the Polarstern cruise ANT-XXIII/4 from the mouth of Potter Cove were incorporated into the map.
Sediment core
In 2006, during the Polarstern cruise ANT-XXIII/4, sediment core PS69/337-1 was obtained with a 10 m gravity corer at 62°14'46.32''S, 58°42'08.28''W at 115 m water depth. The core recovery yielded 1.26 m of sediment. Photographs and radiographs are available on the Pangaea database (http://dx.doi.org/10.1594/PANGAEA.823407).
Grain size distributions (1 cm steps) were determined with a Cilas 1180 L laser particle sizer. Prior to the granulometric measurements, the samples were treated with acetic acid (30%) and hydrogen peroxide (10%) to remove carbonate and organic matter. The samples were left on an orbital shaker for 12 hours with the addition of sodium polyphosphate to prevent aggregation of clay. Grain size statistics were calculated using GRADISTAT (Blott & Pye Reference Blott and Pye2001).
A CNS elemental analyzer Vario EL III was used to measure the percent weight (%wt) of total carbon (TC) and an ELTRA CS200 for the total organic carbon (TOC). The carbonate (CaCO3) content was calculated using the inorganic carbon multiplied with a factor assuming that all CaCO3 consists of calcite:
 $${\rm CaCO}_{{\rm 3}} \left( {{\rm \,\%\,wt}} \right)\,{\rm =}\,\left( {{\rm TC \,\,{\hbox -}\,\, TOC}} \right)\,{\rm x\, 8}{\rm .333}{\rm .}$$
Mixed benthic and planktonic foraminiferas (1.2 mg) were extracted from the sediment in 1.22–1.23 m core depth and AMS 14C dated at the Leibniz Laboratory for Radiometric Dating and Isotope Research, University of Kiel. The result was calibrated using Calib 7.1 and the ‘marine13’ curve (Reimer et al. Reference Reimer, Bard and Bayliss2013). A total reservoir effect of 1300 years is suggested by Berkman & Forman (Reference Berkman and Forman1996) but deviating corrections exist for dating marine carbonate shells (Davies et al. Reference Davies, Hambrey, Smellie, Carrivick and Glasser2012). We choose a total of 1100 years according to recent studies from marine sediment cores from Maxwell Bay (Milliken et al. Reference Milliken, Anderson, Wellner, Bohaty and Manley2009, Simms et al. Reference Simms, Milliken, Anderson and Wellner2011, Majewski et al. Reference Majewski, Wellner, Szczuciński and Anderson2012) and added an uncertainty of 100 years due to the large range of reported marine reservoir corrections from the area. Therefore, a local reservoir effect (δR) of 700±100 years was applied to the 400 years implemented in Calib 7.1. The 2-sigma range is 499–66 cal yr bp/1451–1884 ad (Table I). The median probability is 315 cal yr bp.
Sample for AMS 14C dating; calibrated with Calib 7.1. and dataset ‘marine13’, reservoir corrected with δR=700±100.

Results
Morphology of Potter Cove
The inner part of Potter Cove is a submarine hanging valley, where water depths are mostly <50 m. This valley enters the main trough of Maxwell Bay via a steep slope in the outer part of the cove (Fig. 2). The slope starts with a rather steep gradient of c. 17° and flattens out towards the sea floor of Maxwell Bay. The flanks of the slope are slightly steeper in the west of the cove than in the east. Water depths in the outer cove are generally >100 m.
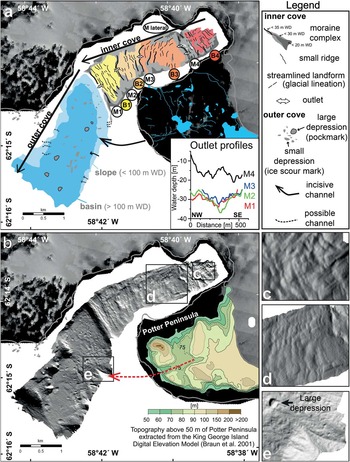
Ridges of different sizes and shapes, hereafter referred to as moraine complexes (M1–4), occur in the inner part of the cove (Fig. 3a & b). The moraine complexes divide the inner cove into four different basins (B1-4). The outermost moraine complex (M1) is the submarine sill that separates the inner and the outer part of the cove. It has an approximate width of 80 m and is characterized by a very straight shape compared to the other complexes that are sinuous. Two amalgamated moraine complexes in the central inner cove (M2, M3) exhibit a highly fringed morphology close to the coast of Potter Peninsula. M3 is further comprised of a number of unequally spaced large ridges that are mainly located along the southern side of the cove. The youngest, most ice proximal moraine complex (M4) is relatively broad (c. 200–300 m) and irregular in its shape. The glacier front was located proximal to M4 in 1956 (Fig. 2). Towards the north, another moraine complex is laterally attached (M lateral) and runs parallel to the cove axis in an east–west direction. The central parts of the moraine complexes reveal outlets that are V-shaped, but exhibit different incision depths as illustrated in the profiles (Fig. 3a). The outlets of the innermost moraine complex M4 are less incised and show a more jagged morphology when compared to the other complexes.
Morphology sketch of the main features of Potter Cove, B1–4=Basins, M1–4=Moraine complexes, and cross profiles along each moraine complex showing the outlet incisions. b. Hillshade image of the multibeam bathymetry and Potter Peninsula topography. c., d. & e. Enlarged sections of hillshade image with different illuminations. WD=water depth.

Within all four basins of the inner cove there are small ridges that extend transverse to the cove axis except for the eastern part of B3 (Fig. 3c & d). These small ridges are much smaller in their extent than the moraine complexes. They are 1–3 m high, gently curved and reveal an unequal spacing between c. 50 and c. 180 m. The most irregular sea floor topography is found in B4 (Fig. 3c). In this basin, streamlined landforms occur that have an almost parallel orientation to the cove axis and are c. 50–150 m long. It appears that these landforms are overprinted by small ridges.
The surface of the slope in the outer cove is rough and characterized by depressions (Fig. 3a & b). Small-scale sinuous depressions occur mainly on the upper slope, whereas large circular depressions only occur in water depths between 100 and 200 m. The large depressions reveal a raised rim with a mean diameter of c. 60 m (diameter range: 40–80 m) and a mean depth of c. 6 m (depth range: 2–10 m) (Fig. 3e). In the south-east of the study area, an incised channel cuts in a NW–SE direction (Fig. 3a & e). The observed part of the channel is <400 m long, 20 m wide and 10 m deep. The base of the channel dips with a gradient of c. 7° towards the north-west. The topography of Potter Peninsula (Fig. 3b) reveals valley structures close to a 90 m high plateau where the largest proglacial lake is situated and continues towards the incised channel. Additional small-scale channel structures are found.
Sub-bottom characteristics
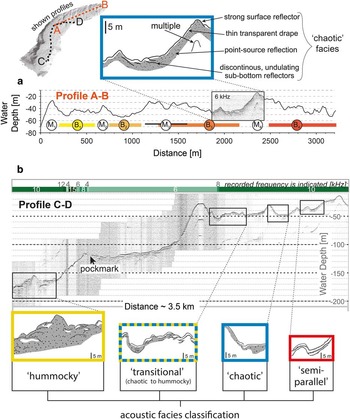
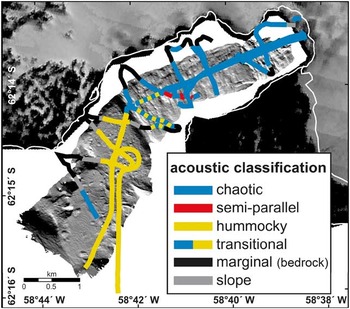
The cross section A-B along the inner cove’s axis reveals rather steep seaward dipping sides of the moraine complexes, whereas the terrain declines in a much smoother angle on the glacier-facing side (Fig. 4a). One short SES profile is included that stands exemplary for the sub-bottom of the entire profile. The acoustic penetration is rather low (<10 m) and characterized by a chaotic sub-bottom with abundant point-source (hyperbolic) reflections that fade out towards greater depth. Occasionally, a thin acoustically transparent layer (<3 m thick) drapes the chaotic structure. A strong surface reflection is typically observed. Discontinuous, undulating subsurface reflectors occur sporadically. Together, these characteristics form the ‘chaotic’ facies. In the outer cove, the SES profile C-D shows deeper sound penetration and strong, undulating reflectors at several metres of sediment depth (Fig. 4b). Hence, the sub-bottom is classified as ‘hummocky’. The acoustic characteristics in the outermost basin of the inner cove could neither be assigned to the ‘chaotic’ nor the ‘hummocky’ facies, but represent a transition of both. The ‘transitional’ facies is characterized by rather poor sound penetration, but progressively more semi-continuous subsurface reflections. Further, almost parallel subsurface reflections were detected that are classified as the ‘semi-parallel’ facies. In c. 120 m water depth, the SES crossed one of the large depressions with almost no recorded reflections.
Cross section along the inner cove axis with an example from sub-bottom profiling. Moraine complexes (M1–4) and basins (B1–4) are shown. Vertical exaggeration: c. 6.6. b. Sediment echosounder (SES) profile, frequency variations are indicated in green. The sketches of the main acoustic characteristics show the acoustic classification. Vertical exaggeration: c. 6.6.

The spatial distribution of the acoustic characteristics illustrates the dominance of the ‘chaotic’ facies in the inner cove (Fig. 5). The ‘semi-parallel’ facies was detected in a small area north-west of the coast of Potter Peninsula. A mostly ‘hummocky’ sub-bottom was found in the outer cove. The boundary between none to abundant semi-continuous, strong subsurface reflections and low to higher sound penetration is rather smooth; therefore, the outermost basin of the inner cove indicates a ‘transitional’ sub-bottom between the ‘chaotic’ and the ‘hummocky’ facies. In areas marginal to the coast <25 m, the profiles show a very high sea floor amplitude, but no sound penetration. Often associated with these are profiles recorded across steep slopes, showing diffuse sea floor reflections with very limited acoustic penetration. These two characteristics (‘marginal’ and ‘slope’) are included in the spatial classification map (Fig. 5), but since they reveal no sound penetration, they prevent the interpretation of the sub-bottom.
Sub-bottom classification of Potter Cove, shaded relief image from multibeam data.

Sediment core
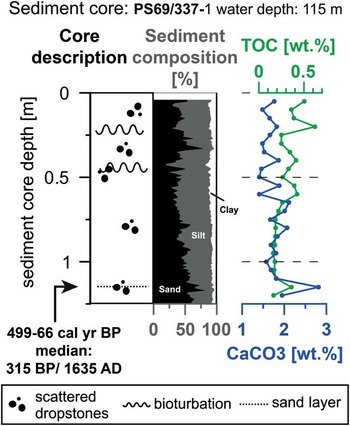
Core PS69/337-1 recovered 1.26 m of sediment. A gravity corer was deployed twice at the PS69/337 station and both times the corer bent at 2 m. The grain size composition shows c. 45% sand, c. 45% silt and c. 10% clay on average (Fig. 6). At 1.2 m core depth, a sand layer is present. A photograph reveals a colour change at this depth (found at http://dx.doi.org/10.1594/PANGAEA.823407). The amount of sand slightly decreases towards the core top until 0.35 m, despite some minor fluctuations. At 0.35 m, the grain size distribution indicates another sand layer, but it could neither be detected visually, nor in the x-ray image. Furthermore, the x-ray images show no evidence for sediment layering. Frequently, scattered dropstones were detected that occur throughout the core, but in small abundances. Information about bioturbation is estimated on the basis of radiographs as well. Distinct bioturbation features are mainly observed in the upper 0.5 m of the core (Fig. 6). The sediment mainly consists of terrigenous grain components, but also of siliceous and carbonate shells, shell fragments and sponge spicules. The average percent weight was c. 0.3 for TOC and c. 1.8 for CaCO3. Towards the core top, TOC shows an increasing trend, whereas CaCO3 shows a decreasing trend. Both records show only minor variations except for maximum concentrations of CaCO3 (2.8%) in the sand layer at 1.2 m, where a suitable amount of mixed and well preserved foraminifera shells could be extracted for radiocarbon dating. However, minor microscopic signs of transport were detected. The result provides a calibrated and reservoir corrected age with a median probability of 315 within the 2-sigma range of 499–66 cal yr bp/1451–1884 ad (Table I).
Sediment core PS69/337-1: lithology, sediment composition, total organic carbon (TOC) and carbonate (CaCO3) content.

Discussion
Glacial morphology
The outermost moraine complex (M1) that separates inner and outer Potter Cove is transverse to the direction of former ice flow and represents a terminal moraine that marks the last maximum position of grounded ice in the inner cove (Fig. 3a). During deglaciation when Maxwell Bay was already free of ice, the vertical drop in elevation of c. 50 m between the inner and outer cove restricted the Fourcade Glacier to the inner cove. The widening and deepening of the cove might have prevented further advance and expansion of the glacier. Establishment of the grounding line associated with accumulation of glacial debris at this position shaped this distinct moraine. Generally, the other moraine complexes in the inner cove are interpreted to be either smaller terminal moraines that developed during glacial readvances or recessional moraine ridges resulting from glacial stillstands during deglaciation (Ottesen & Dowdeswell Reference Ottesen and Dowdeswell2006). The prominent youngest moraine complex (M4) at the head of the cove probably originated from a distinct stillstand of the glacier front. This might be attributed to a change in climatic conditions, but also shallowing bathymetry and narrowing of the cove at this location could have stabilized the retreating Fourcade Glacier. The longitudinal part of this moraine complex (M lateral) was most probably formed parallel to the flowing ice. This feature is interpreted as a lateral moraine that rimmed the Fourcade Glacier.
Blindow et al. (Reference Blindow, Suckro, Rückamp, Braun, Schindler, Breuer, Saurer, Simões and Lange2010) concluded that the ice cap of King George Island is temperate at lower elevations, since percolation of meltwater and a water table were recognized in ground-penetrating radar profiles on the ice cap. According to this, the moraine outlets are most probably the result of subglacial meltwater drainage. The V-shaped character of the incision might furthermore be an indication of high-energy meltwater flow (Dowdeswell & Fugelli Reference Dowdeswell and Fugelli2012).
The formation of the small ridges in the inner cove cannot be explained based on the available data. It can be assumed that they represent minor stillstands or readvances of the Fourcade Glacier grounding line. Their almost parallel orientation to each other might indicate a formation during winter readvances of the ice as in the case of annual push moraines (Ottesen & Dowdeswell Reference Ottesen and Dowdeswell2006). A reason for the absence of small ridges west of M4 could be sediment draping the morphologic structures beneath, either derived from high sediment discharge at the glacier front or enhanced fluvial sediment input from the meltwater streams nearby.
The streamlined landforms are interpreted as glacial lineations that indicate the direction of former ice flow. They are generated at the ice–sediment or ice–bedrock interface underneath actively flowing ice, when the glacier was grounded in the cove (Ottesen & Dowdeswell Reference Ottesen and Dowdeswell2006). The lineations were formed earlier than the small ridges as indicated by the overprint (Fig. 3c). The rough sea floor in this area might be linked to a thinner sediment drape than in the more distal areas, where sediments have draped the sea floor for a longer period of time and smoothed its morphology.
The small-scale sinuous depressions that occur in the outer cove, mainly on the upper part of the slope (Fig. 3a), are similar to arcuate grooves described by Shipp et al. (Reference Shipp, Anderson and Domack1999) from the West Antarctic Ice Sheet. They do not resemble furrows that result from ice moving along the sea floor, but are rather irregularly distributed curvy depressions, carved by deep keeled grounded icebergs indicating a harder substrate that is less prone to erosion than fine sediments (Pudsey et al. Reference Pudsey, Barker and Larter1994). These features are interpreted as ice scour marks.
The larger, almost circular depressions that occur between 100 and 200 m water depth are interpreted as pockmarks. Dowdeswell & Vásquez (Reference Dowdeswell and Vásquez2013) observed numerous pockmarks at water depths <160 m in southern Chilean fjords. They calculated the crater depth and diameter of over 80 pockmarks with median depths of 3–5 m and median diameters of 40–60 m. The large depressions observed in this study (depth range: 2–10 m, diameter range: 40–80 m) are similar to those reported from Chile. Seepage of gases from the sediments underlying these areas was found to be responsible for the formation of pockmarks. Ottesen et al. (Reference Ottesen, Dowdeswell, Benn, Kristensen, Christiansen, Christensen, Hansen, Lebesbye, Forwick and Vorren2008) instead describe them as dewatering structures that reflect sediment displacement by upwelling pore water due to loading of water-saturated sediments by debris flows. For the study area, pore water escape is also possible for the formation of pockmarks. The steep slope in the outer cove, as well as the hummocky acoustic facies type at its apron (Fig. 6), indicate the occurrence of sediment gravity flows in this area. Due to the load of the translocated material on the marine water-saturated sediments, pore water might have escaped from the sediments underneath and formed pockmarks. According to current knowledge, there is no convincing evidence that gas venting is related to the formation of pockmarks in the study area, even though the absence of bottom and sub-bottom reflections below one pockmark could indicate the presence of gas. Römer et al. (Reference Römer, Torres, Kasten, Kuhn, Graham, Mau, Little, Linsee, Papea, Geprägsa, Fischera, Winterstellera, Marcona, Rethemeyerg and Bohrmanna2014) suggest that methane seepage is far more widespread in polar and sub-polar regions than presumed. They reported microbial methane formation in fjords and troughs surrounding South Georgia, located c. 1500 km north-east of King George Island in the southern Atlantic Ocean. Further investigations are required.
The definition and formation of the incised channel structures in the outer cove is difficult to reconstruct, since the shallow areas of Potter Cove were not surveyed and hence the bathymetric data only reveals small segments of probably much larger features. According to the topography of Potter Peninsula, the largest submarine channel most probably represents an extension of a meltwater stream system that drained the Warzawa Ice Field and its proglacial lakes on Potter Peninsula. The topography on Potter Peninsula reveals an erosional pathway that starts near the largest proglacial lake on the 90 m high plateau and is assumed to end at the submarine channel on the west coast (Fig. 3b). The origin of the channel structures might be ascribed to erosion processes such as gravity flows or sediment laden meltwater discharge as described in Dowdeswell & Vásquez (Reference Dowdeswell and Vásquez2013) from glacier-influenced fjords in Patagonia. It is assumed that the channel structures were initially formed by these processes, either constantly or intermittently.
Sediment deposition
Seismic facies analysis in glacigenic sequences is usually difficult when till is present (Stewart & Stoker Reference Stewart and Stoker1990). Deposits with boulders and pebbles in an unsorted compound of a sandy to clayey matrix scatter the acoustic energy in a chaotic manner. Further, the high acoustic impedance of till deposits typically limits transmission of sound energy. Therefore, the structureless texture of the ‘chaotic’ facies with limited penetration and its point-source reflections is assumed to represent till deposits that have formed underneath or proximal to grounded ice (Fig. 4a). The point-source reflections support the interpretation of the ridges as being moraine deposits and not bedrock. The thin reflection-free layer that is often observed on top and associated with this facies most probably represents a mixed drape (<3 m) of hemipelagic ooze and finer sediment that settled out of sediment laden surface plumes from glacial discharge and meltwater streams draining Potter Peninsula (Wölfl et al. Reference Wölfl, Lim, Hass, Lindhorst, Tosonotto, Lettmann, Kuhn, Wolff and Abele2014). A reason for the rather thin drape is the geologically short period of time since the ice exposed the inner cove. Additionally, the export of suspended sediment via meltwater plumes and resuspension during storms might limit the accumulation.
The sub-bottom profiles in the outer cove reveal an acoustically ‘hummocky’ sub-bottom, indicating material or density changes with depth (Fig. 4b). It is assumed that this facies results from deposition and stacking of sediment gravity flows. The ‘transitional’ facies between ‘chaotic’ and ‘hummocky’ is observed east of M1 (Fig. 5). Here, seismic data show again limited penetration similar to the till deposits, but in contrast to the ‘chaotic’ facies numerous subsurface reflections occur. Here a combination of longer exposure of accommodation space and sediment reworking might indicate a more diversified deposition compared to the other basins in the inner cove. The rare ‘semi-parallel’ facies is only found near the southern coast of the inner cove (Fig. 5). The reason for this phenomenon is most certainly related to sediment input via meltwater streams from the nearby Potter Peninsula. Sediment laden glacifluvial meltwater discharges periodically into this area, which might produce such acoustic layering. The acoustic characteristic close to the coast (‘marginal’) is interpreted as exposed bedrock or rockfall deposits since it reveals no sound penetration and is mainly found in front of ice cliffs at the northern coast in conjunction with the findings from Wölfl et al. (Reference Wölfl, Lim, Hass, Lindhorst, Tosonotto, Lettmann, Kuhn, Wolff and Abele2014).
The low sediment recovery of PS69/337-1 in Potter Cove is the result of bending of the gravity corer at approximately 2 m below the sea floor. It cannot be excluded that the same sediment texture continues underneath the recovered sediment, but it is assumed that the bending of the coring device might point to the presence of coarser or stiffer material below. The texture and composition of the sediment found in PS69/337-1, together with the low TOC and CaCO3 content is assumed to reflect predominately rain out from dispersed meltwater plumes derived from the Fourcade Glacier terminus and associated meltwater streams mixed with biogenic material. The relatively homogeneous grain size distribution throughout the core with rarely intercalated sand layers, indicates stable environmental conditions as well as deposition distal from a glacier grounding line. If the glacier had been grounded at M1 during deposition of the recovered sediment, it would have shoved coarse material from the sill down to the location of PS69/337-1. Since the sediment does not contain high amounts of dropstones and pebbles, the grounding line is expected to have been inside the inner cove for the time span that the core covers.
Calculating the sedimentation rate of PS69/337-1 results in 0.4 cm yr-1 for the median probability of 315 cal yr bp in 1.22 cm core depth (Table I), which very closely reflects the mean sedimentation rate for the last 2000 years of sediment records nearby (Milliken et al. Reference Milliken, Anderson, Wellner, Bohaty and Manley2009, Hass et al. Reference Hass, Kuhn, Monien, Brumsack and Forwick2010, Simms et al. Reference Simms, Milliken, Anderson and Wellner2011). However, a single date obtained from a sand layer with an erosional contact has to be interpreted with caution. Input of older foraminiferas would result in an erroneously older age for the deposited sediment. But since the age is relatively young, this effect is assumed to have minor influence. The median probability of 315 cal yr bp suggests sediment deposition within the LIA. However, the large 2-sigma error range could indicate that the sediment core does not cover the LIA (500–100 cal yr bp/1450–1850 ad).
Majewski et al. (Reference Majewski, Wellner, Szczuciński and Anderson2012) reconstructed late Holocene climate variability using selected proxy data from sediment records recovered in Maxwell Bay. The 3.52 m long sediment core NBP0703-JPC-15 from their study is located <1.2 km from PS69/337-1 further down the cove (Fig. 2). No age model could be established for NBP0703-JPC-15, since the oldest date (obtained from a shell fragment) was found above carbonate that appears to be younger. Similar to the findings from this study, Majewski et al. (Reference Majewski, Wellner, Szczuciński and Anderson2012) suggest redeposition and reworking of sediment in this area. However, the base of this core yields an age of 805 cal yr bp that was derived from foraminifera and yields a similar sedimentation rate of 0.4 cm yr-1. Without considering the problematic age control, one might assume that the NBP0703 JPC-15 sediment core, which was three times longer, might cover a longer time span than PS69/337-1 as no indications for significantly different sedimentation environments between the two coring stations are recognized within the bathymetric data. In summary, even though no reliable age control can be established for the cores, core NBP0703-JPC-15 probably reaches beyond the time of the LIA (500–100 cal yr bp/1450–1850 ad). Core NBP0703-JPC-15 shows neither much variation in grain size nor major shifts in TOC or foraminifera assemblages that also indicates deposition remote from the grounding line. This leads to the speculation that the outermost moraine complex (M1) is not a relict of an LIA advance. Furthermore, subsequent glacial advances were probably restricted to the inner cove.
Glacier dynamics
The sea floor morphology in Potter Cove provides information about the retreat behaviour of the Fourcade Glacier during the late Holocene. The maximum position of the grounded glacier front is preserved by the outer-most moraine complex (M1) that is located between the inner and outer cove. Its formation is assumed to have taken place during the last neoglacial period between 2.6 and 1.6 cal kyr bp (Barnard et al. Reference Barnard, Wellner and Anderson2014). Another advance up to this point during the LIA is not very likely according to the sediment characteristics and unchanged occurrence of ice rafted debris in the sediment core. In addition, no other major cooling period is recognized after 1.6 cal kyr bp.
As the glacier was situated at the location of M1, sediments were deposited in front of the grounding line. Subsequent downslope transport of fine material over time is assumed to be one reason for the formation of pockmarks alongside sediments delivered by the channel structures. Channel formation might have also initiated during this time, even though it cannot be ruled out that these structures are older features.
After the Fourcade Glacier decoupled from M1, several moraine ridges of different size and shape were formed in the inner cove due to glacier flow. In general, the retreat of the Fourcade Glacier is assumed to be associated with enhanced subglacial meltwater discharge that incised outlets into the moraine ridges. Behind the most ice proximal moraine (M4), in the youngest ice-free basin, fast glacial retreat took place within c. 50 years, according to the satellite images from Rückamp et al. (Reference Rückamp, Braun, Suckro and Blindow2011).
Conclusions
Landforms and sub-bottom characteristics found in Potter Cove hold evidence of past processes that help to reconstruct glacial dynamics during the late Holocene. The inner and the outer cove represent two different settings regarding their formation, topography and environmental processes. Glacial deposits are observed rarely in the outer cove, whereas they are quite common in the inner cove, permitting interpretations about the retreat history of the Fourcade Glacier.
Moraine complexes, originating from glacial advances or glacial stillstands divide the inner Potter Cove into four different basins. The outermost moraine complex (M1) that represents the latest preserved maximum position of grounded ice in the cove appears to have preceded the LIA and is tentatively assigned to the last neoglacial period between 2.6 and 1.6 cal kyr bp. Outlets, incised by meltwater flow into all moraine complexes, were most probably formed during or shortly after the deposition of the associated complex. The formation of small moraines remains speculative. Glacial lineations found near the head of the cove were formed parallel to the ice flow underneath the advancing Fourcade Glacier. The sea floor in the inner cove consists of till covered with a thin drape of fine sediments that originate from meltwater input and biogenic production. This layer thickens towards the outer cove, which results from the longer exposure of accommodation space down fjord. The sea floor of the outer cove with its steep slopes is characterized by sediment gravity flow deposits. Furthermore, an area is identified along the southern coast, reflecting an enhanced and probably also periodic sediment input from the adjacent meltwater streams on Potter Peninsula. Channel structures in the outer cove represent the submarine extension of the observed braided drainage system on Potter Peninsula. Irregularly distributed ice scour marks are found on the upper slope that originate from grounded icebergs that enter the outer cove from Maxwell Bay. Further down fjord, pockmarks were formed by escaping pore water due to a higher sediment load through gravity flows.
Acknowledgements
The research was included in the IMCOAST Project (www.imcoast.org) conducted in the framework of the PolarCLIMATE call of the European Research Council within the ERA-Net Europolar. The financial support for this study was received from the German Federal Ministry of Education and Research (grant no. 03F0617A). The project was further supported by the European Commission under the 7th Framework Programme through the Action – IMCONet (FP7 IRSES, action no. 319718). The multibeam data was provided by the United Kingdom Hydrographic Office (United Kingdom Hydrographic Office data © Crown copyright and database right). Special thanks go to the Commanding Officer, Captain Peter Sparkes RN, the Charge Surveyor, Lieutenant Commander Phil Payne RN, the Logistics Officer, Lieutenant Simon Lockley RN, and the Bathymetric Data Manager, Judith Thomas. We also want to thank the shipboard scientific party of ANT-XXIII/4 for obtaining the sediment core and seismic profiles. Special thanks go to the reviewers for providing insightful comments to this paper. Last but not least, we are grateful to the crew of Carlini Station from 2011–12 for logistic and technical support.
Author contribution
A.-C.W. and N.W. interpreted the results of the study, conceived and wrote the manuscript. A.-C.W. and P.F. compiled the bathymetric data grid. G.K. and H.C.H. were part of the shipboard scientific party of ANT-XXIII/4 that recovered the sediment core and recorded the parasound profiles. N.W. and H.C.H. recorded SES profiles and performed grain size analyses on the sediment core. G.K. measured the geochemical proxies of the sediment core. H.C.H., G.K., P.F. and C.B. edited the manuscript.
Supplementary Material
Supplemental data, photographs and radiographs will be found at http://dx.doi.org/10.1594/PANGAEA.823407.