Politicians who hold office enjoy a massive electoral advantage in many developing democracies across the world, such as Argentina and Chile. However, a growing body of evidence has documented an equally sizable electoral disadvantage to officeholders in other developing democracies, such as Brazil and India. Why is incumbency a blessing in some political settings and a curse in others?
Most explanations of incumbency effects—or the difference in electoral success between office-holding politicians and their challengers—in developing countries focus on politicians' malfeasance. On the one hand, incumbents build an advantage because they win elections by targeting public resources to strategic constituencies (Calvo and Murillo Reference Calvo and Murillo2004; Greene Reference Greene2007; Stokes Reference Stokes2005). On the other hand, incumbents acquire a disadvantage because they extract rents while in office, thus leaving voters with no choice but to oust them (Klašnja Reference Klašnja2015, Reference Klašnja2016). However, politically biased spending and corruption predict that incumbents will uniformly suffer from an incumbency advantage or disadvantage. As a result, explanations based on elite malfeasance struggle to account for the observed heterogeneity in incumbency effects.
This article offers an explanation of incumbency effects that integrates two well-known facts about how voters engage in electoral accountability across the world. First, there is robust cross-national evidence of retrospective voting, which suggests that citizens place a strong weight on their evaluations of incumbent performance when casting a ballot (Carlin, Singer, and Zechmeister Reference Carlin, Singer and Zechmeister2015; Duch and Stevenson Reference Duch and Stevenson2008). Secondly, several studies report that voters incorporate exogenous factors beyond the control of incumbents when making these evaluations (Achen and Bartels Reference Achen and Bartels2017; Healy, Malhotra, and Mo Reference Healy, Malhotra and Mo2010; Tertytchnaya et al. Reference Tertytchnaya2018). In groundbreaking work, Campello and Zucco (Reference Campello and Zucco2016, Reference Campello and Zucco2020) find that Latin American presidential elections respond to international commodity prices and interest rates. We argue that when voters select candidates on the basis of incumbent performance and incorporate exogenous factors in their evaluations, the electoral fortunes of incumbents will systematically differ from those of challengers. In particular, these incumbency effects will be heterogeneous: incumbency will be an electoral advantage when shocks improve performance evaluations and a disadvantage when shocks adversely affect evaluations.
We empirically examine our argument by studying how economic shocks influence incumbency effects. We focus on commodity shocks due to the heavy reliance of developing countries on agricultural exports. We study Brazil, one of the world's largest commodity exporters and an appropriate context for two additional reasons.Footnote 1 First, exposure to commodity shocks is uneven across municipalities. Second, since Brazilian mayors lack economic policy levers and fiscal resources to respond to sudden changes in international prices, local commodity shocks are plausibly exogenous to incumbents' actions. If voters select candidates on incumbent performance and incorporate exogenous factors in their evaluations, commodity shocks will generate a systematic electoral differential between incumbents and challengers. In particular, positive commodity price shocks should produce an incumbency advantage, while negative shocks should produce an incumbency disadvantage.
Our research design combines plausibly exogenous measures of commodity shocks and of incumbency effects. We develop a commodity price index measuring international price volatility at the municipal level. Our index considers a commodity portfolio that captures the diversity of Brazil's rural production, thus allowing us to examine the link between commodity prices and elections across the vast Brazilian territory. We measure incumbency effects using a close election regression discontinuity design (RDD). Our empirical strategy departs from prior research on the electoral impact of shocks, which has relied on linear regressions of incumbent vote share or victory on measures of exogenous economic change. Extant approaches can identify the marginal effect of economic shocks on the electoral performance of the incumbent. However, incumbency effects are a different quantity of interest, namely, the difference in electoral success of incumbents and challengers. The RDD delivers this quantity by including information on both challengers and incumbents, and by distinguishing the effect of incumbency from differences in candidate quality.
The first step in our empirical analysis couples the RDD with our commodity price index to estimate how much of the incumbency advantage or disadvantage originates in price shocks. Our results show that exogenous price volatility has a strong impact on the electoral returns to incumbency. We find that while substantial increases in commodity prices remove the baseline incumbency disadvantage of Brazilian mayors, negative commodity shocks increase it. Consistent with our argument that emphasizes voters' economic evaluations, commodity shocks are only electorally consequential in rural municipalities. We show that, in fact, the mayoral incumbency disadvantage documented by previous studies of Brazil is circumscribed to rural municipalities and tightly linked to commodity shocks (see, for example, Klašnja and Titiunik Reference Klašnja and Titiunik2017; Schiumerini Reference Schiumerini2019).
The second empirical step examines our retrospective voting mechanism against several alternatives. Using detailed data on candidate quality and campaign finance disclosures, we find no evidence to suggest that commodity shocks work through strategic candidate entry or exit, quality differentials between incumbents and challengers, differences in financial support, or changes in voter preferences over partisan ideology or candidate type. To examine retrospective voting, we estimate the impact of commodity shocks on economic growth and fiscal policy. These outcomes differ in a crucial way to help us assess how voters attribute incumbent responsibility: while Brazilian mayors lack macroeconomic policy tools to influence local economic growth in the immediate aftermath of a shock, they can potentially use local spending to alleviate downturns. Our analysis shows that commodity shocks have a sizable impact on aggregate economic growth—particularly in rural municipalities—but do not influence fiscal outcomes.
This article makes theoretical and empirical contributions to research on incumbency effects and democratic accountability. While existing research on incumbency effects has studied either incumbency advantage or disadvantage within a single national context (see Klašnja Reference Klašnja2015; Klašnja and Titiunik Reference Klašnja and Titiunik2017; Uppal Reference Uppal2009), we provide a theoretical rationale and supportive evidence suggesting that incumbency effects vary at the subnational level (Schiumerini Reference Schiumerini2019). In addition, rather than linking incumbency effects to elite malfeasance, we emphasize the informational challenges that voters face when selecting candidates.
We also contribute to ongoing debates about voter competence to engage in electoral accountability. An influential literature interprets the effect of shocks on elections as evidence that voters irrationally respond to irrelevant outcomes (See, for example, Achen and Bartels Reference Achen and Bartels2017).Footnote 2 However, as noted by Ashworth, Bueno de Mesquita, and Friedenberg (Reference Ashworth, Bueno de Mesquita and Friedenberg2018), even if an incumbent is not responsible for an exogenous shock, voters may learn about competence by observing how incumbents have prepared for and/or managed that shock. This is especially true in the case of presidents, who may not directly influence the price of international commodities but can certainly mediate the domestic impact of price shocks through their choice of economic model and the implementation of compensatory economic policies. From this perspective, voters would be correct in blaming a president whose policy choices increase vulnerability to international price changes.
Our empirical strategy helps us better examine the nature of voter response to exogenous shocks. First, by scaling down the analysis from presidents to mayors, we focus on an incumbent that has limited policy levers to prevent economic shocks, especially in the short run. Secondly, using RDD to balance the ex ante quality of incumbents and challengers reduces the scope of voters to select better candidates based on information revealed by a shock. Thirdly, by showing that commodity shocks influence municipalities through economic growth rather than fiscal spending, we can assess whether voters are responding to exogenous forces or to incumbents' actions. Taken together, our evidence suggests that voters are rational but prone to misattribution: they respond to an outcome that affects their welfare but which mayors do not influence.
Commodity Shocks and Incumbency Effects in Brazilian Municipalities
We empirically examine how economic shocks influence incumbency effects in Brazilian municipalities. Figure 1 depicts regression discontinuity estimates of incumbency effects for mayoral candidates in elections in which the sitting mayor is not term limited.Footnote 3 The results confirm the baseline incumbency disadvantage of Brazilian mayors documented in previous studies (Klašnja and Titiunik Reference Klašnja and Titiunik2017). Incumbents who are eligible for reelection are 7 percentage point less likely to win the next election than their challengers.Footnote 4 However, upon closer examination, this incumbency disadvantage is a rural phenomenon. Specifically, we classify municipalities into two groups based on the share of the population working in the rural economy: in rural municipalities, this share is above the sample median, while in urban municipalities, it is below the median. Whereas incumbent candidates are 14 percentage points less likely to win an election than challengers in rural municipalities, there is no statistically discernible incumbency effect in urban municipalities.
Incumbency effects in nonterm-limited municipalities.
Notes: Regression discontinuity estimates of incumbency effects include a triangular kernel, year fixed effects, and an optimal bandwidth, and use the rdrobust package. Bars are 95 per cent robust confidence intervals. Rural and urban municipalities lie above or below the overall median of the distribution of rural population across Brazilian municipalities, respectively.

Extant explanations cannot account for the subnational heterogeneity in incumbency effects. Arguments focused on elite incentives for malfeasance caused by term limits do not apply to elections where candidates can run for reelection (Klašnja and Titiunik Reference Klašnja and Titiunik2017). Levels of development are another plausible explanation. As shown in Table S.I.1 in the Online Appendix, rural areas in Brazil—as in most countries—are less developed than urban ones, and this difference could account for the relative electoral success of incumbents and challengers. However, Figure S.I.17 in the Online Appendix shows that the rural incumbency disadvantage and the null urban incumbency effect persist after adjusting for a host of correlates of development and other theoretically relevant confounders, such as wealth, education, candidate quality, or the number of contenders.
We argue that commodity shocks explain the variation in incumbency effects across Brazilian municipalities. While voters attempt to sanction incumbents for economic performance, changes in commodity prices affect their evaluations and condition the electoral fortunes of incumbents vis-à-vis challengers. We expect commodity shocks to have a stronger effect in voters' decisions in rural municipalities, where a higher share of the population has income tied to agricultural prices. To develop this argument, we draw on recent theoretical work on accountability that examines how rational voters can learn from performance in the presence of exogenous shocks. Our argument is also informed by the generally weak effects of elite malfeasance on vote choice in Brazil and other settings (Boas, Hidalgo, and Melo Reference Boas, Hidalgo and Melo2019; Dunning et al. Reference Dunning2019; Pavão Reference Pavão2018).Footnote 5
Voters in Brazil, and across developing countries, focus on incumbent performance when casting a ballot for local offices (Pereira and Melo Reference Pereira and Melo2015). In Brazil, local governments play a key policy-making role. They share the same constitutional status as states and are responsible for delivering fundamental social services, such as health, primary education, and public transportation (Afonso and Araújo Reference Afonso, Araújo, A. and Shah2006; Arretche Reference Arretche2012). Mayors also hold a strong grip over municipal governments, with the local council in charge of oversight. As mayors are allowed one consecutive reelection, voters heavily scrutinize the past performance of first-term incumbents.Footnote 6 This retrospection should allow voters to select competent incumbents by using readily available information on performance, such as the state of the economy (Duch and Stevenson Reference Duch and Stevenson2008).
The competence signal, however, becomes noisy when forces beyond incumbent control contaminate incumbent performance (Campello and Zucco Reference Campello and Zucco2016, Reference Campello and Zucco2020). This is precisely the scenario of Brazilian local elections. While voters care about the local economy, agricultural dependence exposes economic growth to frequent and unpredictable changes in international commodity prices. Commodity shocks should be especially consequential in rural municipalities due to context priming (Larsen et al. Reference Larsen2019). When a disproportionate share of people and industry have their income—directly or indirectly—tied to agriculture, changes in commodity prices will strongly color economic perceptions and acquire high electoral salience.
When voters engage in retrospective voting but include factors beyond incumbent control in their evaluations, preferences for incumbents and challengers will systematically differ and translate into incumbency effects. In the Brazilian municipal context, exogenous changes in commodity prices will similarly influence voter performance evaluations and lead to incumbency effects. In particular, we anticipate subnational variation in incumbency effects: positive commodity shocks should increase the electoral success of mayors vis-à-vis challengers, while negative commodity shocks should reduce it. If our argument is correct, commodity shocks will affect incumbency effects more strongly in rural municipalities because a larger share of the electorate is economically tied to agriculture. This moderating role of rural dependence may help explain why incumbency disadvantage is a rural phenomenon. In particular, we expect the rural incumbency disadvantage to be driven by negative commodity shocks but attenuated or removed by positive ones.
Why do voters rely on incumbent performance under recurring exogenous shocks? In fact, retrospective voting prevails not only in Brazilian mayoral elections (Johannessen Reference Johannessen2020; Pereira and Melo Reference Pereira and Melo2015), but also in many countries and regions exposed to exogenous shocks (Achen and Bartels Reference Achen and Bartels2017; Carlin, Singer, and Zechmeister Reference Carlin, Singer and Zechmeister2015; Healy, Malhotra, and Mo Reference Healy, Malhotra and Mo2010). Our argument carries implications about the mechanisms driving incumbency effects. We posit that voters directly infer incumbent competence from trends in economic growth that are influenced by exogenous commodity shocks and that this occurs due to the limited information available in local settings.
Some scholars argue that this voting behavior is irrational. Since performance carries no information when affected by outcomes that incumbents do not fully control, voters should disregard it (See, for example, Achen and Bartels Reference Achen and Bartels2017). Ebeid and Rodden (Reference Ebeid and Rodden2006) document this form of discounting in US gubernatorial elections, where voters pay less attention to the economy in states that depend on natural resources. However, disregarding performance information is a viable strategy for voters in contexts like US statewide elections, where party platforms and developed media markets can reliably guide their choices.
Brazilian local elections do not offer such an informational menu. In the vast majority of local elections, levels of partisanship are low (Samuels and Zucco Reference Samuels, Zucco and Levitsky2016) and candidates form large and ideologically heterogeneous coalitions (Novaes Reference Novaes2018).Footnote 7 As a result, these races do not revolve around programmatic or national issues, but around the personal attributes of candidates. Given the difficulties that Brazilians face in selecting candidates, retrospective voting takes place despite the presence of external shocks. In fact, comparative studies show that this is a common voter response to weak political parties across the world (Kayser and Wlezien Reference Kayser and Wlezien2011; Lupu Reference Lupu2013), and one that is not mitigated by exogenous shocks (Schiumerini and Steinberg Reference Schiumerini and Steinberg2020; Tertytchnaya et al. Reference Tertytchnaya2018).
Ashworth, Bueno de Mesquita, and Friedenberg (Reference Ashworth, Bueno de Mesquita and Friedenberg2018) theorize an alternative mechanism: voters may indirectly distinguish incumbent quality from exogenous factors by evaluating the actions that the incumbent undertakes in reaction to a shock. This interpretation is compatible with ours in positing rational voters who maximize the information available to select good representatives. In fact, we believe that this is a persuasive interpretation for settings in which voters evaluate powerful policymakers—such as presidents or governors—who can use countercyclical spending to quickly counteract the impact of a shock on the economy.Footnote 8 However, local incumbents often lack comparable policy instruments to signal competence in the aftermath of an economic shock.
Brazilian mayors are a good example of the limitations that local incumbents face. They can only provide limited fiscal incentives or infrastructure investments, but these actions are unlikely to produce an immediate impact on economic activity.Footnote 9 Fiscal institutions also prevent Brazilian mayors from using social spending to compensate for the short-term impact of a commodity shock. As the lion's share of municipal revenues originates in fiscal transfers, mayors cannot collect more resources in the aftermath of a shock. Neither can mayors increase debt to finance spending: the Fiscal Responsibility Law imposes strict limits on fiscal deficits and forbids expansions in public employment during electoral years (Afonso and Araújo Reference Afonso, Araújo, A. and Shah2006; Melo, Pereira, and Figueiredo Reference Melo, Pereira and Figueiredo2009).
Our empirical analysis employs several strategies to try to adjudicate between these competing mechanisms. As we explain later, our research design mitigates the possibility that voters are extracting a competence signal from the shock by: (1) balancing incumbents and challengers on observable ex ante characteristics; (2) analyzing mayors, who have fewer compensatory policy tools at their disposal; and (3) focusing on a short time frame between a commodity shock and an election. We also directly examine the empirical implications of these different voter learning strategies by trying to detect if shocks disturb fiscal variables, influence candidate quality, or have heterogeneous effects across different types of politicians. We now turn to describing our research design and data.
Research Design
Our research design has two components. We first isolate exogenous variation in municipal commodity prices using an original commodity price index. We then embed this index in a RDD to evaluate how changes in commodity prices shape the returns to incumbency. In this section, we describe each component and conduct robustness tests assessing the validity of our research design.
Measuring Commodity Shocks
Brazil is an agricultural heavyweight. It is the world's largest producer and exporter of coffee beans, oranges, and sugar. The country ranks second in the production and export of soybeans and is the third-largest exporter of corn.Footnote 10 Production of agricultural commodities takes place throughout the whole country (with the exception of a large portion of the Amazon region). Although some regions specialize in one or two crops, most municipalities produce a mix of several different commodities.
We leverage this rich and varied commodity production to trace the effects of changes in commodity prices on electoral outcomes. We construct an individual price index for each municipality and each electoral period. Our index considers all crops for which prices are set in international markets and data are collected by the International Monetary Fund (IMF): bananas, cocoa, coffee, corn, oranges, rice, soybeans, sugar, and tobacco. The value of these agricultural products accounts for more than 70 per cent of all Brazilian agricultural output.Footnote 11 For each crop c ∈ {1, n}, our measure of price change is constructed as follows:
 $$\theta _c = \displaystyle{{P_{c, t + 1}-P_{c, t}} \over {P_{c, t}}}.$$
Figure S.I.1 in the Online Appendix shows how crop prices have varied over time and illustrates Equation 1. We choose the year preceding the election, not the entire term of the incumbent, for theoretical and empirical reasons. First, scholars stress that voters rely on short-term cues for retrospection (Achen and Bartels Reference Achen and Bartels2017; Healy and Lenz Reference Healy and Lenz2014; Huber, Hill, and Lenz Reference Huber, Hill and Lenz2012). Second, a shorter time horizon provides less room for incumbents to influence the nature or impact of changes in commodity prices, and thus lends more credibility to the assumption of the exogeneity of price variations.
To create an annual price index for all municipalities, we build weights that take into account how much each crop contributed to municipal agricultural output in the past. Thus, for example, if total output was 800,000 and corn contributed 200,000 and soybeans another 300,000, they will have weights of one quarter and three eighths, respectively. Weights are constructed using output four years prior to treatment. Thus, for each municipality i and electoral period t ∈ {2008, 2012}, we build a vector  ${\vector \rm \omega }$, such that:
 $${\vector {\rm \omega} }_{it} = \left\{{\displaystyle{{v_{1it}} \over {V_i}}, \;\ldots , \;\displaystyle{{v_{nit}} \over {V_i}}} \right\}, \;$$
where v c,it is the value of crop c at time t in municipalityi, and V i is the total agricultural value in the same municipality. If θt = {θ 1, …, θ n}, each municipality in each electoral period will have a price index Π, such that:
 $$ {\it \Pi} _{i, t} = \theta _t \times \omega _{i, t}.$$
Estimating the Impact of Price Shocks on Elections
The second component of our research design is a measure of incumbency effects. While prior research has studied the impact of shocks on incumbent electoral success, we focus on the impact of shocks on the incumbent–challenger difference in electoral success. This focus on incumbency effects requires obtaining credible counterfactuals of the challenger's electoral success.
To obtain an unbiased measure of incumbency effects, we rely on a close election RDD (Lee Reference Lee2008). RDD provides a design-based approach for estimating the causal effect of incumbency on electoral performance (Dunning Reference Dunning2012). It exploits the simple intuition that the outcome of close elections is determined by election-specific factors that are not correlated with candidate characteristics. Suppose that a party p at time t wins an election by a narrow margin in district A and loses by a similarly narrow margin in district B. If the outcome of this election at t is indeed a coin toss, comparing p's electoral performance at t + 1 in districts A and B yields an unbiased estimate of the causal effect of incumbency. We extend this intuition to better identify the effect of commodity shocks on Brazilian mayoral elections. Focusing on close elections in t, we assess how the effect of incumbency varies as a function of commodity price volatility.
Following De Magalhães (Reference De Magalhães2015), we make two adjustments to adapt RDD to the Brazilian mayoral setting. First, given the high level of personalism, our unit of analysis will be candidates rather than parties. In turn, the focus on candidates forces us to exclude municipalities in which incumbents cannot potentially run in t + 1 due to term limits. The second adjustment aims at improving statistical power. The conventional application of the electoral RDD estimates separates incumbency effects for individual parties. However, this procedure is highly inefficient in Brazil's multiparty system, where 34 different parties held mayoral office during 2000–16. To increase statistical power, we build an aggregate estimator that pools candidates from all parties, thus allowing an overall assessment of the nature of incumbency effects in Brazilian mayoral elections.
In this context, our RDD model of heterogeneous incumbency effects takes the following form:
 $$\eqalign{Y_{k, i_{t + 1}} = \alpha + \beta _1Incumbency_{ki_t} + \beta _2\Pi _{ki_{t + 1}} + \beta _3( Incumbency_{ki_t} \times \Pi _{ki_{t + 1}}) + \delta _{ki_t} &\cr \forall \;ki_t\;\;s.t.\;\vert M_{ki_t}\vert < { { \epsilon }}, &} $$
where:  $Y_{i, k_{t + 1}}$ is a measure of electoral performance for candidate k in municipality i in election t + 1;
 $Incumbency_{k, i_t}$ is a binary indicator of victory in election t and captures assignment to the incumbency treatment;
 $\delta _{ki_t}$ is an error term;
 $\vert {M_{ki_t}} \vert $, the forcing variable, is the difference in vote margin between the winner and challenger in election t; and ε is an arbitrarily small vote margin, which we operationalize by considering two bandwidths—a nonparametric optimal bandwidth (Calonico, Cattaneo, and Titiunik Reference Calonico, Cattaneo and Titiunik2014) and an arbitrarily small bandwidth of a 2.5 per cent margin. We weight our estimations using a triangular kernel centered at the cutoff. β 1 identifies the main effect of incumbency. The coefficient of interest is the interaction term β 3, which captures how the incumbency effect varies as a function of commodity shocks. While commodity shocks are realized after the incumbency treatment has been assigned, they cannot plausibly be influenced by incumbency. Our main measure of electoral performance is a binary indicator of candidate reelection,
 $Victory_{ki_{t + 1}}$.
Data and Study Groups
The empirical analyses cover four mayoral electoral cycles during the 2004–16 period. The unit of analysis in our core heterogeneous incumbency effects estimator is the candidate-year. The base sample includes all candidates running in municipalities where incumbents are eligible to run for reelection. We focus on incumbents and challengers whose vote margins fall within the bandwidths that we specify for RDD estimation. This leaves at least two observations per municipality and year: one incumbent and one or more challengers, depending on how many meet the discontinuity bandwidth. Given this definition of the study group, our tests vary in the number of observations due to four reasons. First, we divide municipalities into rural and urban subgroups, as explain further later. Secondly, we follow Calonico, Cattaneo, and Titiunik (Reference Calonico, Cattaneo and Titiunik2014) and select a bandwidth nonparametrically, returning different sample sizes depending on the outcome we analyze. Thirdly, although most analyses use candidates as the unit of analysis, some analyses of mechanisms focus on municipality-level outcomes. Moving from candidates to municipalities more than halves our observations because municipalities have one incumbent and one or more challengers. Finally, missing values in some covariates and outcomes result in minor variations in the number of observations.
Robustness Checks
Our empirical strategy relies on two identification assumptions. The first is that potential outcomes have a smooth distribution around the winning threshold, while the treatment variable—winning the election—changes discontinuously. This assumption implies that other than in their treatment assignment, winners and losers of close elections do not differ systematically on observable characteristics that influence electoral success. Consistent with this assumption, Subsection S.I.3.2 in the Online Appendix presents balance tests conducted across several covariates and subgroups. There is no indication that treatment and control groups are dissimilar. Further, a density test shows that the forcing variable runs smoothly around the winning threshold (see Subsection S.I.3.1 in the Online Appendix).
The second identification assumption is that the municipal commodity price index is exogenous to structural municipal characteristics. We evaluate this assumption through a placebo test motivated by Equation 3. If price indexes are exogenous, future price variation should not influence past incumbency effects. Formally, we implement this placebo test by estimating a local linear regression of the form:
 $$\eqalign{Y_{k, i_{t + 1}} = \alpha + \beta _1Incumbency_{ki_t} + \beta _2{\dot{\Pi }}_{ki_{t + 2}} + \beta _3( Incumbency_{ki_t} \times {\dot{\Pi }}_{ki_{t + 2}}) + \delta _{ki_t} &\cr \forall \;ki_t\;\;s.t.\;\vert M_{ki_t}\vert < { \epsilon }. &} $$
The key difference between Equation 4 and our workhorse Equation 3 is the time subscript attached to  $\dot{\Pi }_{i, t + 2}$. In Equation 4, prices and weights come from four years after the t + 1 election or from the subsequent electoral cycle. For example, if a winning candidate in 2004 runs for reelection in 2008, the prices in
 $\dot{\Pi }_{i, t + 2}$ are taken from 2012. It should be noted that although prices are serially correlated, the variation in prices is not. Future price variation should not be a function of past variation in a price-taker market.
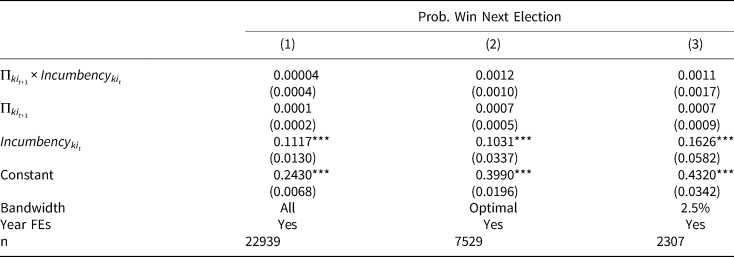
The results from the placebo test are presented in Table 1.Footnote 12 The variable of interest in the placebo test is the interaction between incumbency and price volatility, which captures the impact of commodity shocks on returns to office. The results show that there is no effect of future price change on past electoral outcomes. This evidence is consistent with the assumption that commodity shocks are independent of unobserved municipal determinants of incumbency effects.
Placebo test: Future price volatility and past incumbency effects

*p < 0.1; **p < 0.05; ***p < 0.01
Coefficients of local linear regressions of a binary measure of victory in t + 1 on future commodity price volatility, an incum- bency indicator, and their interaction, as well as vote margin and its interaction with incumbency (not shown). ‘All’ corresponds to the full sample, ‘Optimal’ to the optimal bandwidth calculated via Calonico, Cattaneo and Titiunik (2014), and 2.5 to a 2.5% vote margin. All specifications include year fixed effects and robust standard errors clustered by municipality (in parenthesis).
Do Commodity Shocks Lead to Incumbency Effects?
In this section, we analyze the effect of price shocks on incumbents' electoral fortunes vis-à-vis challengers. We estimate this relationship using an RDD that allows for heterogeneous incumbency effects conditional on price shocks. As described in Equation 3, this model is a local linear regression that includes interactions between incumbency and price shocks, as well as between incumbency and vote margin, and between price shocks and vote margin. We also add year fixed effects to remove year shocks.
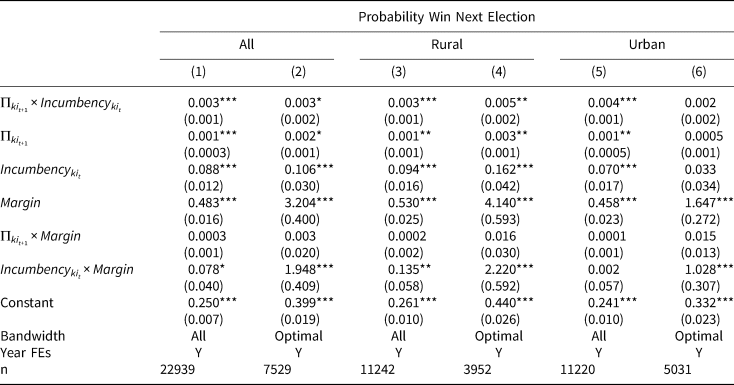
We find that changes in municipal commodity prices have a nontrivial impact on incumbency effects. Table 2 shows that a positive shock of one standard deviation from the median in the municipal price index, or a shock amounting to a 14.8 per cent price change, would yield a 5 percentage-point increase in the incumbency advantage for the mayors in the optimal bandwidth. This variation also means that the unfortunate mayors hit by a negative shock face a high probability of defeat.
Incumbency Effects Conditional on Municipal Price Index

*p < 0.1; **p < 0.05; ***p < 0.01
Coefficients of local linear regressions of a binary measure of victory in t + 1 on commodity price index, an incumbency indicator, and their interaction, as well as vote margin and its interaction with incumbency. ‘All’ corresponds to the full sample, ‘Optimal’ to the optimal bandwidth calculated via Calonico, Cattaneo and Titiunik (2014). All specifications include year fixed effects and -robust standard errors clustered by municipality (in parenthesis).
If our argument is correct and commodity shocks affect local elections via voters' performance evaluations, this effect should be stronger in municipalities where a large share of the population is economically tied to the rural sector. To test this claim, we disaggregate municipalities by exposure to commodity shocks by constructing two groups according to their rural population.Footnote 13 As shown in Figure S.I.3 in the Online Appendix, the Urban group comprises municipalities whose rural population is below the study group median and Rural contains municipalities above the median.
Consistent with our expectations, we find that commodity shocks have a considerably stronger impact on incumbency effects in rural areas than in urban ones. In Table 2, the coefficients for the interaction term between our commodity price index and incumbency show that price changes only influence incumbency effects in rural municipalities. In rural municipalities around the optimal bandwidth, a one standard deviation positive shock in prices (16.19 percentage points) increases the probability of reelection by 8.1 percentage points. In other words, since mayors in the study group are, on average, reelected 34 per cent of the time, that positive shock increases the probability of winning the election by 24 per cent, offsetting most of the disadvantage faced by mayors in rural municipalities.
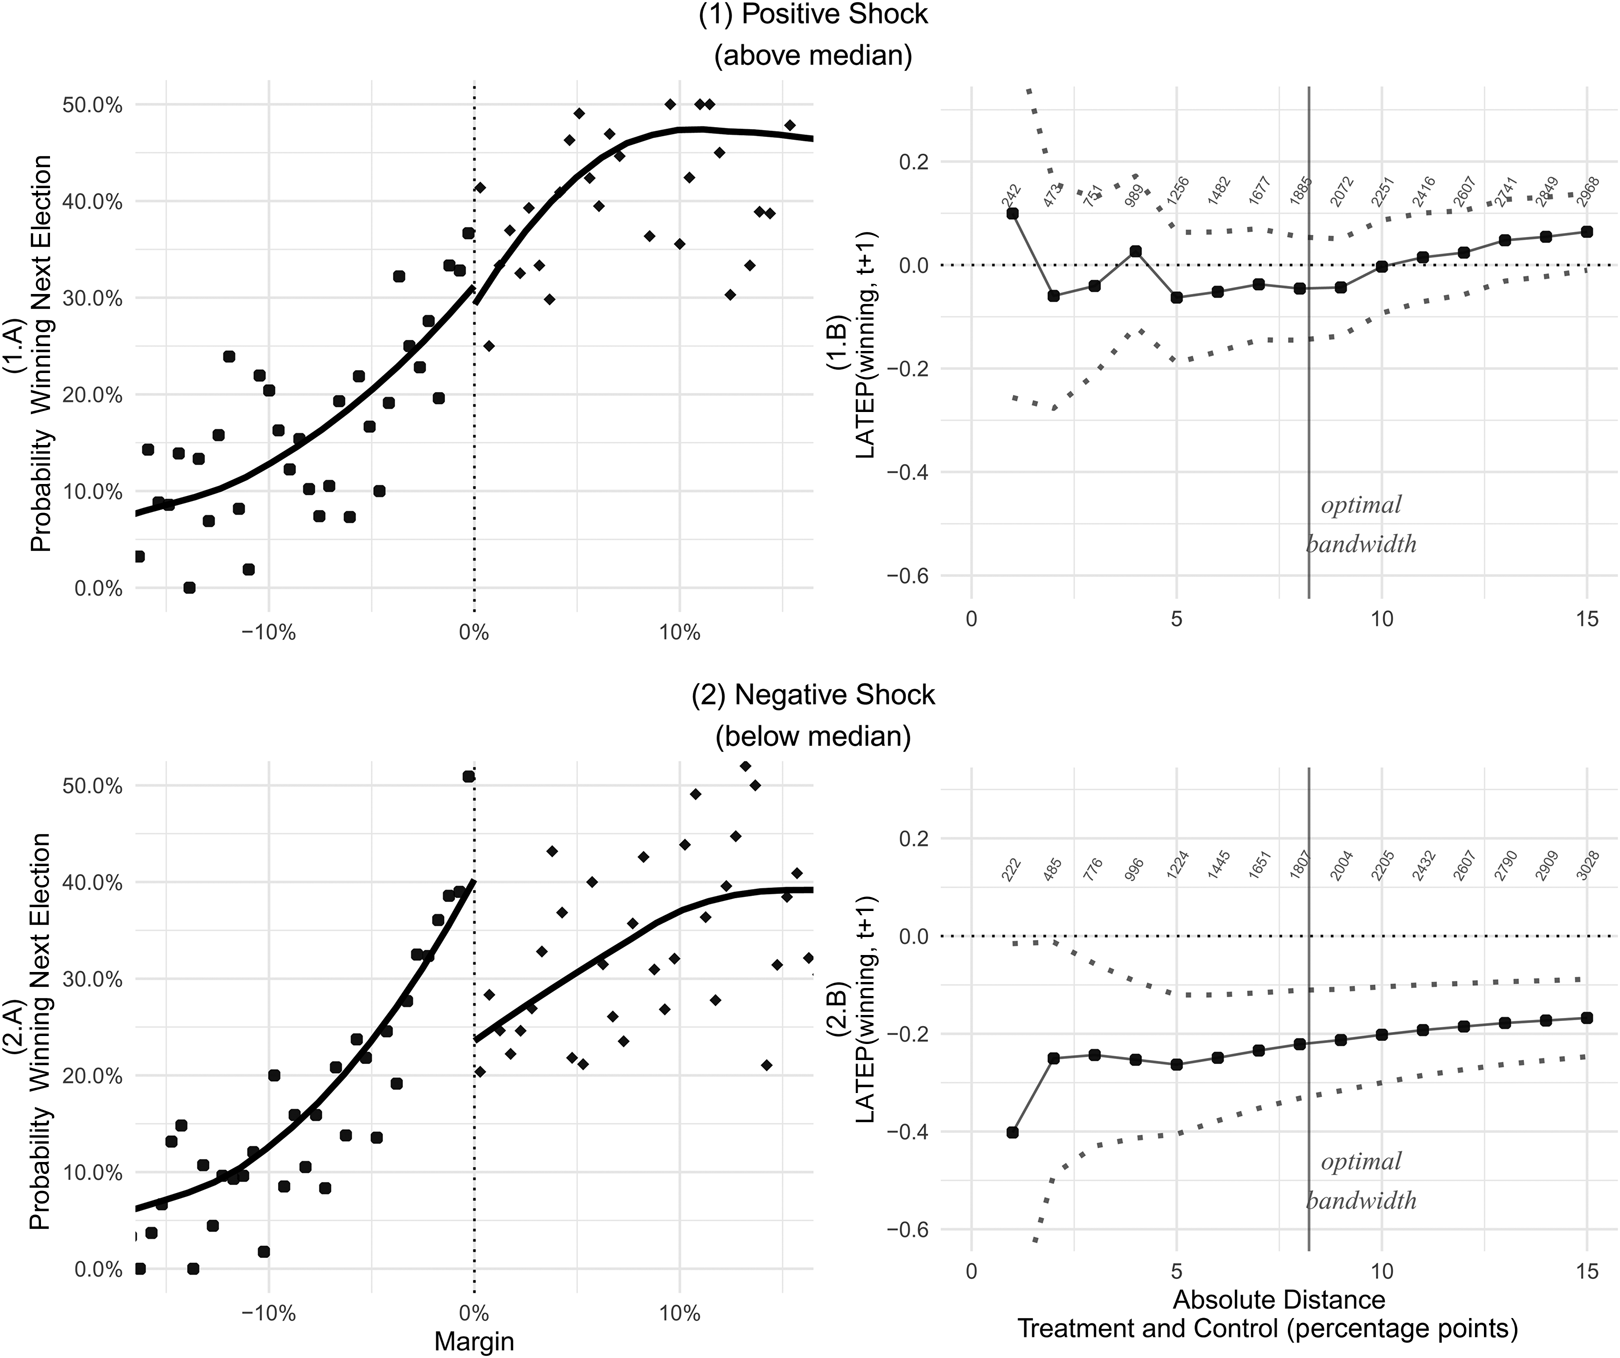
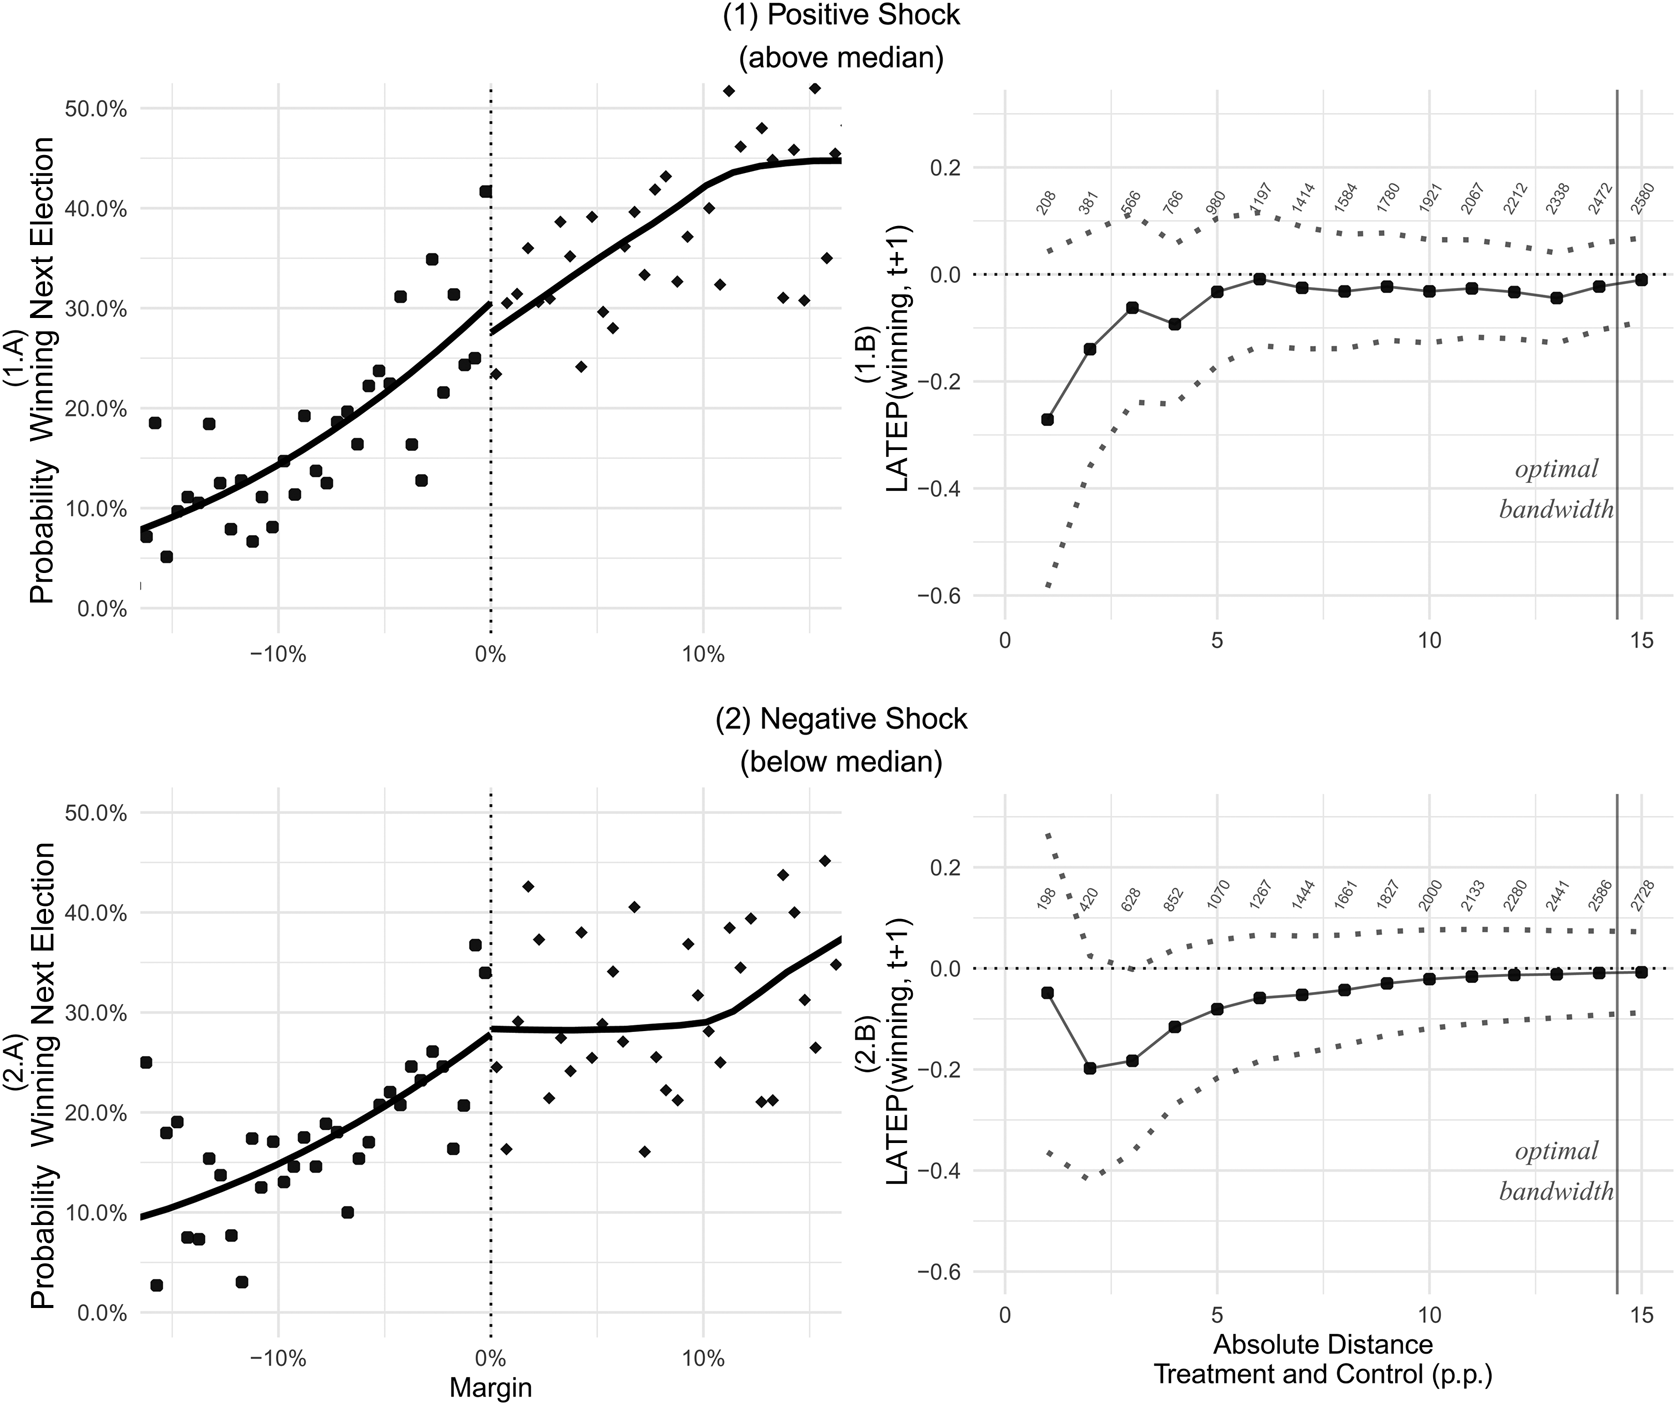
Can commodity shocks explain overall incumbency effects? To more clearly convey the magnitude of the impact of commodity shocks, Figures 2 and 3 graphically depict heterogeneous incumbency effects across rural and urban municipalities exposed to large negative or positive commodity shocks.Footnote 14 In the first column, the incumbency effect estimate can be visualized by comparing the LOWESS curves relating the probability of victory in t + 1 with the vote margin at time t for incumbents (positive vote margin) and challengers (negative vote margin) at the discontinuity located at the 0 vote margin. The second columns apply an incremental estimation of the incumbency effect, from smaller to larger distances from the cutoff, a procedure that, as suggested by Bueno and Tuñón (Reference Bueno and Tuñón2015), helps demonstrate that estimates are not sensitive to the choice of bandwidth.
Shocks and incumbency effects, rural municipalities.
Notes: The first row shows results for municipalities with shocks above the median municipal price index, and the second row shows results for municipalities below that median. The first column shows the scatterplot of the probability of winning the next election, according to the margin of votes. Line is a LOWESS estimate. The second column depicts the results of local linear models with year fixed effects of the incumbency effect, according to different absolute distances between winning and losing candidates. The numbers at the top of each panel show study group size, and the vertical line shows the optimal bandwidth estimated with the rdrobust package. Rural municipalities are above the median in terms of the percentage of rural population. A one-tailed test shows that the point estimated at the optimal bandwidth in 1.B is statistically smaller than the point in 2.B (z = 2.32), as well as smaller than equivalent points in Figure 3.

Commodity shocks and incumbency effects, urban municipalities.
Notes: The first row shows results for municipalities with shocks above the median municipal price index, and the second row shows results for municipalities below that median. The first column shows the scatterplot of the probability of winning the next election, according to the margin of votes. The line is a LOWESS estimate. The second column depicts the results of local linear models with year fixed effects of the incumbency effect, according to different absolute distances between winning and losing candidates. The numbers at the top of each panel show study group size, and the vertical line shows the optimal bandwidth estimated with the rdrobust package. Urban municipalities are below the median in terms of percentage of rural population. A one-tailed test does not rule out that the point estimated at the optimal bandwidth in 1.B is equal to the respective point in 2.B.

These results help clarify the relationship between commodity shocks, ruralness, and incumbency effects in Brazil. In fact, large exogenous commodity booms or busts do not seem to dictate the fates of incumbents in urban areas. In stark contrast, negative commodity shocks expose rural municipalities to a large incumbency disadvantage, while positive commodity shocks remove it. Taken together, our results suggest that the rural incumbency disadvantage afflicting Brazilian mayors is tightly linked to adverse changes in commodity prices.
We conduct two robustness tests for our results. First, we assess sensitivity to how we classify rural and urban municipalities. We focused on the share of the population that depends on the rural economy because it provides the most direct test of our claim that shocks are more electorally salient when voters' incomes depend on agriculture. As an alternative approach, we rely on Brazil's Institute of Geography and Statistics (IBGE), which developed a measure based on demographic density.Footnote 15 We re-estimated our main heterogeneous effects models using this alternative coding. The results do not differ substantively from our main results (see S.I.5 in the Online Appendix).
The second robustness test concerns unobserved differences between rural and urban municipalities that could alter the relationship between commodity shocks and incumbency effects. In a prior section, we showed that the overall incumbency effect within rural and urban groups is robust to controlling for several important confounders. However, it may still be the case that these confounders introduce bias in the interaction coefficient relating commodity shocks with incumbency effects. We examine this concern by including controls for these variables (additive and interacted with incumbency) in our core heterogeneous incumbency effects models in Table S.I.4 in the Online Appendix. The results are robust to this alternative specification. While conditioning on observables cannot conclusively rule out unobserved sources of bias, these results increase our confidence that the differential impact of commodity shocks between rural and urban municipalities is rooted in voters’ differential ties to agriculture.
Mechanisms
We now turn to study the mechanisms that link commodity shocks and incumbency effects. Our argument posits that voters update their evaluations of local incumbent performance as a result of exogenous commodity shocks to the municipal economy. We empirically examine this mechanism in two steps. First, we estimate the effect of commodity shocks on economic growth using linear regressions of the form:
 $$\Delta Y_{it} = \alpha + \beta \Pi _{it} + \lambda _t + { \' {\rm o} }_{it} , \eqno \;$$
where ΔY it is the average yearly change in economic growth in municipality i for mayoral term t, Πit is the commodity price index for said term, λ t are year fixed effects, and ó it is an error term. While our RDD uses the candidate-municipality-year as the unit of analysis, this test focuses on the municipality-year. This is because we are interested in assessing how one municipal-level aggregate, such as the change in commodity prices, influences another municipal-level aggregate, such as economic growth. To mimic the triangular kernel used in the RDD setup, we used weighted least squares (WLS) to give more weight to observations near the discontinuity cutoff.
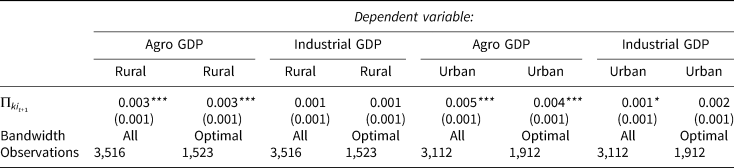
Results strongly indicate that commodity shocks have an impact on municipal GDP growth, especially in rural municipalities (see Table 3). We further probe the relationship by breaking down commodity-induced growth into industry versus primary sectors. In line with our expectations, commodity shocks only affect growth in the primary sector, and this effect is present for the primary sector in rural as well as urban municipalities.
Commodity Shocks and Total GDP Growth

*p < 0.1; **p < 0.05; ***p < 0.01
Coefficients linear regression of change in municipal GDP on commodity price index and year fixed effects. All outcomes are measured in first differences and weighted by a triangular kernel. Robust standard errors clustered by municipality in parenthesis. Data on municipal GDP comes from the IBGE.
The second step of our estimation asks the question: Does the impact of commodity shocks on rural economic growth carry over to incumbency effects? Answering it poses a familiar inferential challenge to mediation analysis: since economic growth, the mediator of interest, is post-treatment to commodity shocks, including both variables in a regression would bias the resulting coefficients. To circumvent this identification problem, we use commodity shocks as an instrumental variable. Specifically, we modify our core heterogeneous incumbency effects model, using economic growth and its interaction with incumbency as regressors and instrumenting them with commodity shocks and their interaction with incumbency.
The conditions for consistent estimation via instrumental variables are plausibly met in our setting. The fact that commodity prices are set internationally makes commodity price variation plausibly exogenous—an assumption bolstered by placebo tests. Our theoretical argument directly states the exclusion restriction: commodity shocks (the instrument) influence incumbency effects via economic growth (the endogenous regressor). The next subsection supports this claim with evidence that commodity shocks do not disturb other potential channels, such as fiscal variables or the nature of the pool of candidates. Lastly, this section has also demonstrated that commodity shocks are a strong instrument for economic growth.Footnote 16 The results from two-stage least squares estimation show that economic growth, as instrumented by commodity shocks, has a strong and positive impact on incumbency effects (see Section S.I.7 in the Online Appendix).
Taken together, our results so far suggest that commodity shocks produce incumbency effects because exogenously induced growth directly conditions voters' evaluations of incumbent performance. In the remainder of this section, we evaluate several alternative interpretations.
Voter Learning
An alternative mechanism concerns how voters learn from exogenous events. As Ashworth, Bueno de Mesquita, and Friedenberg (Reference Ashworth, Bueno de Mesquita and Friedenberg2018) persuasively argue, voters may not directly draw inferences about incumbent quality from commodity shocks, but indirectly extract signals by observing how competently the incumbent manages shocks. In Brazilian municipalities, a voter could potentially learn about incumbent quality if the mayor adopts fiscal measures to contain or facilitate the local impact of a potential shock.Footnote 17
We empirically examine this fiscal pathway using our municipality-year ordinary least squares (OLS) regressions to estimate the impact of commodity shocks on measures of fiscal performance in rural municipalities. We consider total municipal spending and a measure of public goods spending, which includes health, education, and transportation. We also explore personnel spending as another measure of performance, following prior work showing the electoral returns to patronage in Brazil (Bhavnani and Lupu Reference Bhavnani and Lupu2016; Brollo et al. Reference Brollo2013). All measures are calculated as percentage changes. The results, shown in Table 5, fail to reveal evidence that commodity shocks influence mayoral spending and are thus inconsistent with voters learning from shock-induced changes in fiscal policy.
Commodity Shocks and GDP Growth by Sector

*p < 0.1; **p < 0.05; ***p < 0.01
Coefficients of linear regression change in components of municipal GDP on commodity price index and year fixed effects. All outcomes are measured in first differences and weighted by a triangular kernel. ‘Optimal’ is the optimal bandwidth calculated using the algorithm in Calonico, Cattaneo and Titiunik (2014). Robust standard errors clustered by municipality in parenthesis. Data on municipal GDP comes from the IBGE.
Commodity shocks and Fiscal Performance, Rural Municipalities

*p < 0.1; **p < 0.05; ***p < 0.01
Coefficients from linear regressions of change in various measures of municipal fiscal performance on commodity price index and year fixed effects, weighted by a triangular kernel. All outcomes are measured in first differences. ‘Optimal’ is the optimal bandwidth calculated using the algorithm in Calonico, Cattaneo and Titiunik (2014). Robust standard errors clustered by municipality in parenthesis. Data on fiscal performance comes from Finanças do Brasil Dataset from Finance Ministry.
Candidate Quality
Another alternative explanation is that changes in candidate quality drive the relationship between commodity shocks and incumbency effects. This offers another channel for voters to extract a signal of candidate quality from shocks, one not captured by our fiscal measures. As we have shown, RDD balances candidate quality at t and thus narrows the room for selection on quality. Critically, though, as noted by Eggers (Reference Eggers2017), RDD cannot rule out changes in candidate quality between t and t + 1. If voters react to commodity shocks because the pool of candidates is changing, we should observe a difference in the types of candidates or parties winning before and after shocks.
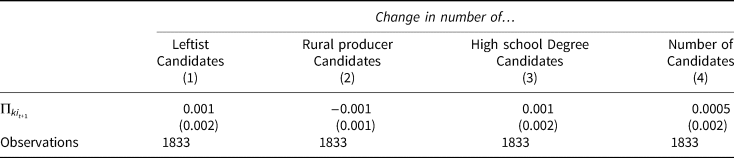
We examine this hypothesis in two ways. First, we test whether price volatility affects the quality of the pool of candidates. Since this relationship concerns municipal-level aggregates, we estimate linear regressions of measures of change in municipal-year candidate quality on commodity price variation, including year fixed effects. We measure changes in the pool of candidates in terms of party ideology, occupation, education, and total number of candidates (see Table 6). Ideology refers to the change in total number of leftist candidates between current and future elections.Footnote 18 Occupation is the difference in the number of candidates whose occupation is tied to agriculture. Education is the difference in the number of candidates with a high school or college degree. The null effect, presented in Table 6, suggests that price shocks do not change the composition of the candidate pool in rural municipalities.
Difference in the pool of candidates and price change, rural municipalities.

*p < 0.1; **p < 0.05; ***p < 0.01
Coefficients of linear regressions of change in various candidate quality attributes on the commodity price index and year fixed effects, weighted by a triangular kernel. Estimations at the optimal bandwidth calculated using the algorithm in Calonico, Cattaneo and Titiunik (2014). All outcomes are measured in first differences. robust standard errors clustered by municipality in parenthesis.
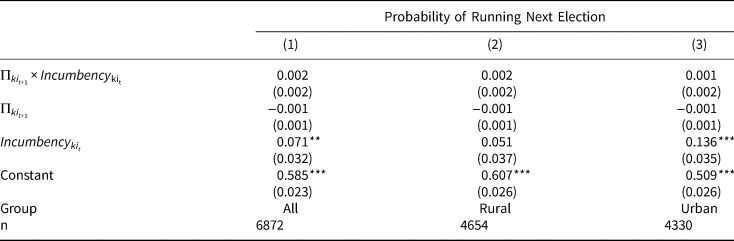
A change of quality between t and t + 1 could also manifest in differential entry and exit patterns between incumbents and challengers. In Brazil, at least 30 per cent of incumbents decide not to run for reelection. If incumbents are more likely to run when commodity prices are rising than when they are declining, and challengers exhibit the opposite behavior, strategic entry and exit could explain the link between commodity shocks and incumbency effects. In Table 7 we explore this hypothesis by estimating our core heterogeneous incumbency effects model with a binary indicator of running in t + 1 as the outcome. The results are inconsistent with a strategic entry or exit logic. Commodity shocks do not have a statistically discernible impact on candidates' probability of running.
Heterogeneous Incumbency Effects on Probability of Running

*p < 0.1; **p < 0.05; ***p < 0.01
Coefficients of local linear regressions of a binary measure of a candidate running for the mayoral office in t + 1 on commodity price index, an incumbency indicator, and their interaction, as well as vote margin and its interaction with incumbency. Optimal bandwidth calculated using the algorithm in Calonico, Cattaneo and Titiunik (2014). All specifications include year fixed effects and robust standard errors clustered by municipality (in parenthesis), and are weighted by a triangular kernel.
The type of candidate and party may also moderate the impact of commodity shocks if voters hold only some parties accountable for it. Although party labels in Brazil are not very informative at the local level, some parties, such as the Democratas and the Brazilian Democratic Mobilization Party, often represent rural interests. Meanwhile, the left-wing Workers' Party (PT) has a working-class base and is, potentially, less likely to cater to rural interests. The PT is also considered to be more programmatic and organized (Klašnja and Titiunik Reference Klašnja and Titiunik2017; Samuels and Zucco Reference Samuels and Zucco2014), and the party controlled the presidency during this period (Bueno Reference Bueno2018; Feierherd Reference Feierherd2020). We also test for differential effects among candidates that have a professional background in agriculture. We do not find evidence that commodity shocks have a differential impact on the incumbency effects of conservative parties (see Tables S.I.9 and S.I.10 in the Online Appendix). Voters do hold rural candidates relatively more accountable for shocks. However, shocks do not encourage more participation of these candidates, which is still consistent with voters directly reacting to the shock than to changes in quality (see Tables S.I.11 and S.I.12 in the Online Appendix).
Campaign spending
Campaign resources are another potential channel through which exogenous shocks may influence incumbency effects (Fouirnaies and Hall Reference Fouirnaies and Hall2014). Given the weakness of party organizations, Brazilian politicians rely more on donations to run campaigns than on programmatic party labels. Economic elites may strategically allocate resources to incumbents or their opponents depending on commodity prices (Bueno and Dunning Reference Bueno and Dunning2017). We examine this financial mechanism with two different approaches. First, in Table S.I.7 in the Online Appendix, we use total campaign expenses as an outcome in our heterogeneous incumbency effects analysis. Second, in Table S.I.8 in the Online Appendix, we use the total number of individuals receiving any official payment from candidates' campaigns to capture the level of support from activists and brokers. In both tests, we find no evidence to suggest that price shocks systematically affect the resources received by incumbents and challengers in Brazilian mayoral elections.
Conclusion
Why do incumbency effects emerge? Why do we observe incumbency advantage in some settings and incumbency disadvantage in others? Drawing on recent work on retrospective voting, we advance a novel theoretical explanation that stresses exogenous economic shocks as a systematic source of incumbency effects. We empirically test this argument by exploiting variation in commodity prices across Brazilian municipalities. Embedding a plausibly exogenous measure of change in municipal commodity prices in a RDD, we show that price shocks systematically shape the causal effect of incumbency, particularly in rural municipalities. Further analyses suggest that the effect runs through the impact of commodity shocks on local economic growth.
Our argument and evidence make important contributions to comparative research on incumbency effects and to ongoing debates about electoral accountability. Recent scholarship in comparative politics argues that politicians are so opportunistic in developing democracies that voters systematically oust them from office. We complement this research by showing that incumbency effects in developing countries may also be rooted in voters' attempts at selecting good representatives and that, as a result, they may not operate in a uniform direction.
Can our explanation help understand incumbency effects outside of the context of Brazilian municipalities? There are two main scope conditions to our argument. The first one is the focus on commodity shocks. It is worth noting that commodity dependence is a common feature of many developing economies and even some developed ones (Campello and Zucco Reference Campello and Zucco2020).Footnote 19 Furthermore, from a theoretical standpoint, we expect that any exogenous shock that influences voters’ evaluations will have a systematic impact on incumbency effects. Thus, our argument can be extended to examine how other electorally consequential yet exogenous economic outcomes induce incumbency advantage and disadvantage, such as remittances (Tertytchnaya et al. Reference Tertytchnaya2018).
A second scope condition emerges from the high salience of incumbent performance in Brazilian mayoral elections. In fact, our argument suggests that exogenous shocks will not influence incumbency effects when voters do not evaluate incumbents for economic performance. We probed this by focusing on Brazilian local councilors, who are elected concurrently and in the same district as mayors but control no policy instrument, and who we do not expect to be held accountable for economic outcomes. As expected, we find no discernible link between commodity prices and incumbency effects for Brazilian local councilors (see S.I.14 in the Online Appendix). This suggests that our argument is more likely to hold for offices in which voters attribute responsibility to the incumbent for the economy. The finding is consistent with canonical models of retrospective voting, where clear responsibility is also a precondition for retrospective voting (see, for example, Duch and Stevenson Reference Duch and Stevenson2008).
Our article also has implications for debates about voter competence to engage in electoral accountability. We employ multiple empirical strategies and draw on different sources of data to empirically diagnose whether voters are learning from exogenous shocks. Contrary to accountability pessimists, who maintain that reacting to an exogenous shock indicates that voters are irrational, we find that commodity shocks shape elections via economic growth, an outcome that is closely tied to their welfare, especially in rural areas, where the effect is more dominant. In fact, economic growth may be one of the few shortcuts available to voters in the low-information environment of Brazilian municipalities.
Our results also qualify optimistic interpretations suggesting that voters can extract informative signals of candidate quality from how an incumbent manages an exogenous shock (Ashworth, Bueno de Mesquita, and Friedenberg Reference Ashworth, Bueno de Mesquita and Friedenberg2018). We study a setting in which incumbents have limited tools to signal competence to voters and employ a research design that narrows the scope for quality differentials. Our empirical analysis of mechanisms also produces results that are inconsistent with voters learning from fiscal policy or from changes in candidate quality.
In sum, commodity shocks may reduce voters' ability to assess incumbents' performance, potentially resulting in the reelection of bad candidates and the removal of good ones. Yet, our results suggest that the impact of commodity shocks on retrospection is a problem of incomplete information rather than one of voter irrationality. Hence, we believe that our research carries lessons about how to improve electoral accountability. We show that voters navigate a noisy environment devoid of partisan cues by basing their decisions on outcomes related to their welfare. Thus, our results suggest that electoral accountability is not doomed to fail in developing countries and that it could be improved by providing information that would help voters better disentangle exogenous shocks from incumbents' actions.
Supplementary Material
Online appendices are available at: https://doi.org/10.1017/S0007123421000478
Data Availability Statement
Replication data for this article can be found in Harvard Dataverse at: https://doi.org/10.7910/DVN/EV8CBE
Acknowledgements
For comments and advice, we would like to thank Jazmín Sierra, Larry Bartels, Alejandro Bonvecchi, Ernesto Calvo, Daniela Campello, Ryan Carlin, Ray Duch, Andy Eggers, Germán Feierherd, Federico Fuchs, Jeff Harden, Robin Harding, Danny Hidalgo, Gabe Lenz, Julien Labonne, Noam Lupu, Virginia Oliveros, Vicky Paniagua, Aníbal Pérez Liñán, Ana Petrova, Alison Post, Natán Skigin, David Steinberg, Guillermo Trejo, Guadalupe Tuñon, Carlos Velasco, Cesar Zucco, four anonymous reviewers, and the editors of the British Journal of Political Science. We also thank audiences at the Notre Dame Latin American Politics Workshop, the 2015 Meetings of the American Political Science Association and of the Midwest Political Science Association and ANPEC with Associação Nacional dos Centros de Pós-Graduação em Economia, the 2016 Meeting of the European Political Science Association, the IAST-Science Po Workshop (2018), and the Oxford Accountability Conference (2019).
Financial Support
None
Competing Interests
None